

Optical coherence tomography findings as a predictor of clinical course in patients with branch retinal vein occlusion treated with ranibizumab
- PMID: 29924853
- PMCID: PMC6010278
- DOI: 10.1371/journal.pone.0199552
Optical coherence tomography findings as a predictor of clinical course in patients with branch retinal vein occlusion treated with ranibizumab
Abstract
Purpose: To examine the relationship between optical coherence tomography (OCT) images and clinical course in eyes with branch retinal vein occlusion (BRVO) treated with intravitreal ranibizumab injection (IVR).
Design: Prospective cohort study.
Participants: Thirty eyes of 30 patients with BRVO treated with IVR.
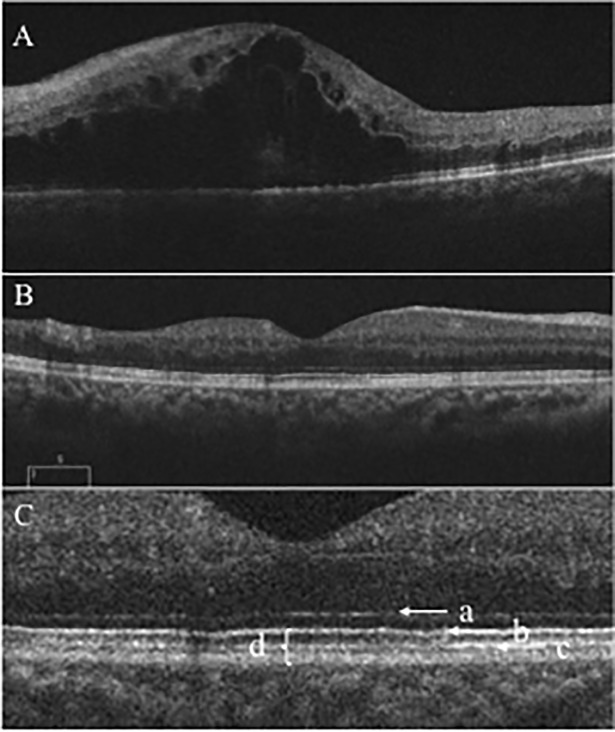
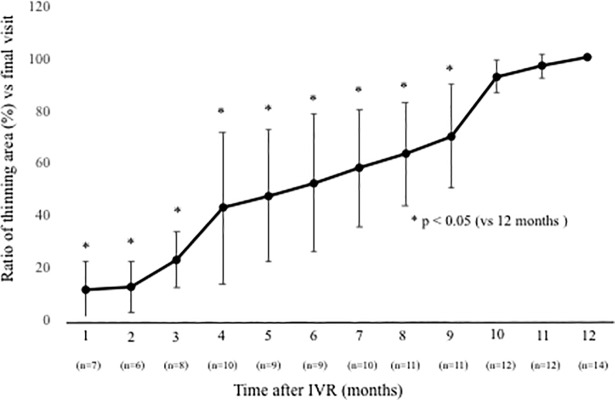
Methods: All patients received 1 initial IVR followed by repeated injections in the pro re nata (PRN) regimen. Correlations between logarithm of minimum angle of resolution best-corrected visual acuity (logMAR BCVA) or number of IVRs after 12 months and OCT parameters including the external limiting membrane (ELM), ellipsoid zone (EZ), interdigitation zone (IZ), and photoreceptor outer segment (PROS) length at first resolution of macular edema (ME) were assessed. Resolution of ME was defined as central foveal thickness <300 μm and the absence of subretinal fluid. OCT parameters influencing BCVA and number of IVRs were evaluated using multivariate analysis. Correlations between nonperfusion areas (NPAs) and thinning areas and changes in retinal thickness of BRVO-affected areas were assessed.
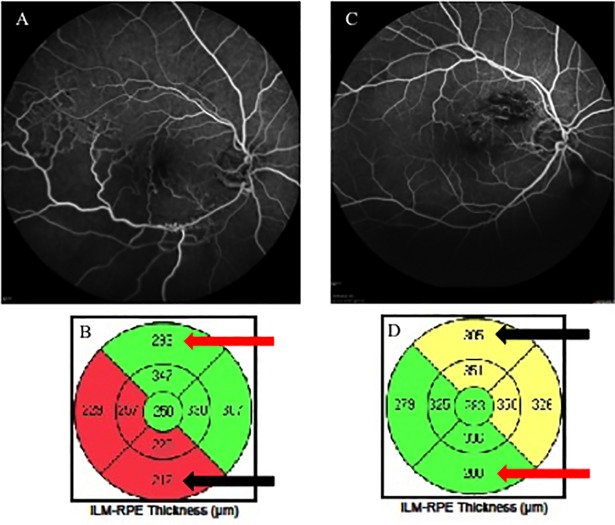
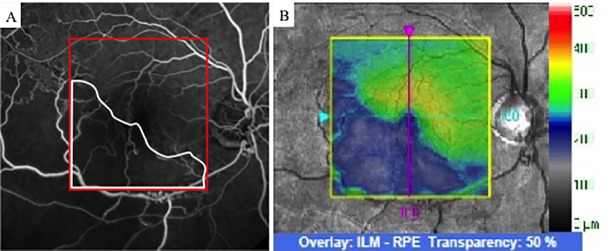
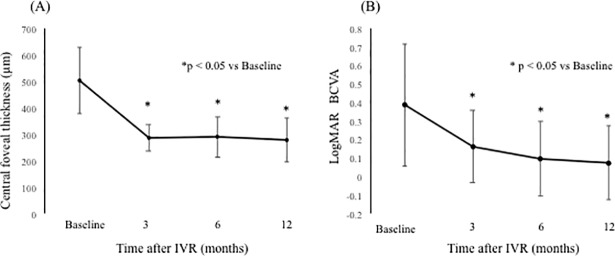
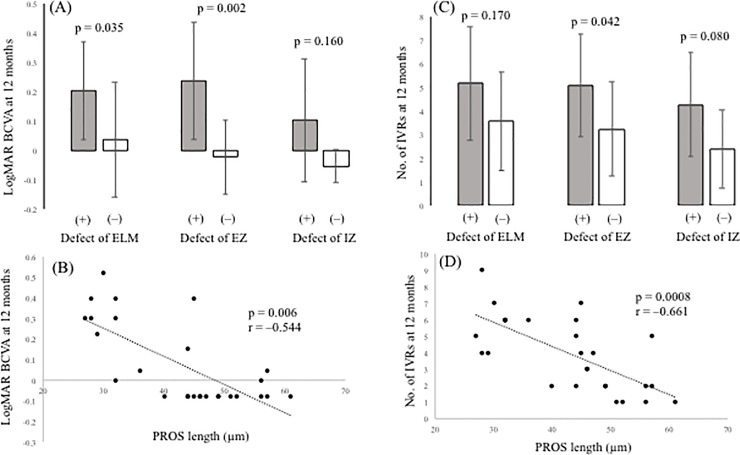
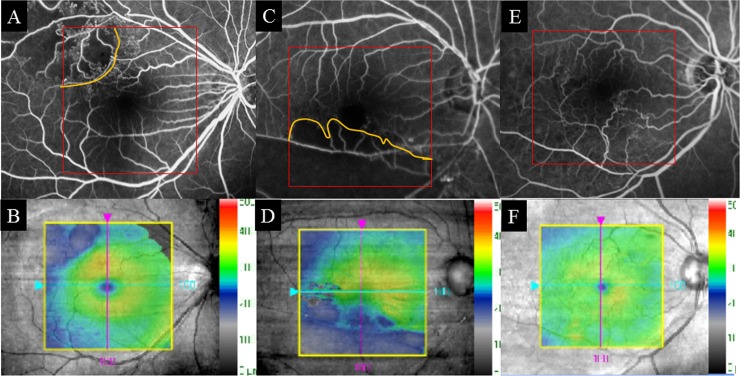
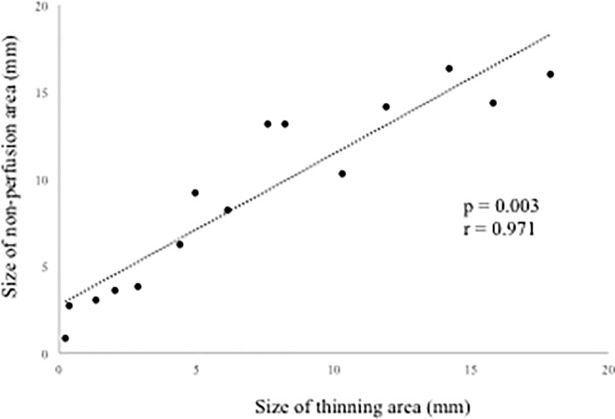
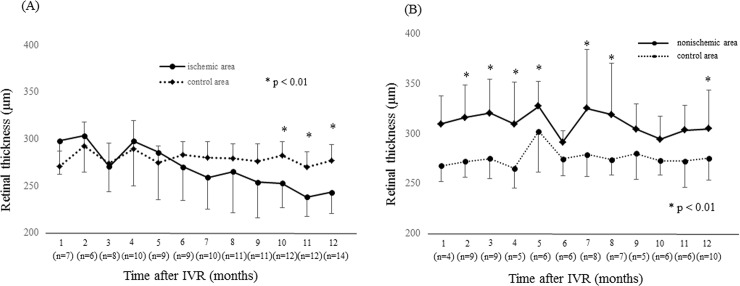
Results: Of the 30 patients, 27 completed this study and were included in the statistical analyses. The mean logMAR BCVA at 3, 6, and 12 months was 0.16 ± 0.19, 0.09 ± 0.20, and 0.07 ± 0.20, respectively, which improved significantly from baseline at each visit (p < 0.0001, respectively), while the mean number of IVRs at 12 months was 3.9 ± 2.2. The mean number of IVRs for the first resolution of ME was 1.6 ± 0.8. Eyes with ELM and EZ defects at the points of first resolution of ME were correlated with a significantly lower BCVA at 12 months compared with eyes with preserved ELMs and EZs (p = 0.035, p = 0.002, respectively). However, eyes with IZ defects at the points of first resolution of ME were not correlated with a significantly lower BCVA at 12 months compared with eyes with preserved IZs (p = 0.160). Defects in the EZ at the points of first resolution of ME significantly affected the number of IVRs at 12 months (p = 0.042), although the ELM and IZ did not. PROS length at the points of first resolution of ME was significantly correlated with BCVA and number of IVRs at 12 months (p = 0.006, p = 0.0008, respectively). In multivariate analysis, PROS length at the points of first resolution of ME had the most significant effect on BCVA and number of IVRs (p = 0.013, p = 0.012, respectively). NPA size on fluorescein angiography and thinning area on OCT within the macular area showed a significant correlation (p = 0.003, r = 0.971). The retinal thickness of ischemic BRVO-affected areas was significantly less than that of control areas at 10, 11, and 12 months (p = 0.001, p = 0.005, p = 0.003, respectively).
Conclusion: We showed that the 1+PRN regimen may be a useful therapy for ME due to BRVO. In addition, PROS length at points of first resolution of ME appears to be a good indicator of BCVA and number of IVRs in BRVO patients.
Conflict of interest statement
This work received research funding support from Novartis Pharma K.K. The funding support received does not alter our adherence to PLOS ONE policies on sharing data and materials. The authors declare no other potential competing interests related to the publication of this paper or the study on which it was based.
Figures
Similar articles
-
Macular vessel reduction as predictor for recurrence of macular oedema requiring repeat intravitreal ranibizumab injection in eyes with branch retinal vein occlusion.Br J Ophthalmol. 2019 Oct;103(10):1367-1372. doi: 10.1136/bjophthalmol-2018-312769. Epub 2018 Dec 4. Br J Ophthalmol. 2019. PMID: 30514711
-
Intravitreal ranibizumab for macular edema secondary to retinal vein occlusion.Ophthalmologica. 2012;227(3):132-8. doi: 10.1159/000334906. Epub 2011 Dec 29. Ophthalmologica. 2012. PMID: 22212151
-
Multimodal imaging to distinguish microvascular and morphological changes in retinal vein occlusion after intravitreal ranibizumab with or without triamcinolone acetonide injection.BMC Ophthalmol. 2024 Aug 20;24(1):354. doi: 10.1186/s12886-024-03619-y. BMC Ophthalmol. 2024. PMID: 39164640 Free PMC article.
-
Comparison of one and three initial monthly intravitreal ranibizumab injection in patients with macular edema secondary to branch retinal vein occlusion.Int J Ophthalmol. 2018 Sep 18;11(9):1534-1538. doi: 10.18240/ijo.2018.09.17. eCollection 2018. Int J Ophthalmol. 2018. PMID: 30225230 Free PMC article.
-
Arteriovenous crossing associated with branch retinal vein occlusion.Jpn J Ophthalmol. 2019 Sep;63(5):353-364. doi: 10.1007/s10384-019-00676-5. Epub 2019 Aug 8. Jpn J Ophthalmol. 2019. PMID: 31396750 Review.
Cited by
-
Short-Term Hyperuricemia Leads to Structural Retinal Changes That Can be Reversed by Serum Uric Acid Lowering Agents in Mice.Invest Ophthalmol Vis Sci. 2022 Sep 1;63(10):8. doi: 10.1167/iovs.63.10.8. Invest Ophthalmol Vis Sci. 2022. PMID: 36098977 Free PMC article.
-
Predictors of macular edema recurrence and visual outcomes in branch retinal vein occlusion treated with aflibercept or ranibizumab.Int Ophthalmol. 2025 Mar 14;45(1):96. doi: 10.1007/s10792-025-03480-y. Int Ophthalmol. 2025. PMID: 40085265
-
Comparison of Choroidal Thickness, Foveal Avascular Zone, and Macular Capillary Density in Macular Edema Secondary to Branch Retinal Vein Occlusion Treated with Ranibizumab or Aflibercept-A Prospective Study.Medicina (Kaunas). 2022 Apr 14;58(4):540. doi: 10.3390/medicina58040540. Medicina (Kaunas). 2022. PMID: 35454378 Free PMC article.
-
Predicting recurrences of macular edema due to branch retinal vein occlusion during anti-vascular endothelial growth factor therapy.Graefes Arch Clin Exp Ophthalmol. 2020 Jan;258(1):49-56. doi: 10.1007/s00417-019-04495-9. Epub 2019 Nov 15. Graefes Arch Clin Exp Ophthalmol. 2020. PMID: 31732812
-
Macular Pigment Optical Density and Photoreceptor Outer Segment Length as Predisease Biomarkers for Age-Related Macular Degeneration.J Clin Med. 2020 May 5;9(5):1347. doi: 10.3390/jcm9051347. J Clin Med. 2020. PMID: 32380638 Free PMC article.
References
-
- The Branch Vein Occlusion Study Group. Argon laser photocoagulation for macular edema in branch vein occlusion. Am J Ophthalmol. 98, 271–282 (1984). - PubMed
-
- Scott I. U., Ip M. S., VanVeldhuisen P. C., Oden N. L., Blodi B. A., Fisher M. et al. A randomized trial comparing the efficacy and safety of intravitreal triamcinolone with standard care to treat vision loss associated with macular edema secondary to branch retinal vein occlusion: the Standard Care vs Corticosteroid for Retinal Vein Occlusion (SCORE) study report 6. Arch Ophthalmol. 127, 1115–1128 (2009). doi: 10.1001/archophthalmol.2009.233 - DOI - PMC - PubMed
-
- Campochiaro P. A., Heier J. S., Feiner L., Gray S., Saroj N., Rundle A. C. et al. Ranibizumab for macular edema following branch retinal vein occlusion: six-month primary end point results of a phase III study. Ophthalmology 117, 1102–1112 (2010). doi: 10.1016/j.ophtha.2010.02.021 - DOI - PubMed
-
- Brown D. M., Campochiaro P. A., Bhisitkul R. B., Ho A. C., Gray S. et al. Sustained benefits from ranibizumab for macular macular edema following branch retinal vein occlusion: 12-month outcomes of a phase III study. Ophthalmology 118, 1594–1602 (2011). doi: 10.1016/j.ophtha.2011.02.022 - DOI - PubMed
-
- Trach A. B., Yau L., Hoang C., Tuomi L. Time to clinically significant visual acuity gains after ranibizumab treatment for retinal vein occlusion: BRAVO and CRUISE trials. Ophthalmology 121, 1059–1602 (2014). doi: 10.1016/j.ophtha.2013.11.022 - DOI - PubMed
Publication types
MeSH terms
Substances
LinkOut - more resources
Full Text Sources
Other Literature Sources
Miscellaneous
