

Food restriction promotes damage reduction in rat models of type 2 diabetes mellitus
- PMID: 29924854
- PMCID: PMC6010257
- DOI: 10.1371/journal.pone.0199479
Food restriction promotes damage reduction in rat models of type 2 diabetes mellitus
Abstract
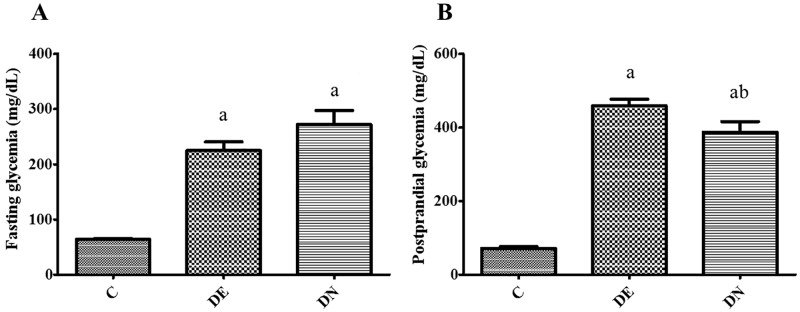
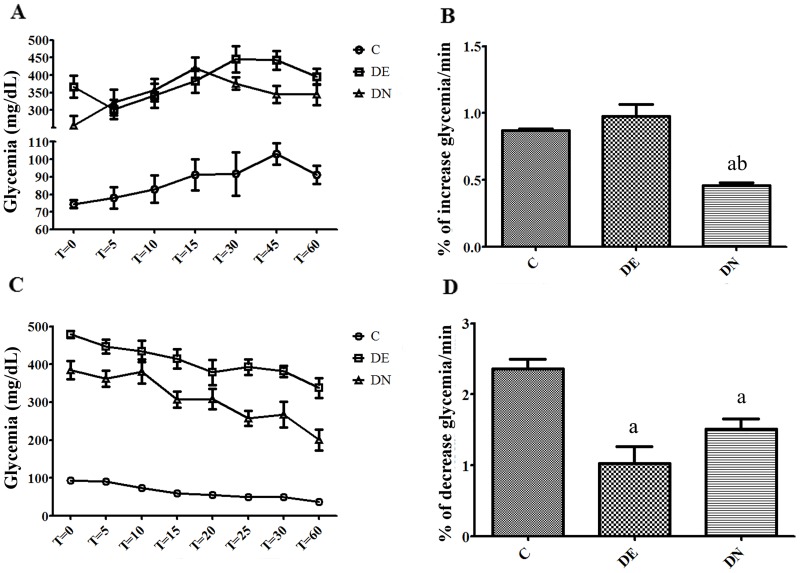
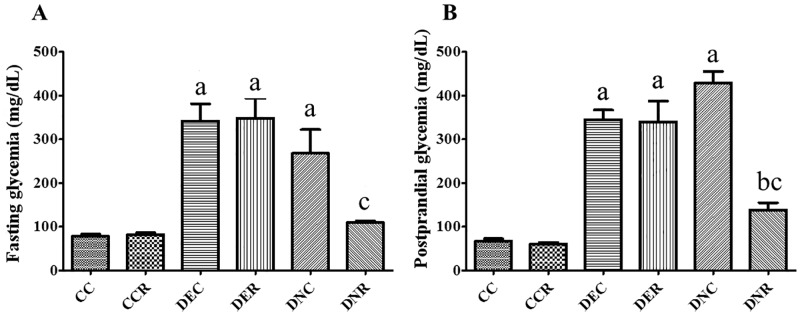
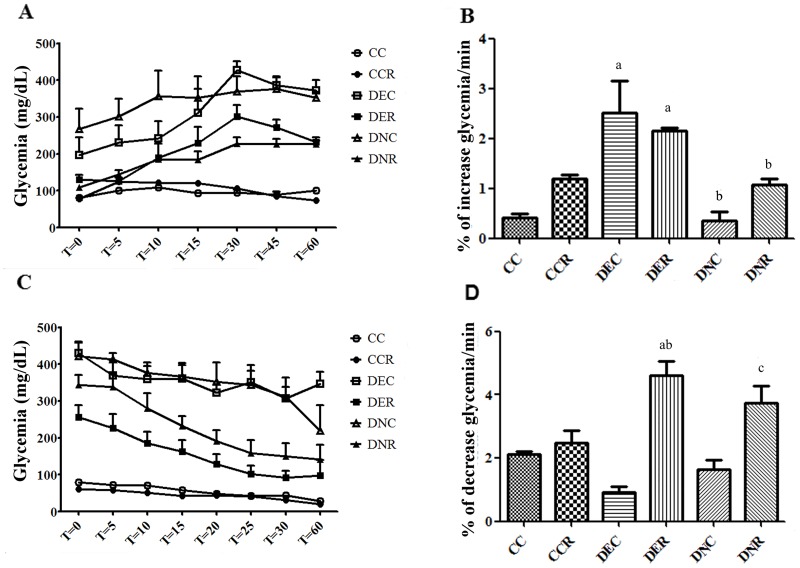
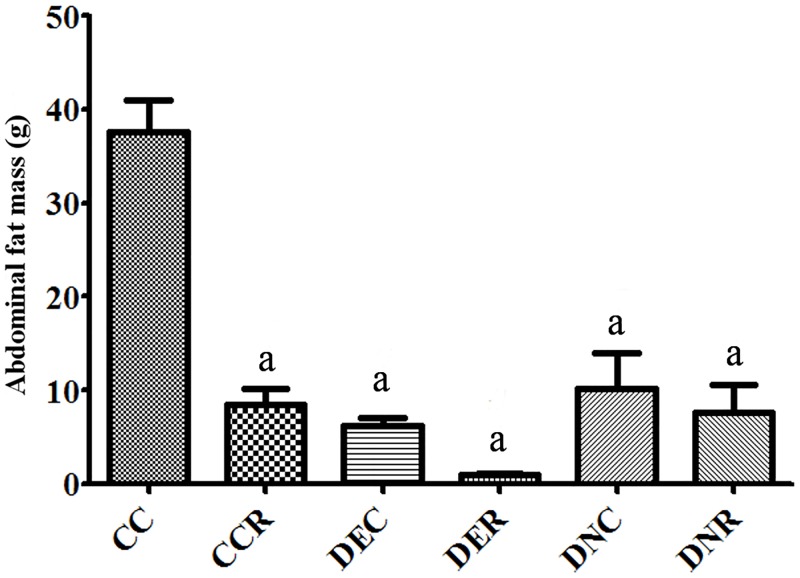
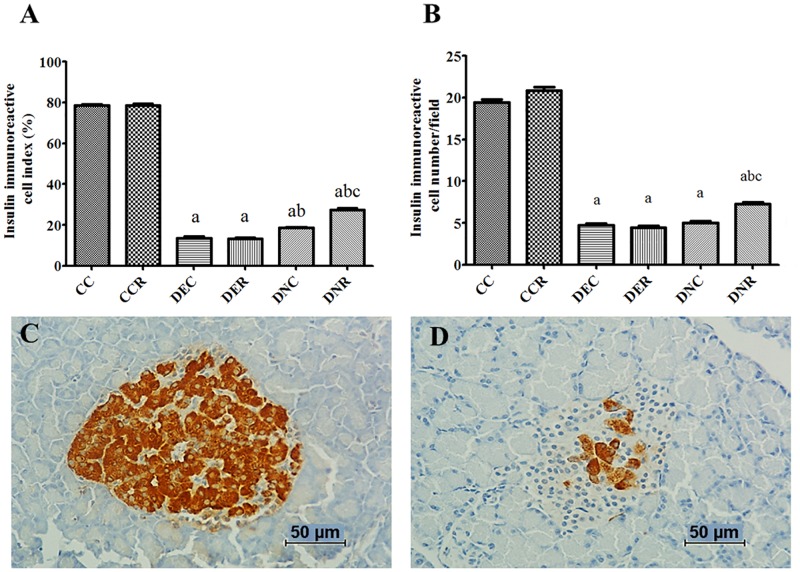
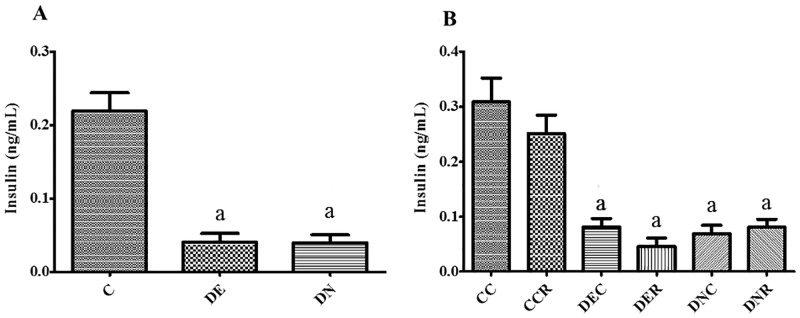
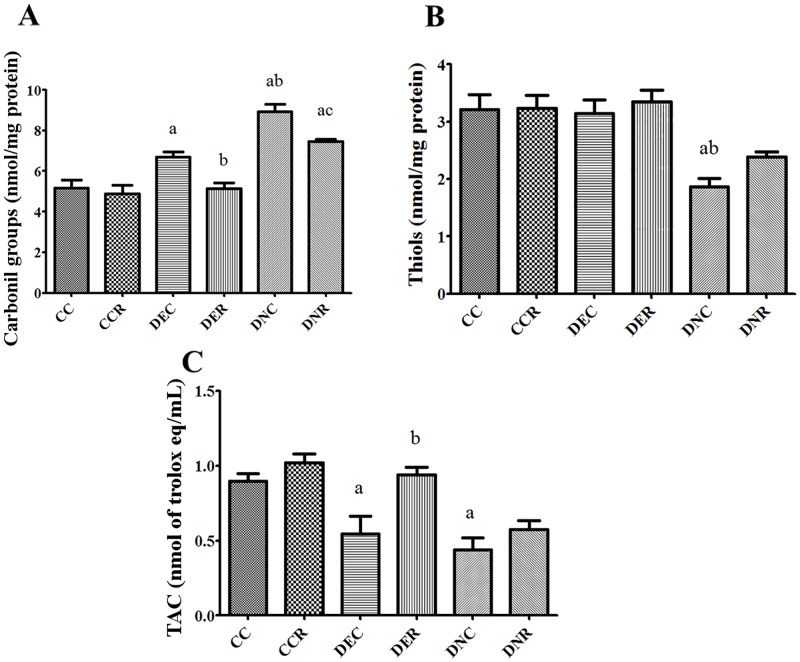
There are several animal models of type 2 diabetes mellitus induction but the comparison between models is scarce. Food restriction generates benefits, such as reducing oxidative stress, but there are few studies on its effects on diabetes. The objective of this study is to evaluate the differences in physiological and biochemical parameters between diabetes models and their responses to food restriction. For this, 30 male Wistar rats were distributed in 3 groups (n = 10/group): control (C); diabetes with streptozotocin and cafeteria-style diet (DE); and diabetes with streptozotocin and nicotinamide (DN), all treated for two months (pre-food restriction period). Then, the 3 groups were subdivided into 6, generating the groups CC (control), CCR (control+food restriction), DEC (diabetic+standard diet), DER (diabetic+food restriction), DNC (diabetic+standard diet) and DNR (diabetic+food restriction), treated for an additional two months (food restriction period). The food restriction (FR) used was 50% of the average daily dietary intake of group C. Throughout the treatment, physiological and biochemical parameters were evaluated. At the end of the treatment, serum biochemical parameters, oxidative stress and insulin were evaluated. Both diabetic models produced hyperglycemia, polyphagia, polydipsia, insulin resistance, high fructosamine, hepatic damage and reduced insulin, although only DE presented human diabetes-like alterations, such as dyslipidemia and neuropathy symptoms. Both DEC and DNC diabetic groups presented higher levels of protein carbonyl groups associated to lower antioxidant capacity in the plasma. FR promoted improvement of glycemia in DNR, lipid profile in DER, and insulin resistance and hepatic damage in both diabetes models. FR also reduced the protein carbonyl groups of both DER and DNR diabetic groups, but the antioxidant capacity was improved only in the plasma of DER group. It is concluded that FR is beneficial for diabetes but should be used in conjunction with other therapies.
Conflict of interest statement
The authors have declared that no competing interests exist.
Figures
Similar articles
-
Appropriate Insulin Level in Selecting Fortified Diet-Fed, Streptozotocin-Treated Rat Model of Type 2 Diabetes for Anti-Diabetic Studies.PLoS One. 2017 Jan 27;12(1):e0170971. doi: 10.1371/journal.pone.0170971. eCollection 2017. PLoS One. 2017. PMID: 28129400 Free PMC article.
-
The combined effect of metformin and L-cysteine on inflammation, oxidative stress and insulin resistance in streptozotocin-induced type 2 diabetes in rats.Eur J Pharmacol. 2013 Aug 15;714(1-3):448-55. doi: 10.1016/j.ejphar.2013.07.002. Epub 2013 Jul 9. Eur J Pharmacol. 2013. PMID: 23845213
-
Reduction in hyperglycemia by mild food restriction in streptozotocin induced diabetic rats improves insulin sensitivity.Horm Metab Res. 1994 Jul;26(7):316-21. doi: 10.1055/s-2007-1001694. Horm Metab Res. 1994. PMID: 7959606
-
A review of the molecular pathways mediating the improvement in diabetes mellitus following caloric restriction.J Cell Physiol. 2019 Jun;234(6):8436-8442. doi: 10.1002/jcp.27760. Epub 2018 Nov 13. J Cell Physiol. 2019. PMID: 30426486 Review.
-
Molecular and cellular bases of diabetes: Focus on type 2 diabetes mouse model-TallyHo.Biochim Biophys Acta Mol Basis Dis. 2019 Sep 1;1865(9):2276-2284. doi: 10.1016/j.bbadis.2019.05.004. Epub 2019 May 11. Biochim Biophys Acta Mol Basis Dis. 2019. PMID: 31082469 Review.
Cited by
-
Ficus deltoidea extract down-regulates protein tyrosine phosphatase 1B expression in a rat model of type 2 diabetes mellitus: a new insight into its antidiabetic mechanism.J Nutr Sci. 2020 Jan 20;9:e2. doi: 10.1017/jns.2019.40. J Nutr Sci. 2020. PMID: 32042410 Free PMC article.
-
Whey protein enriched with Stevia rebaudiana fraction restores the pancreatic function of streptozotocin induced diabetic rats.J Food Sci Technol. 2021 Feb;58(2):805-810. doi: 10.1007/s13197-020-04799-3. Epub 2020 Sep 25. J Food Sci Technol. 2021. PMID: 33568874 Free PMC article.
-
Safety evaluation of Balanced Health Care Dan-A medicinal formulation containing traditional edible ingredients in lung tumor-loaded mice.Food Sci Nutr. 2022 Dec 21;11(3):1544-1552. doi: 10.1002/fsn3.3195. eCollection 2023 Mar. Food Sci Nutr. 2022. PMID: 36911849 Free PMC article.
-
Understanding Dietary Intervention-Mediated Epigenetic Modifications in Metabolic Diseases.Front Genet. 2020 Oct 15;11:590369. doi: 10.3389/fgene.2020.590369. eCollection 2020. Front Genet. 2020. PMID: 33193730 Free PMC article. Review.
References
-
- World Health Organization. Global report on diabetes. 2016. http://apps.who.int/iris/bitstream/10665/204871/1/9789241565257_eng.pdf.
-
- Wild S, Roglic G, Green A, Sicree R, King H. Global prevalence of diabetes: estimates for the year 2000 and projections for 2030. Diabetes Care. 2004;27: 1047–1053. - PubMed
-
- Blagosklonny MV. TOR-centric view on insulin resistance and diabetic complications: perspective for endocrinologists and gerontologists. Cell Death Dis. 2013;4: e964 doi: 10.1038/cddis.2013.506 - DOI - PMC - PubMed
-
- Brereton MF, Iberl M, Shimomura K, Zhang Q, Adriaenssens AE, Proks P, et al. Reversible changes in pancreatic islet structure and function produced by elevated blood glucose. Nat Commun. 2014;5: 4639 doi: 10.1038/ncomms5639 - DOI - PMC - PubMed
-
- Vincent AM, Russell JW, Low P, Feldman EL. Oxidative stress in the pathogenesis of diabetic neuropathy. Endocr Rev. 2004;25: 612–628. doi: 10.1210/er.2003-0019 - DOI - PubMed
Publication types
MeSH terms
Substances
LinkOut - more resources
Full Text Sources
Other Literature Sources
Medical
Research Materials
