. 2018 Jun 19;48(6):1119-1134.e7.
doi: 10.1016/j.immuni.2018.04.024.

Transcription Factor PU.1 Represses and Activates Gene Expression in Early T Cells by Redirecting Partner Transcription Factor Binding

Affiliations

Transcription Factor PU.1 Represses and Activates Gene Expression in Early T Cells by Redirecting Partner Transcription Factor Binding

Hiroyuki Hosokawa et al. Immunity. .

Erratum in

Abstract

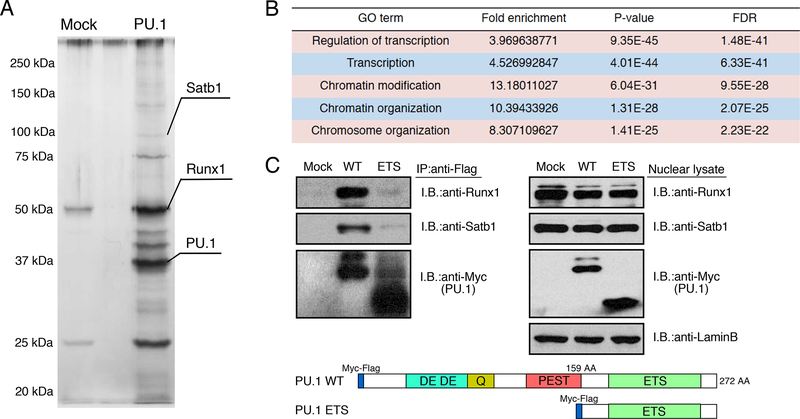
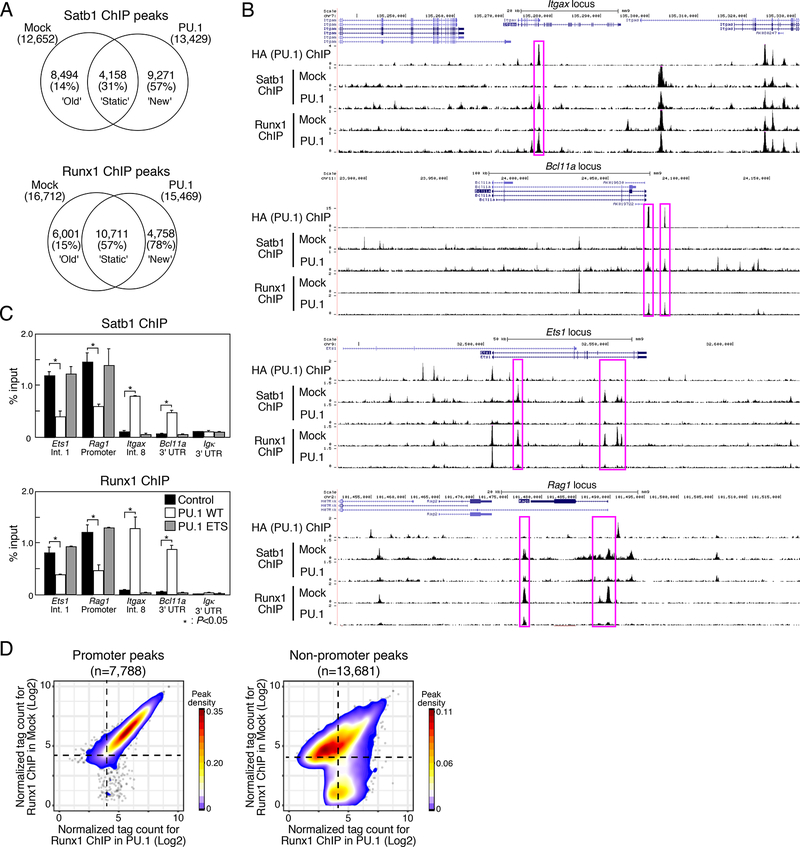
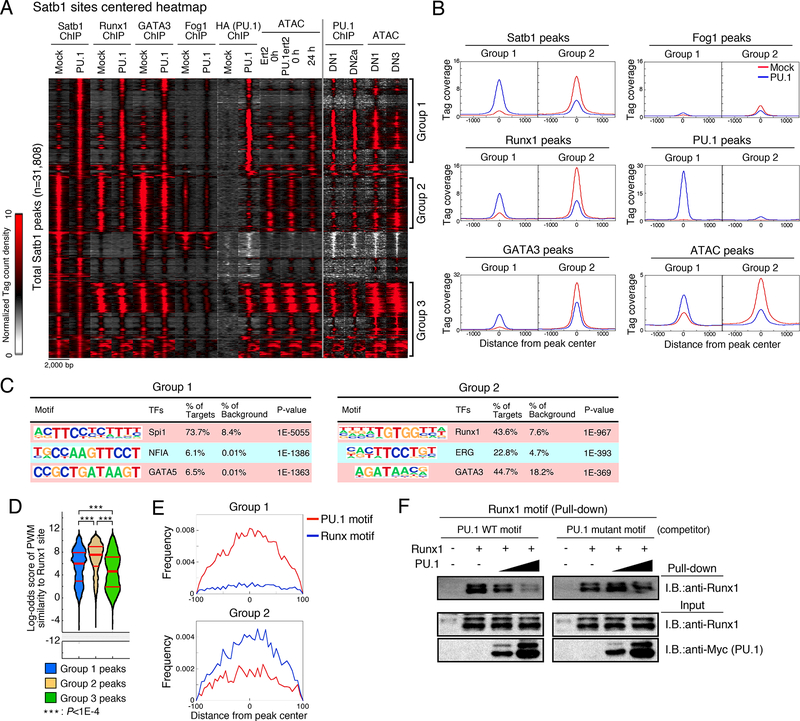
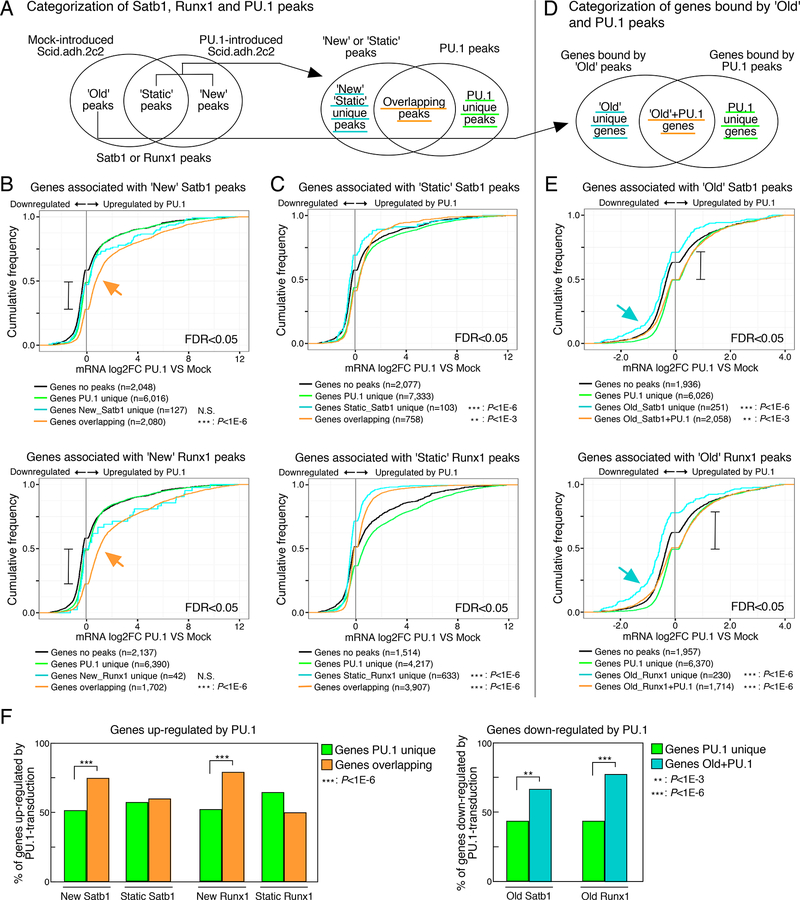
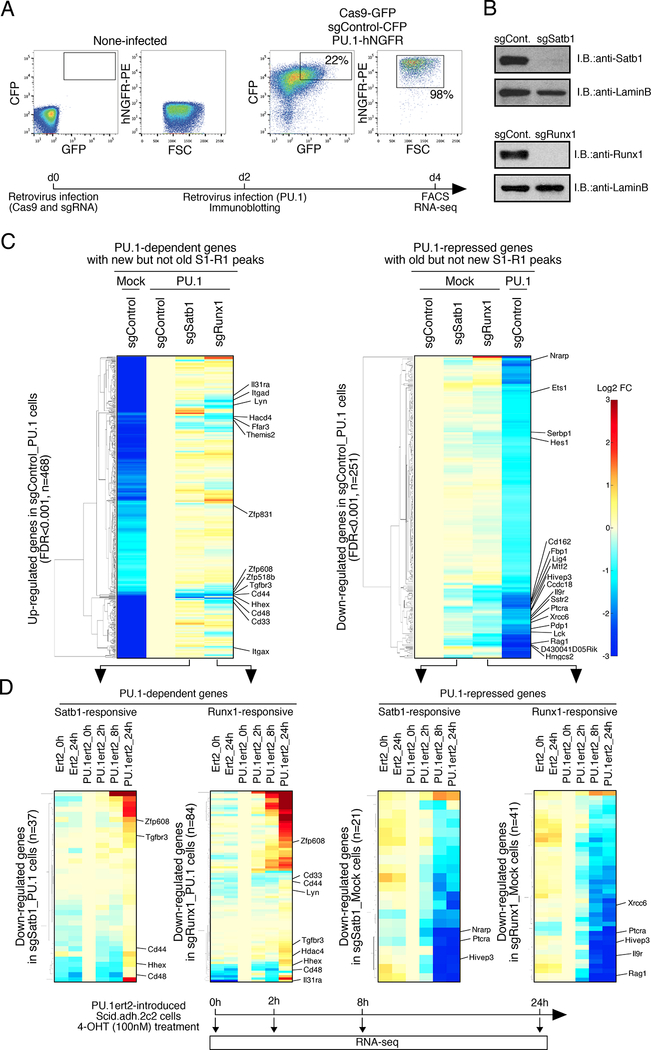
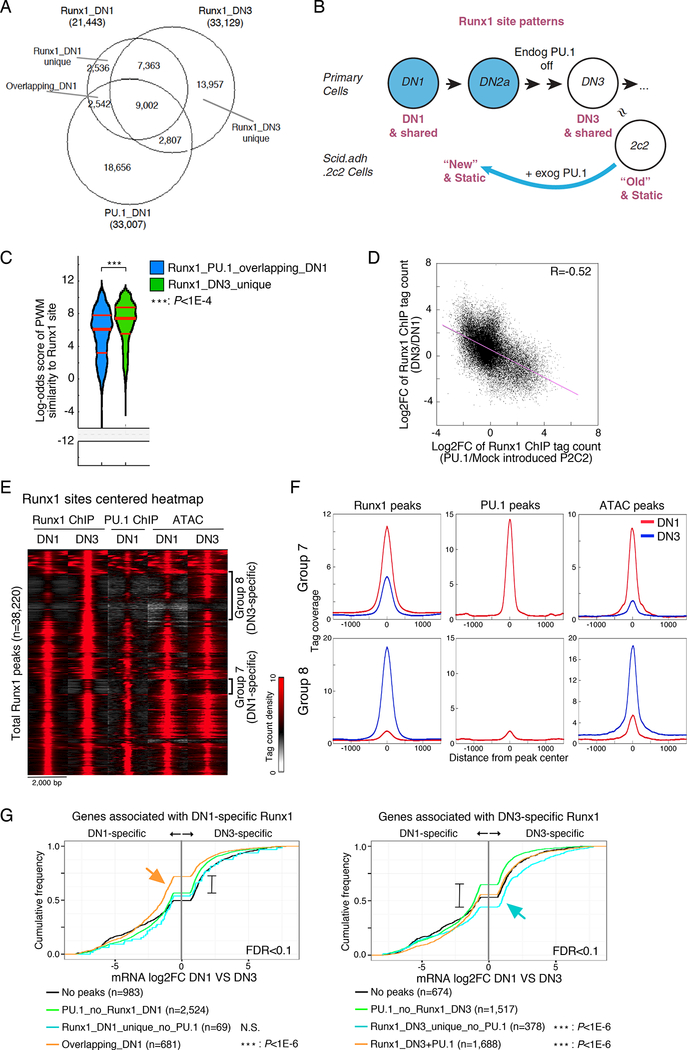
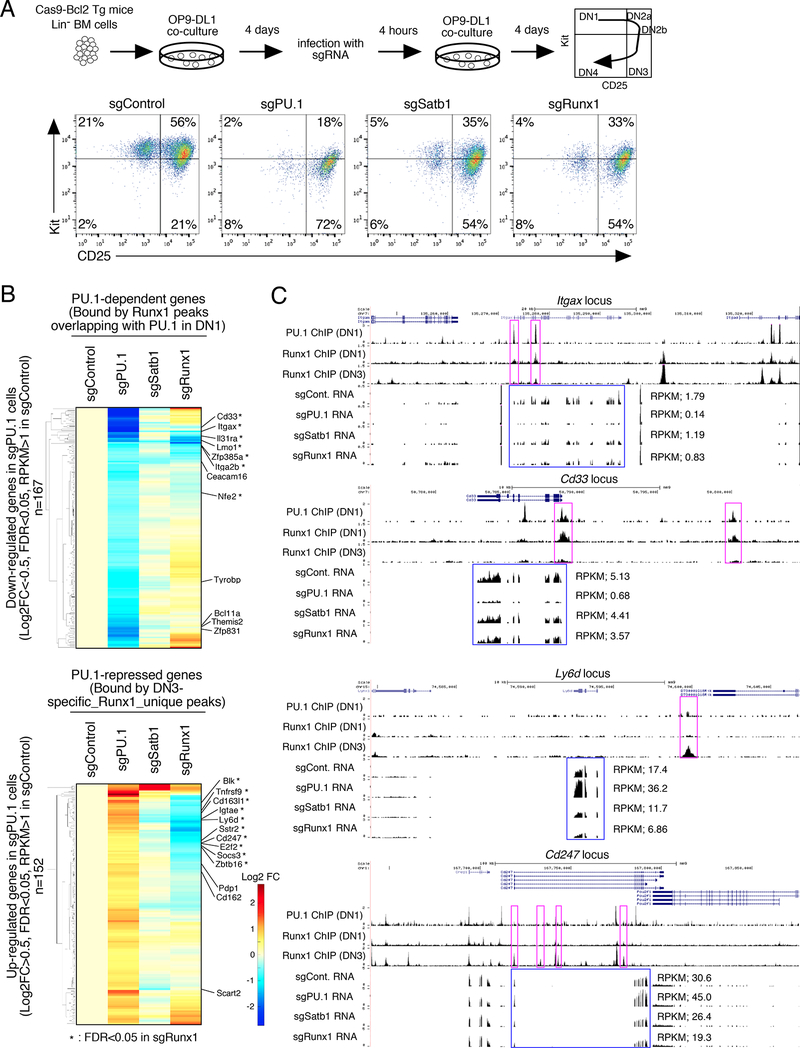
Transcription factors normally regulate gene expression through their action at sites where they bind to DNA. However, the balance of activating and repressive functions that a transcription factor can mediate is not completely understood. Here, we showed that the transcription factor PU.1 regulated gene expression in early T cell development both by recruiting partner transcription factors to its own binding sites and by depleting them from the binding sites that they preferred when PU.1 was absent. The removal of partner factors Satb1 and Runx1 occurred primarily from sites where PU.1 itself did not bind. Genes linked to sites of partner factor "theft" were enriched for genes that PU.1 represses despite lack of binding, both in a model cell line system and in normal T cell development. Thus, system-level competitive recruitment dynamics permit PU.1 to affect gene expression both through its own target sites and through action at a distance.

Keywords: DNA accessibility; Runx1; Satb1; Spi1; repression.


Figures

Figure 1
Figure 1. Satb1 and Runx1 are PU.1 interacting molecules in early T cells
(A), Total extracts from Myc-Flag-PU.1-expressing Scid.adh.2c2 cells were subjected to two- step affinity purification followed by SDS-PAGE and silver staining. Mass spectrometry identified several specific polypeptides for both Satb1 and Runx1. (B), Top five gene ontology (GO) terms for PU.1 interacting molecules. (C), Total extracts from Scid.adh.2c2 cells transduced with Myc-Flag-PU.1 WT or ETS were subjected to immune precipitation (IP) with anti-Flag mAb followed by immunoblotting (IB) with anti-Runx1, anti-Satb1 or anti-Myc Abs (left). IB from total nuclear lysates are also shown (right). Schematic representation of the Myc-Flag-tagged PU.1 WT and ETS constructs are shown (bottom). Two independent experiments were performed with similar results (A, C)(cf. Fig. S1, Table S1).
Figure 2
Figure 2. PU.1 introduction induces redirection of Satb1 and Runx1 ChIP peaks
(A), Satb1 and Runx1 ChIP-seq analyses of mock- or PU.1-introduced Scid.adh.2c2 cells. Venn diagrams show the number of ChIP peaks, with percentages of the peaks overlapping with PU.1 sites in parentheses. (B), Binding patterns of PU.1, Runx1 and Satb1 at the Itgax, Bcl11a, Ets1 and Rag1 loci in mock- and PU.1-introduced Scid.adh.2c2 cells. Representative of two independent experiments. (C), Scid.adh.2c2 cells were transduced with empty vector (mock), PU.1 WT or PU.1 ETS. The binding of Runx1 and Satb1 at the Etsl (intron1), Rag1 (promoter), Itgax (intron8), Bcllla (3’UTR) and Igk(3’UTR) loci were determined by ChIP assay with qPCR analysis. P-values were determined by Student t-test. Representative of three independent experiments. (D), Contour display of Runx1 tag counts (log2 counts per 107 reads) in Scid.adh.2c2 cells transduced with PU.1 or control vector. Data in A, D are based on reproducible ChIP-seq peaks in two replicate samples.
Figure 3
Figure 3. PU.1 redirects transcription factor ensembles
(A), Peak group classification: tag count distributions for Satb1, Runx1, GATA3, Fog1 and PU.1 ChIP, and ATAC signal around Satb1 peaks using mock- or PU.1-introduced Scid.adh.2c2 cells are shown. PU.1 ChIP in primary DN1 and DN2a, and ATAC signal in DN1 and DN3 are also indicated. (B), Average tag count distributions in Group 1 and Group 2. (C), Top three enriched sequence motifs in Group 1 and Group 2. (D), Distribution of motif log-odds similarity scores for Groups 1, 2, and 3 against position weight matrix (PWM) for Runx1 sites in DN1 and DN3 cells (Fig S1E). Median, 25% and 75% percentiles are also shown. P-values determined by Kruskal-Wallis statistical test. (E), PU.1 and Runx motif distributions around Group 1 and 2 peaks. Data are based on reproducible ChIP and ATAC signals in two replicate samples for (A, B, C, D, E). Scid.adh.2c2 cells were transduced with Runxl and/or Myc-Flag-PU.1 as indicated, and nuclear lysates subjected to pulldown assay using biotinylated Runx1 motif oligonucleotides with or without competitor oligonucleotides containing a canonical or mutant PU.1 motif. Precipitated proteins were eluted by SDS sample buffer and subjected to IB. Representative of two independent experiments. See also Fig. S1, S2 and Table S2.
Figure 4
Figure 4. PU.1-mediated gene regulation is correlated with the redirection of Satb1 and Runx1
(A), Categorization of Satb1, Runx1 and PU.1 peaks. (B and C), Cumulative distributions of expression changes by PU.1 introduction for four groups of genes bound by ‘New’ (B) and ‘Static’ (C) peaks depicted in (A) and differentially expressed in PU.1-introduced Scid.adh.2c2 (FDR<0.05). Number of genes in each group and p-values (K-S tests relative to ‘Genes PU.1 unique’) are shown. (D), Categorization of genes bound by ‘Old’ peaks only (‘Old unique’) and those with PU.1 peaks. (E), Cumulative distributions for four groups of genes bound by ‘Old’ peaks depicted in (D) and differentially expressed in PU.1-introduced Scid.adh.2c2 (FDR<0.05). (F), Summary, percentage of genes in each category up-regulated by PU.1-transduction (from B, C)(left), and down-regulated by PU.1 transduction (from E) (right). P-values are determined by Fisher’s exact test. Data are based on reproducible ChIP-seq peaks in two replicate samples and two replicates for RNA-seq results. See also Table S3.
Figure 5
Figure 5. Satb1 and Runx1 play roles in PU.1-mediated gene regulation in Scid.adh.2c2 cells
(A), For CRISPR-Cas9-mediated deletion of Satb1 and Runx1 in Scid.adh.2c2 cells, cells were infected with Cas9-GFP and sgRNA-CFP retroviruses. Two days after 1st infection, they had 2nd retrovirus infection for empty vector or PU.1-hNGFR. Flow cytometry analyses of transduced Scid.adh.2c2 cells shows sort gates. Experimental scheme is also indicated (lower) (B), Protein levels of Satb1 and Runx1 in sgRNA transduced Scid.adh.2c2 cells are shown. Two days after retrovirus infection, nuclear lysates of the Cas9 and sgRNA transduced cells were prepared and subjected to IB with anti-Satb1, anti-Runx1 and anti-LaminB Abs. (C), Gene expression profiles of PU.1-dependent and -repressed genes in Scid.adh.2c2 cells (see A) were determined by RNA-seq analysis. Genes differentially expressed in PU.1-introduced Scid.adh.2c2 cells (FDR<0.001) were hierarchically clustered by expression patterns. The ‘PU.1- dependent’ (up-regulated by PU.1) genes shown were also selected for binding by ‘new’ Satb1 or Runx1 peaks overlapping with PU.1 peaks, but not by ‘old’ Satb1 or Runx1 unique peaks. The ‘PU.1-repressed’ (down-regulated by PU.1) genes were also selected for binding by ‘old’ Satb1 or Runx1 unique peaks but not by any ‘new’ Satb1 or Runx1 peaks overlapping with PU.1. (D), The time course of activation or repression of Satb1- and Runx1-responsive genes in response to 4-OHT-driven mobilization of PU.1ert2 is shown. Satb1- or Runx1-responsive (sgSatb1 or sgRunx1/sgControl<0.75) genes were selected from PU.1-dependent and PU.1-repressed gene sets in (C). Hierarchical clustering analyses show expression of these genes over 24 h response to PU.1ert2 or empty ert2 control as indicated (upper). Heat map color scale is as in (C). Experimental scheme is also indicated (lower). Three independent experiments were performed with similar results for (A, B). Results in (C, D) are from two replicate RNA-seq datasets. See also Fig. S3, S4, Table S3 and S4.
Figure 6
Figure 6. Redirection of Runx1 ChIP peaks in developing pro-T cells
(A), Runx1 ChIP-seq analyses of bone marrow-derived primary DN1 and DN3 cells. Overlaps are shown among each set of Runx1 ChIP peaks and PU.1 ChIP peaks from DN1 cells., (B), Schematic view of Runx1 site patterns in primary DN cells and Scid.adh.2c2 cells with or without PU.1 introduction, relating effects of normal differentiation to the retrograde-like differentiation induced by exogenous PU.1 in Scid.adh.2c2 cells., (C), Distribution of motif log-odds similarity scores of Runx1_PU.1_overlapping_DN1 and Runx1_DN3_unique peaks in (A) against PWM for Runx1 motif. Median, 25% and 75% percentiles are also shown. P-values from Kruskal-Wallis test., (D), Scatter plot comparing redirection of the Runx1 peaks in primary DN cell development and in PU.1-transduced Scid.adh.2c2 cells. Points show log2 FC for Runx1 peak values for Mock vs PU.1-introduced Scid.adh.2c2 (x-axis) vs log2 FC in primary DN1 vs DN3 (y-axis). R, Pearson’s correlation coefficient. (E), Tag count distributions for Runx1 and PU.1 ChIP signals and ATAC signals around Runx1 peaks in DN1 and DN3 cells. (F), Association between redirection of Runx1 and chromatin accessibility in DN1 and DN3 cells. Average tag count distributions in Group 7 and Group 8 in (E) are indicated. (G), Association of DN1- and DN3-specific Runx1 peaks with DN1-specific and DN3-specific gene expression. Cumulative distributions of expression changes between DN1 and DN3 stages are shown for four groups of genes bound by DN1-specific (left) and DN3-specific (right) Runx1 peaks (from A) and differentially expressed between DN1 and DN3 (FDR<0.1). Number of genes in each group and p-values (K-S tests for comparisons with genes bound by ‘PU.1_no_Runx1’ peaks) are indicated. Data are based on reproducible ChIP-seq peaks in two replicate samples and two replicates of RNA-seq results. See also Fig. S5.
Figure 7
Figure 7. Satb1 and Runx1 roles in PU.1-mediated gene regulation in primary DN cells
(A), Flow cytometric analysis of primary pro-T cells after CRISPR-Cas9-mediated knockout of PU.1, Satb1 or Runx1. (Upper) Experimental scheme. (Lower) sgRNA transduced BM-derived precursors after 8 days of OP9-DL1 culture. Representative of three independent experiments. (B), Effects of Satb1 and Runx1 disruption on PU.1-mediated gene regulation in DN cells, by RNA-seq of transduced CD25+ DN cells from (A). Hierarchical clustering of expression changes in response to different treatments are shown, among genes down-regulated (top) and up- regulated (bottom) in PU.1-deficient DN cells (|Log2FC|>0.5, FDR<0.05, RPKM>1 in sgControl). Based on RNA-seq from independent duplicates. (C), The binding patterns of PU.1 (DN1) and Runx1 (DN1 and DN3), and RNA-seq tracks are shown for Spi1 (PU.1), Satb1 and Runx1-deficient DN cells at the Itgax and Cd33 PU.1- dependent loci and at the Ly6d and Cd247 PU.1-repressed loci. Representative of two independent experiments. See also Fig. S6 and Table S5

Comment in

Similar articles

Cited by

References

    1. Adam RC, Yang H, Rockowitz S, Larsen SB, Nikolova M, Oristian DS, Polak L, Kadaja M, Asare A, Zheng D, et al. (2015). Pioneer factors govern super-enhancer dynamics in stem cell plasticity and lineage choice. Nature 521, 366-370. - PMC - PubMed
    1. Alvarez JD, Yasui DH, Niida H, Joh T, Loh DY, and Kohwi-Shigematsu T. (2000). The MAR-binding protein SATB1 orchestrates temporal and spatial expression of multiple genes during T-cell development. Genes Dev 14, 521-535. - PMC - PubMed
    1. Bolger AM, Lohse M, and Usadel B. (2014). Trimmomatic: a flexible trimmer for Illumina sequence data. Bioinformatics 30, 2114-2120. - PMC - PubMed
    1. Buenrostro JD, Giresi PG, Zaba LC, Chang HY, and Greenleaf WJ. (2013). Transposition of native chromatin for fast and sensitive epigenomic profiling of open chromatin, DNA-binding proteins and nucleosome position. Nat Methods 10, 1213-1218. - PMC - PubMed
    1. Cai Z, de Bruijn M, Ma X, Dortland B, Luteijn T, Downing RJ, and Dzierzak E. (2000). Haploinsufficiency of AML1 affects the temporal and spatial generation of hematopoietic stem cells in the mouse embryo. Immunity 13, 423-431. - PubMed

Publication types

MeSH terms

Substances