. 2018 Jun 19;114(12):2875-2886.
doi: 10.1016/j.bpj.2018.05.018.

Ionomycin-Induced Changes in Membrane Potential Alter Electroporation Outcomes in HL-60 Cells

Affiliations

Ionomycin-Induced Changes in Membrane Potential Alter Electroporation Outcomes in HL-60 Cells

Erik J Aiken et al. Biophys J. .

Abstract

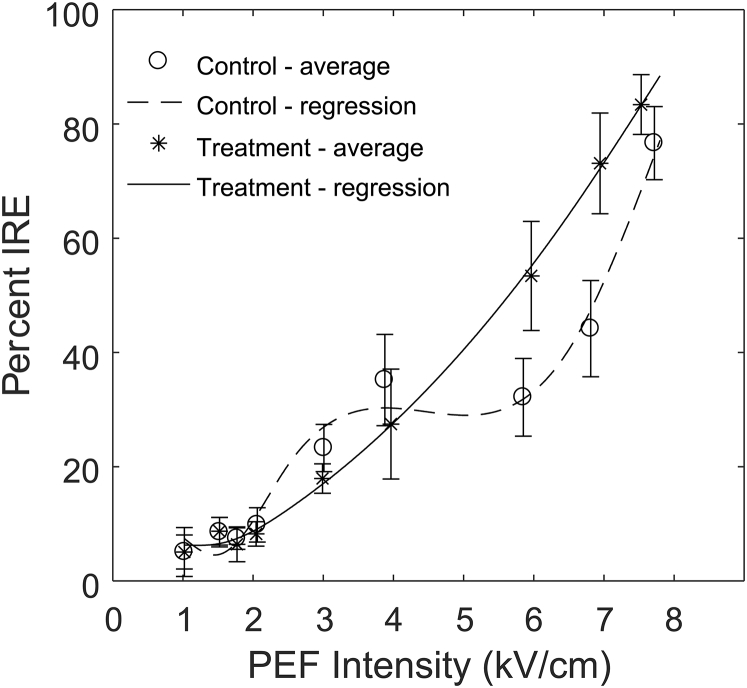
Previous studies have shown greater fluorophore uptake during electroporation on the anode-facing side of the cell than on the cathode-facing side. Based on these observations, we hypothesized that hyperpolarizing a cell before electroporation would decrease the requisite pulsed electric field intensity for electroporation outcomes, thereby yielding a higher probability of reversible electroporation at lower electric field strengths and a higher probability of irreversible electroporation (IRE) at higher electric field strengths. In this study, we tested this hypothesis by hyperpolarizing HL-60 cells using ionomycin before electroporation. These cells were then electroporated in a solution containing propidium iodide, a membrane integrity indicator. After 20 min, we added trypan blue to identify IRE cells. Our results showed that hyperpolarizing cells before electroporation alters the pulsed electric field intensity thresholds for reversible electroporation and IRE, allowing for greater control and selectivity of electroporation outcomes.


Figures

Figure 1
Figure 1
A representative bright-field and fluorescence image illustrating the analysis method used in this study. PI fluorescence intensity inside each cell was determined by comparing an area inside of the cell to three nearby points external to the cell (marked with x). Cells internalizing both TB and PI were considered IRE (cells 1–5), cells internalizing only PI were considered RE (6, 8, 11, 14, 15, 16, 17, 18, 19, 20, 22, 25), and cells excluding both membrane integrity indicators were considered NEP (cells 7, 9, 10, 12, 13, 21, 23, 24, 26–28). (a) is the bright-field image and (b) is the fluorescence image. The scale bar represents 20 μm.
Figure 2
Figure 2
Percentage of sample determined to be electroporated (EP) with a 40-μs pulse duration. The control group was EP in HBSS, and the treatment group was EP in HBSS supplemented with 100 nM ionomycin. The average values of each sampled PEF intensity are depicted by “o” for control and “” for treatment. The error bars represent a 95% confidence interval. PEF intensities of 1.8 and 2.0 kV/cm resulted in significant differences in the percent of EP cells. Regression lines represent the fitted cubic splines.
Figure 3
Figure 3
Percentage of sample determined to be RE with a 40-μs pulse duration. The control group was EP in HBSS, and the treatment group was EP in HBSS supplemented with 100 nM ionomycin. The average values of each sampled PEF intensity are depicted by “o” for control and “” for treatment. The error bars represent a 95% confidence interval. PEF intensities of 1.8 and 2.0 kV/cm resulted in significant increase in the percent of RE cells in the treatment samples, whereas at 6.0 and 6.9 kV/cm, we found a statistically significant reduction in RE in the treatment samples. Regression lines represent the fitted cubic splines.
Figure 4
Figure 4
Percentage of sample determined to be IRE with a 40-μs pulse duration. The control group was EP in HBSS, and the treatment group was EP in HBSS supplemented with 100 nM ionomycin. The average values of each sampled PEF intensity are depicted by “o” for control and “” for treatment. The error bars represent a 95% confidence interval. PEF intensities of 6.0 and 6.9 kV/cm resulted in a statistically significant increase in IRE in the treatment samples. Regression lines represent the fitted cubic splines.
Figure 5
Figure 5
Percentage of sample determined to be EP with a 100-μs pulse duration. The control group was EP in HBSS, and the treatment group was EP in HBSS supplemented with 100 nM ionomycin. The average values of each sampled PEF intensity are depicted by “o” for control and “” for treatment. The error bars represent a 95% confidence interval. No PEF intensities resulted in a significant difference in the percent of electroporated cells. Regression lines represent the fitted cubic splines.
Figure 6
Figure 6
Percentage of sample determined to be RE with a 100-μs pulse duration. The control group was EP in HBSS and the treatment group was EP in HBSS supplemented with 100 nM ionomycin. The average values of each sampled PEF intensity are depicted by “o” for control and “” for treatment. The error bars represent a 95% confidence interval. PEF intensities of 4.0 kV/cm had a statistically significant reduction in RE in the treatment samples. Regression lines represent the fitted cubic splines.
Figure 7
Figure 7
Percentage of sample determined to be IRE with a 100-μs pulse duration. The control group was EP in HBSS, and the treatment group was EP in HBSS supplemented with 100 nM ionomycin. The average values of each sampled PEF intensity are depicted by “o” for control and “” for treatment. The error bars represent a 95% confidence interval. PEF intensities 4.0 kV/cm resulted in a statistically significant increase in IRE in the treatment samples. Regression lines represent the fitted cubic splines.
Figure 8
Figure 8
Percentage of sample determined to be EP with a 2.06 kV/cm PEF intensity. The control group was EP in HBSS, and the treatment group was EP in HBSS supplemented with 100 nM ionomycin. Only 40-μs pulses resulted in significant differences in the percentage of EP cells. Error bars represent a 95% confidence interval. Regression lines represent the fitted cubic splines.
Figure 9
Figure 9
Percentage of sample determined to be RE with a 2.06 kV/cm PEF intensity. The control group was EP in HBSS, and the treatment group was EP in HBSS supplemented with 100 nM ionomycin. Only 40-μs pulses resulted in significant differences in the percent of RE cells. Error bars represent a 95% confidence interval. Regression lines represent the fitted cubic splines.
Figure 10
Figure 10
Percentage of sample determined to be IRE with a 2.06 kV/cm PEF intensity. The control group was EP in HBSS, and the treatment group was EP in HBSS supplemented with 100 nM ionomycin. There were no statistically different percentages of IRE cells. Error bars represent a 95% confidence interval. Regression lines represent the fitted cubic splines.

Similar articles

Cited by

References

    1. Weaver J.C. Electroporation: a general phenomenon for manipulating cells and tissues. J. Cell. Biochem. 1993;51:426–435. - PubMed
    1. Abidor I.G., Arakelyan V.B., Tarasevich M.P. Electric breakdown of bilayer lipid membranes. I. The main experimental facts and their qualitative discussion. J. Electroanal. Chem. 1979;104:37–52.
    1. Kennedy S.M., Aiken E.J., Murphy W.L. Cationic peptide exposure enhances pulsed-electric-field-mediated membrane disruption. PLoS One. 2014;9:e92528. - PMC - PubMed
    1. Weaver J.C. Electroporation of cells and tissues. IEEE Trans. Plasma Sci. 2000;28:24–33.
    1. Neumann E., Sowers A.E., Jordan C.A. Plenum Press; New York: 1989. Electroporation and Electrofusion in Cell Biology.

Publication types

LinkOut - more resources