

Epigenetic machine learning: utilizing DNA methylation patterns to predict spastic cerebral palsy
- PMID: 29925314
- PMCID: PMC6011336
- DOI: 10.1186/s12859-018-2224-0
Epigenetic machine learning: utilizing DNA methylation patterns to predict spastic cerebral palsy
Abstract
Background: Spastic cerebral palsy (CP) is a leading cause of physical disability. Most people with spastic CP are born with it, but early diagnosis is challenging, and no current biomarker platform readily identifies affected individuals. The aim of this study was to evaluate epigenetic profiles as biomarkers for spastic CP. A novel analysis pipeline was employed to assess DNA methylation patterns between peripheral blood cells of adolescent subjects (14.9 ± 0.3 years old) with spastic CP and controls at single CpG site resolution.
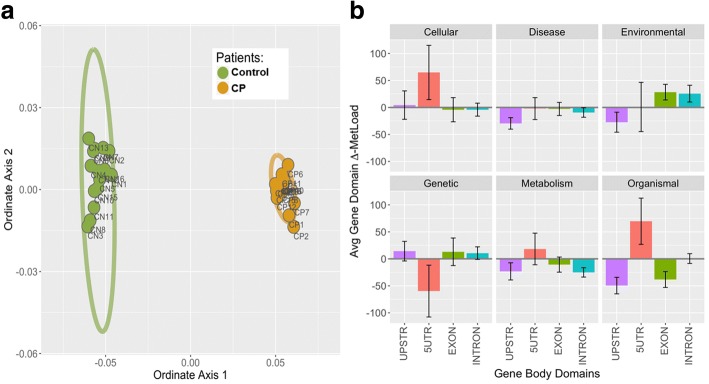
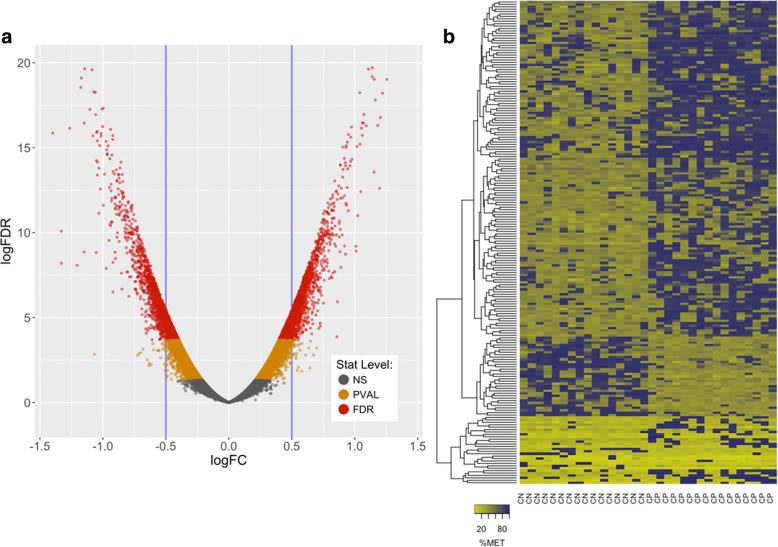
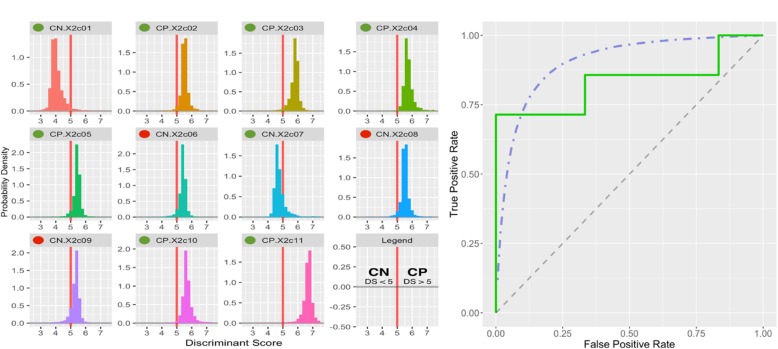
Results: Significantly hypo- and hyper-methylated CpG sites associated with spastic CP were identified. Nonmetric multidimensional scaling fully discriminated the CP group from the controls. Machine learning based classification modeling indicated a high potential for a diagnostic model, and 252 sets of 40 or fewer CpG sites achieved near-perfect accuracy within our adolescent cohorts. A pilot test on significantly younger subjects (4.0 ± 1.5 years old) identified subjects with 73% accuracy.
Conclusions: Adolescent patients with spastic CP can be distinguished from a non-CP cohort based on DNA methylation patterns in peripheral blood cells. A clinical diagnostic test utilizing a panel of CpG sites may be possible using a simulated classification model. A pilot validation test on patients that were more than 10 years younger than the main adolescent cohorts indicated that distinguishing methylation patterns are present earlier in life. This study is the first to report an epigenetic assay capable of distinguishing a CP cohort.
Keywords: Cerebral palsy; Computational statistics; DNA methylation; Epigenetic biomarkers; Genomics.
Conflict of interest statement
Ethics approval and consent to participate
Twenty-two subjects with a diagnosis of spastic CP and 21 control subjects were enrolled in this IRB-approved study at the Nemours - Alfred I. duPont Hospital for Children after written informed parental consent and subject assent. Approval for the study and the assent and consent documents was provided by Nemours Institutional Review Board 1, which has full accreditation from the Association for the Accreditation of Human Research Protection Programs and operates under the Federal Wide Assurance identification number FWA00000293.
Competing interests
The technology and software platform used to assess DNA methylation patterns were developed by Adam Marsh in his capacity as a professor of Computational Biology and Bioinformatics at the University of Delaware. The intellectual property is licensed by Genome Profiling LLC from the University. Author Adam Marsh declares a financial interest in Genome Profiling LLC.
Authors Erin Crowgey, Karyn Robinson, Stephanie Yeager, and Robert Akins have no competing interests.
Figures
Similar articles
-
Integrative Multi-Omics Research in Cerebral Palsy: Current Progress and Future Prospects.Neurochem Res. 2023 May;48(5):1269-1279. doi: 10.1007/s11064-022-03839-y. Epub 2022 Dec 13. Neurochem Res. 2023. PMID: 36512293 Review.
-
Deep Learning/Artificial Intelligence and Blood-Based DNA Epigenomic Prediction of Cerebral Palsy.Int J Mol Sci. 2019 Apr 27;20(9):2075. doi: 10.3390/ijms20092075. Int J Mol Sci. 2019. PMID: 31035542 Free PMC article.
-
DNA Methylation Analysis Reveals Distinct Patterns in Satellite Cell-Derived Myogenic Progenitor Cells of Subjects with Spastic Cerebral Palsy.J Pers Med. 2022 Nov 30;12(12):1978. doi: 10.3390/jpm12121978. J Pers Med. 2022. PMID: 36556199 Free PMC article.
-
Whole‑genome scale identification of methylation markers specific for cerebral palsy in monozygotic discordant twins.Mol Med Rep. 2017 Dec;16(6):9423-9430. doi: 10.3892/mmr.2017.7800. Epub 2017 Oct 17. Mol Med Rep. 2017. PMID: 29039597 Free PMC article.
-
Advances in cerebral palsy biomarkers.Adv Clin Chem. 2021;100:139-169. doi: 10.1016/bs.acc.2020.04.006. Epub 2020 May 23. Adv Clin Chem. 2021. PMID: 33453864 Review.
Cited by
-
Integrative Multi-Omics Research in Cerebral Palsy: Current Progress and Future Prospects.Neurochem Res. 2023 May;48(5):1269-1279. doi: 10.1007/s11064-022-03839-y. Epub 2022 Dec 13. Neurochem Res. 2023. PMID: 36512293 Review.
-
Racial differences in skeletal fragility but not osteoarthritis among women and men with cerebral palsy.Bone Rep. 2019 Jul 30;11:100219. doi: 10.1016/j.bonr.2019.100219. eCollection 2019 Dec. Bone Rep. 2019. PMID: 31417943 Free PMC article.
-
Meridian acupuncture plus massage for children with spastic cerebral palsy.Am J Transl Res. 2021 Jun 15;13(6):6415-6422. eCollection 2021. Am J Transl Res. 2021. PMID: 34306381 Free PMC article.
-
Novel Machine Learning of DNA Methylation Patterns to Diagnose Complex Disease: Identification of Cerebral Palsy with Concurrent Epilepsy.Res Sq [Preprint]. 2024 Sep 18:rs.3.rs-4560364. doi: 10.21203/rs.3.rs-4560364/v2. Res Sq. 2024. PMID: 38946953 Free PMC article. Preprint.
-
Towards AI-driven longevity research: An overview.Front Aging. 2023 Mar 1;4:1057204. doi: 10.3389/fragi.2023.1057204. eCollection 2023. Front Aging. 2023. PMID: 36936271 Free PMC article. Review.
References
-
- Christensen D, Van Naarden Braun K, Doernberg NS, Maenner MJ, Arneson CL, Durkin MS, Benedict RE, Kirby RS, Wingate MS, Fitzgerald R, et al. Prevalence of cerebral palsy, co-occurring autism spectrum disorders, and motor functioning - autism and developmental disabilities monitoring network, USA, 2008. Dev Med Child Neurol. 2014;56(1):59–65. doi: 10.1111/dmcn.12268. - DOI - PMC - PubMed
Publication types
MeSH terms
Substances
Grants and funding
LinkOut - more resources
Full Text Sources
Other Literature Sources
Medical
Miscellaneous
