. 2018 Jun 20;6(1):113.
doi: 10.1186/s40168-018-0495-3.

Genomic variation and biogeography of Antarctic haloarchaea

Affiliations

Genomic variation and biogeography of Antarctic haloarchaea

Bernhard Tschitschko et al. Microbiome. .

Abstract

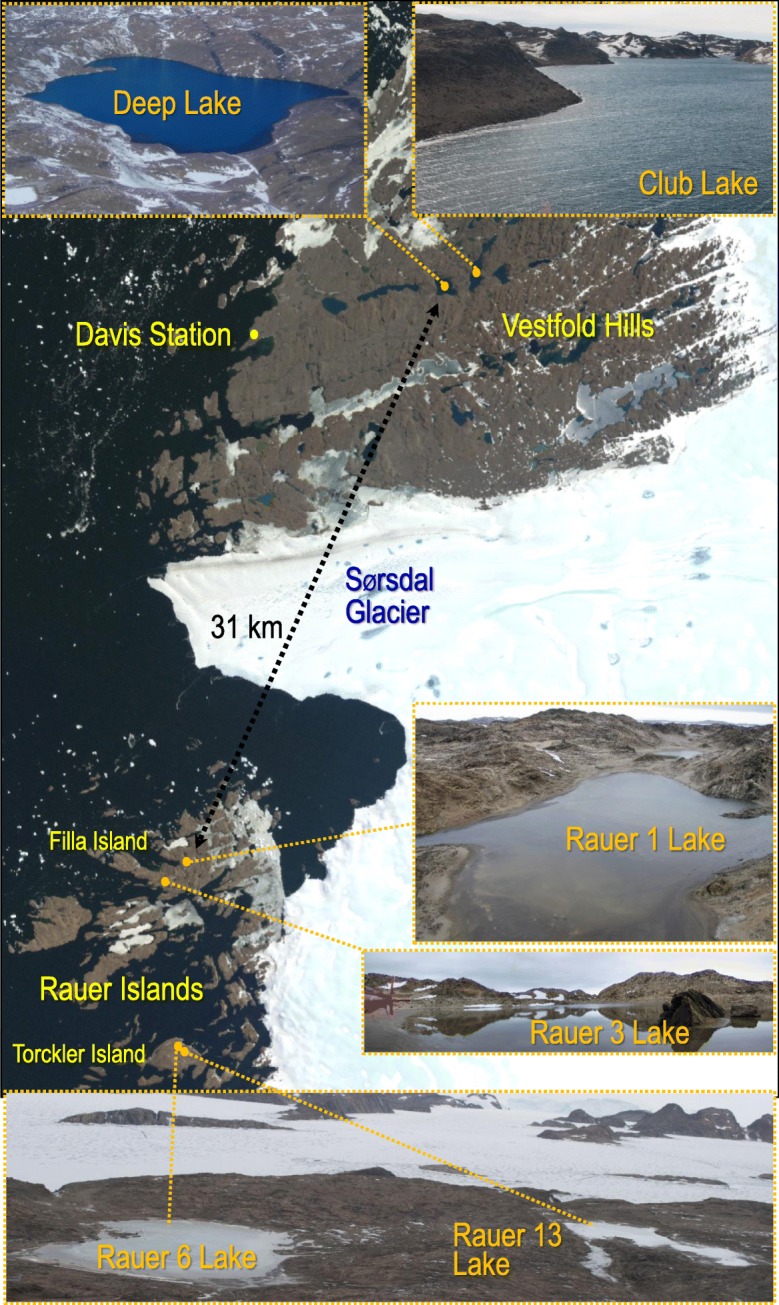
Background: The genomes of halophilic archaea (haloarchaea) often comprise multiple replicons. Genomic variation in haloarchaea has been linked to viral infection pressure and, in the case of Antarctic communities, can be caused by intergenera gene exchange. To expand understanding of genome variation and biogeography of Antarctic haloarchaea, here we assessed genomic variation between two strains of Halorubrum lacusprofundi that were isolated from Antarctic hypersaline lakes from different regions (Vestfold Hills and Rauer Islands). To assess variation in haloarchaeal populations, including the presence of genomic islands, metagenomes from six hypersaline Antarctic lakes were characterised.

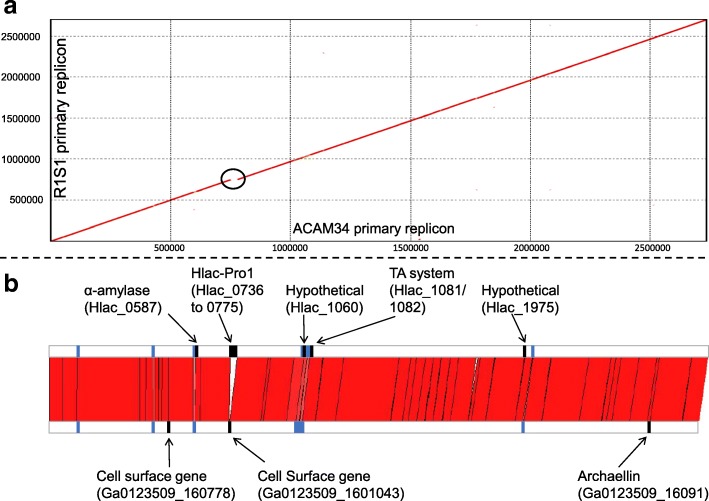
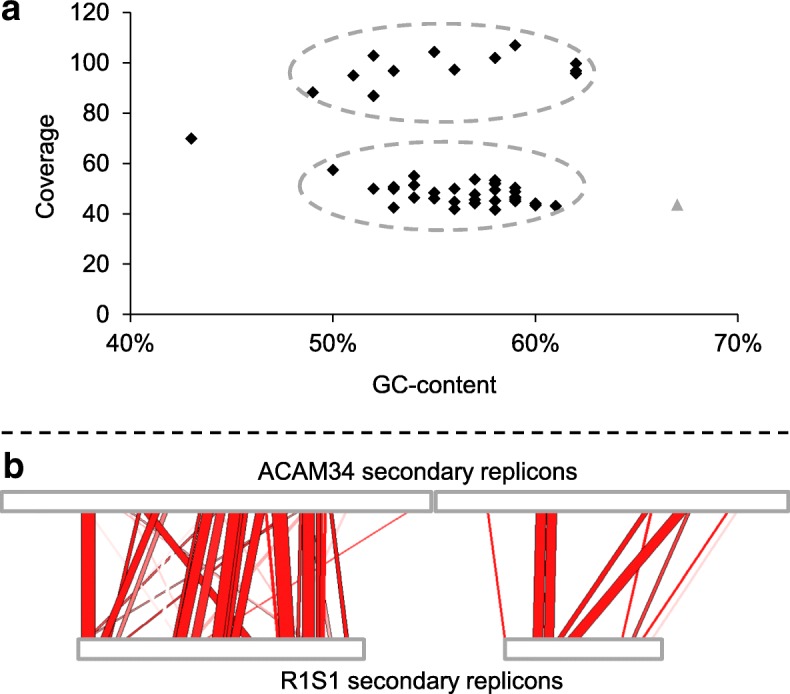
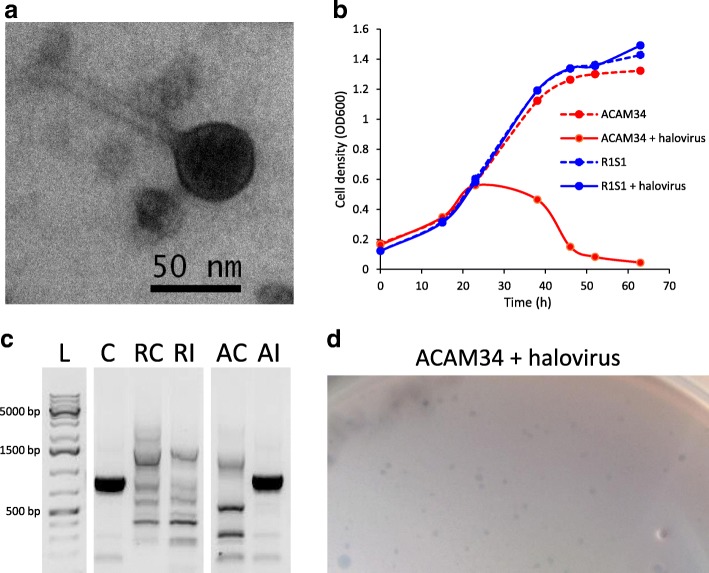
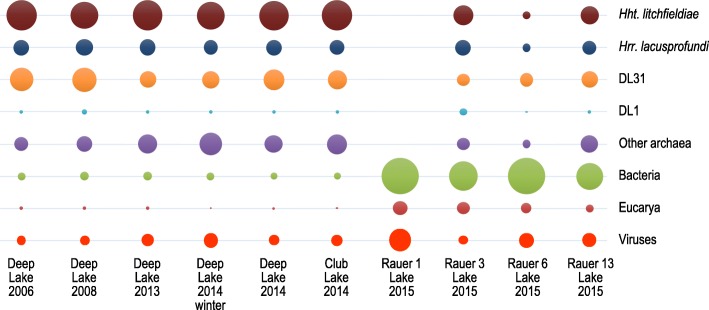
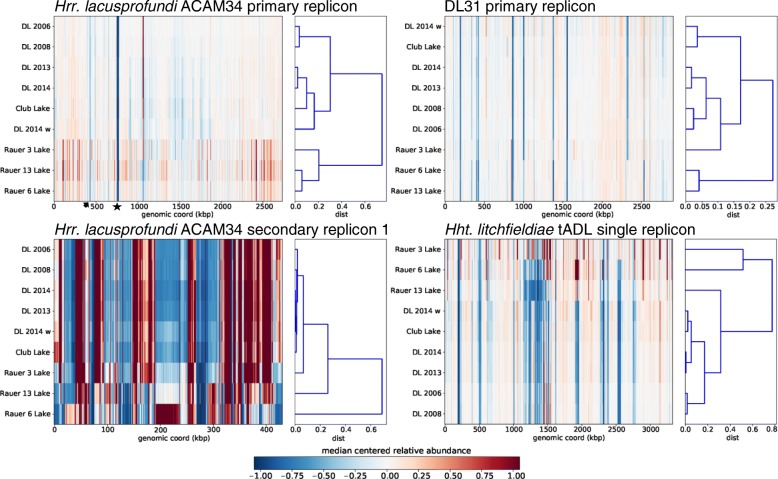
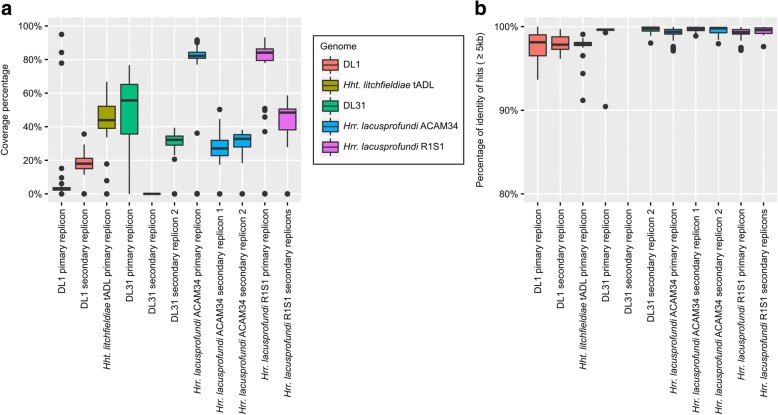
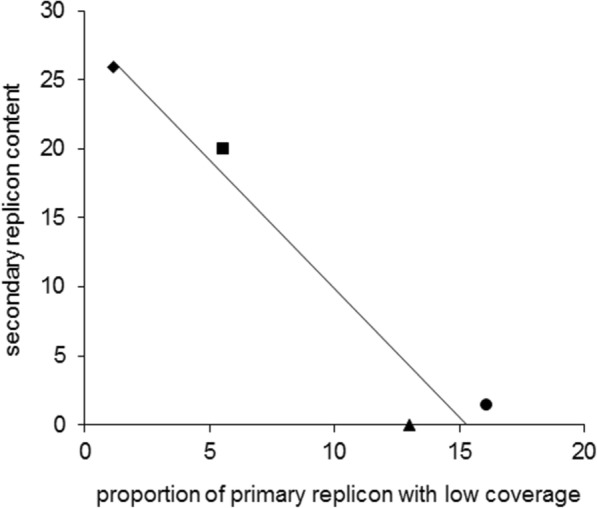
Results: The sequence of the largest replicon of each Hrr. lacusprofundi strain (primary replicon) was highly conserved, while each of the strains' two smaller replicons (secondary replicons) were highly variable. Intergenera gene exchange was identified, including the sharing of a type I-B CRISPR system. Evaluation of infectivity of an Antarctic halovirus provided experimental evidence for the differential susceptibility of the strains, bolstering inferences that strain variation is important for modulating interactions with viruses. A relationship was found between genomic structuring and the location of variation within replicons and genomic islands, demonstrating that the way in which haloarchaea accommodate genomic variability relates to replicon structuring. Metagenome read and contig mapping and clustering and scaling analyses demonstrated biogeographical patterning of variation consistent with environment and distance effects. The metagenome data also demonstrated that specific haloarchaeal species dominated the hypersaline systems indicating they are endemic to Antarctica.

Conclusion: The study describes how genomic variation manifests in Antarctic-lake haloarchaeal communities and provides the basis for future assessments of Antarctic regional and global biogeography of haloarchaea.

Keywords: Antarctica; Biogeography; Genome variation; Genomic islands; Haloarchaea; Halobacteria; Metagenomics; Pan-genome; Replicons; Virus infection.


Conflict of interest statement

Ethics approval and consent to participate

Not applicable

Consent for publication

Not applicable

Competing interests

The authors declare that they have no competing interests.

Publisher’s Note

Springer Nature remains neutral with regard to jurisdictional claims in published maps and institutional affiliations.

Figures

Fig. 1
Fig. 1
Hypersaline lakes in the Vestfold Hills and Rauer Islands sampled for metagenomics. Photo credits: Alyce Hancock (Rauer 1 Lake, Rauer 3 Lake); Sarah Payne (Rauer 6 Lake, Rauer 13 Lake, Club Lake); Rick Cavicchioli (Deep Lake); Landsat Image Mosaic of Antarctica (LIMA) project for the satellite image. Hrr. lacusprofundi ACAM34 isolated from Deep Lake [16] and R1S1 from Rauer 1 Lake [24]
Fig. 2
Fig. 2
High similarity between R1S1 and ACAM34 primary replicons. a NUCmer plot [29] of R1S1 and ACAM34 primary replicons. The black circle highlights the Hlac-Pro1 provirus that is absent in R1S1. b Synteny between R1S1 and ACAM34 primary replicons. The red area connects sequences of the ACAM34 (upper horizontal bar) and R1S1 (lower horizontal bar) primary replicon that share high nucleotide identity: identity was > 99% with the exception of five regions with < 99% identity (blue bars; see Additional file 2: Table S6). Unique genes are highlighted as annotated black bars (Additional file 2: Table S4). In order to commence the alignment at the same sequence for both replicons, 80 ‘Ns’ were added to the end of the R1S1 replicon (to represent the unsequenced nucleotides) and the first 289,989 nucleotides were relocated to the end of the replicon
Fig. 3
Fig. 3
Analysis of secondary replicons. a GC/coverage plot of R1S1 contigs representing the secondary replicons (black diamonds) and primary replicon (single grey triangle). Clusters of contigs forming putative secondary replicons of ~ 220 (coverage of 42–57) and ~ 545 kb (coverage of 87–107) are highlighted with hatched ovals. The single contig outside of the two clusters (43% GC, coverage of 70) encoded four genes annotated as DNA methyltransferase, restriction endonuclease, phage integrase, and hypothetical protein. Not included are two small contigs (1 and 1.3 kb) with high coverage (352 and 162), encoding a transposase and an ATPase, respectively. b Contig mapping of R1S1 contigs to ACAM34 secondary replicons. The red area connects sequences of the ACAM34 (upper horizontal bar) and R1S1 (lower horizontal bar) secondary replicons that share ≥ 80% nucleotide identity, with regions of higher identity shown in darker red. For R1S1, the two horizontal bars represent concatenations of contigs containing mapped sequences (R1S1 contigs not mapping to ACAM34 secondary replicons are not shown). The panel highlights the low degree of conservation between R1S1 and ACAM34 secondary replicons. Mapping was performed with CONTIGuator [31] and visualised using ACT [30]
Fig. 4
Fig. 4
Infection of ACAM34 and R1S1 with Antarctic halovirus DLHTHV. a Transmission electron micrograph of the halovirus. b Effect of halovirus infection on growth of ACAM34 and R1S1. Growth retardation was observed during infection of ACAM34 but not R1S1. c Confirmation of infection of ACAM34 using PCR specific to the halovirus. L GeneRuler 1 kb Plus DNA Ladder (Thermo Fisher Scientific), C purified halovirus DNA control, RC R1S1 uninfected, RI R1S1 infected, AC ACAM34 uninfected, AI ACAM34 infected. The halovirus-specific PCR product is visible as a thick black band (lanes C and AI). The same concentration of template DNA was used for all samples. The original gel image was modified by removing gel lanes (indicated by gaps) to improve visual presentation. d Plaque assay showing plaques formed (small zones of clearing) from infection of ACAM34 with the halovirus. No plaques were formed with infection of R1S1
Fig. 5
Fig. 5
Relative abundance of lake taxa assessed from read coverage and taxonomic assignment of contigs assembled from metagenome data. The scatter plot depicts the relative species abundances of taxa in five samples from Deep Lake, one from Club Lake, and one sample each from lakes in the Rauer Islands (Rauer 1, 3, 6 and 13). Relative abundances are directly proportional to the sizes of the circles in the plot. All samples are from summer except the sample labelled Deep Lake 2014 winter (Additional file 2: Table S1). Abundances were obtained from the coverages of the metagenome contigs assigned to species level and relative abundances shown as percentages of the total species abundance for each sample (Additional file 2: Table S12). Data are shown for Hht. litchfieldiae, Hrr. lacusprofundi, DL31 and DL1, with all other species grouped as other archaea, bacteria, eucarya or viruses
Fig. 6
Fig. 6
Genomic islands and biogeographic patterns of haloarchaea in hypersaline lakes from the Vestfold Hills and Rauer Islands. Reads from nine pooled metagenomes (Additional file 2: Table S11) were mapped onto the primary and secondary replicons of Hrr. lacusprofundi ACAM34, DL31 and Hht. litchfieldiae tADL. For a given reference sequence (replicon), the heat map shows centred and scaled by per location, median depth of coverage for each metagenome. Columns represent genomic bins on the reference, while rows represent depth of coverage for each geographic location. Hierarchical clustering of the correlation matrix was used to order rows and the resulting dendrogram is shown on the right. The heat-maps for the primary replicons highlight the differences in genomic islands present on primary replicons between the three species (also see coverage plots in Additional file 2: Figure S5). Features on genomic islands of the ACAM34 primary replicon are highlighted: provirus Hlac-Pro1 (star), S-layer gene (arrow). The heat map for the ACAM34 secondary replicon consists mainly of regions with either high or low coverage, highlighting high variability of secondary replicons within populations (also see the equivalent plots for the other secondary replicons in Additional file 2: Figure S6). The HCA reveals biogeographical clusters distinguishing the Rauer Island lakes from the Vestfold Hills lakes. All metagenomes were from summer except for Deep Lake 2014 winter (w). DL Deep Lake
Fig. 7
Fig. 7
Mapping of de novo assembled metagenome contigs to the replicons of DL1, Hht. litchfieldiae tADL, DL31, Hrr. lacusprofundi ACAM34 and Hrr. lacusprofundi R1S1. a Sequence coverage for each replicon expressed as the percentage of the replicon covered by contigs assembled de novo from metagenomes. Coverage was calculated separately for each metagenome (Additional file 2: Table S2) for each replicon, except for R1S1 secondary replicons where the coverage was calculated as the average across all secondary contigs (Additional file 2: Table S13). Mapping of metagenome contigs to replicons is shown in Additional file 2: Figure S7. b Percentage of nucleotide identity for hits ≥ 5 kb between contigs and reference replicons, averaged by metagenome. a, b Lower and upper hinges correspond to the first and third quartiles, whiskers extend no further than ± 1.5 × inter-quartile range and outliers are shown as dots
Fig. 8
Fig. 8
Relationship between genomic structuring and location of variation. Correlation between the proportion of the genome that is contained in secondary replicons and the percentage of the primary replicon that has low coverage. Hrr. lacusprofundi ACAM34 (black diamond), DL31 (black square), Hht. litchfieldiae tADL (black triangle), Hqr. walsbyi HBSQ001 (black square). For Hqr. walsbyi HBSQ001, low coverage corresponds to previously identified genomic islands [8]. The calculated correlation coefficient (R2) is 0.94

References

    1. Tettelin H, Masignani V, Cieslewicz MJ, Donati C, Medini D, Ward NL, et al. Genome analysis of multiple pathogenic isolates of Streptococcus agalactiae: implications for the microbial “pan-genome”. Proc Natl Acad Sci U S A. 2005;102:13950–13955. doi: 10.1073/pnas.0506758102. - DOI - PMC - PubMed
    1. Biller SJ, Berube PM, Lindell D, Chisholm SW. Prochlorococcus: the structure and function of collective diversity. Nat Rev Microbiol. 2015;13:13–27. doi: 10.1038/nrmicro3378. - DOI - PubMed
    1. Coleman ML, Sullivan MB, Martiny AC, Steglich C, Barry K, Delong EF, et al. Genomic islands and the ecology and evolution of Prochlorococcus. Science. 2006;311:1768–1770. doi: 10.1126/science.1122050. - DOI - PubMed
    1. Avrani S, Wurtzel O, Sharon I, Sorek R, Lindell D. Genomic island variability facilitates Prochlorococcus-virus coexistence. Nature. 2011;474:604–608. doi: 10.1038/nature10172. - DOI - PubMed
    1. DeMaere MZ, Williams TJ, Allen MA, Brown MV, Gibson JA, Rich J, et al. High level of intergenera gene exchange shapes the evolution of haloarchaea in an isolated Antarctic lake. Proc Natl Acad Sci U S A. 2013;110:16939–16944. doi: 10.1073/pnas.1307090110. - DOI - PMC - PubMed

Publication types