

Feeding state regulates pheromone-mediated avoidance behavior via the insulin signaling pathway in Caenorhabditis elegans
- PMID: 29925517
- PMCID: PMC6068425
- DOI: 10.15252/embj.201798402
Feeding state regulates pheromone-mediated avoidance behavior via the insulin signaling pathway in Caenorhabditis elegans
Abstract
Animals change sensory responses and their eventual behaviors, depending on their internal metabolic status and external food availability. However, the mechanisms underlying feeding state-dependent behavioral changes remain undefined. Previous studies have shown that Caenorhabditis elegans hermaphrodite exhibits avoidance behaviors to acute exposure of a pheromone, ascr#3 (asc-ΔC9, C9). Here, we show that the ascr#3 avoidance behavior is modulated by feeding state via the insulin signaling pathway. Starvation increases ascr#3 avoidance behavior, and loss-of-function mutations in daf-2 insulin-like receptor gene dampen this starvation-induced ascr#3 avoidance behavior. DAF-2 and its downstream signaling molecules, including the DAF-16 FOXO transcription factor, act in the ascr#3-sensing ADL neurons to regulate synaptic transmission to downstream target neurons, including the AVA command interneurons. Moreover, we found that starvation decreases the secretion of INS-18 insulin-like peptides from the intestine, which antagonizes DAF-2 function in the ADL neurons. Altogether, this study provides insights about the molecular communication between intestine and sensory neurons delivering hunger message to sensory neurons, which regulates avoidance behavior from pheromones to facilitate survival chance.
Keywords: DAF‐2 insulin receptor; avoidance behavior; feeding state; pheromone; synaptic transmission.
© 2018 The Authors.
Figures
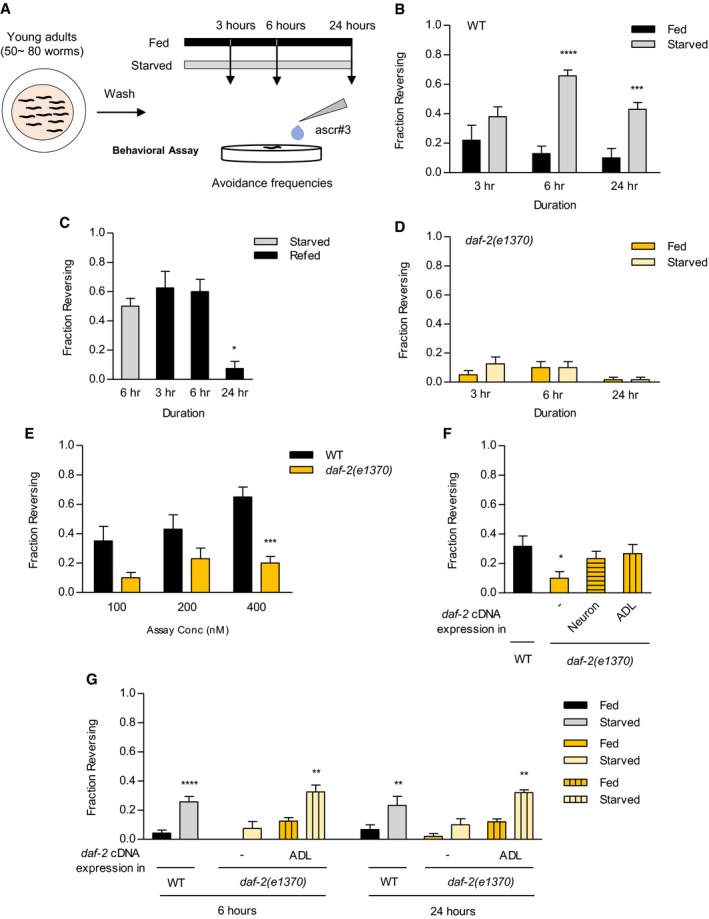
Experimental scheme of ascr#3 avoidance assay depending upon starvation. 50–100 young adult animals are washed and placed on seeded (fed: colored in black) or non‐seeded (starved: colored in gray) plates for each duration: 3, 6, and 24 h; then, various concentrations of ascr#3 are delivered to the front of a freely moving forward animal to measure avoidance frequencies responding to ascr#3.
Fraction reversing of fed and starved animals in response to ascr#3 exposure. n = 50–70. ***P < 0.001 and ****P < 0.0001 (one‐way ANOVA Bonferroni's test).
Fraction reversing of re‐fed animals from 6‐h starvation in response to ascr#3 exposure. A 24‐h re‐feeding period reverses ascr#3 avoidances to well‐fed status. n = 40–80. *P < 0.05 (one‐way ANOVA Dunnett's Test).
Fraction reversing of daf‐2 mutant animals in fed and starved status in response to ascr#3 exposure. n = 40–60.
Fraction reversing of well‐fed wild‐type animals and daf‐2 mutants in response to 100, 200, and 400 nM ascr#3. n = 60. ***P < 0.001 (Bonferroni's test).
Fraction reversing of wild‐type animals, daf‐2 mutants, and daf‐2 mutants expressing unc‐14p::daf‐2 cDNA (neurons) or sre‐1p::daf‐2 cDNA (ADL) in response to 500 nM ascr#3. daf‐2 cDNA expression in neuron and ADL restores the defect of ascr#3 avoidance in daf‐2 mutants. n = 60. *P < 0.05 (Dunnett's test).
Fraction reversing of wild‐type animals, daf‐2 mutants, and daf‐2 mutants expressing sre‐1p::daf‐2 cDNA (ADL) in fed and starved conditions in response to ascr#3. n = 40–70. **P < 0.01 and ****P < 0.0001 (Bonferroni's test).
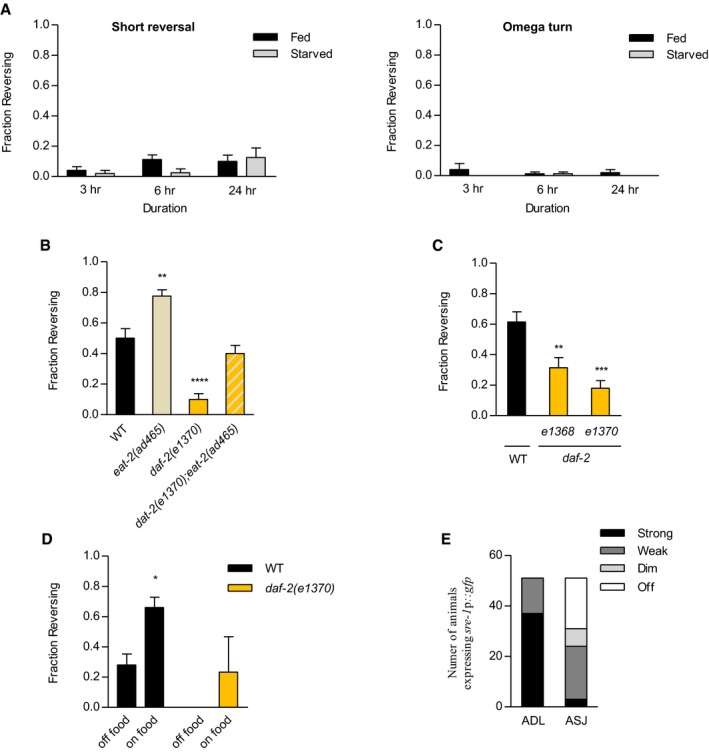
Fraction reversing of wild‐type animals exhibiting short reversal (left) and omega turn under different feeding conditions (right). n = 40–80.
Fraction reversing of wild‐type animals and eat‐2 mutants, daf‐2 mutants, and eat‐2;daf‐2 double mutants under fed conditions. n = 80–110. **P < 0.01 and ****P < 0.0001 (Dunnett's Test).
Fraction reversing of daf‐2 alleles, e1368, and e1370 in response to 500 nM ascr#3 in fed conditions. n = 50–70. **P < 0.01 and ***P < 0.001 (Dunnett's test).
Fraction reversing of wild‐type and daf‐2 mutant animals on on‐food or off‐food conditions. n = 30–50. *P < 0.05 (Bonferroni's test).
The number of transgenic animals expressing sre‐1p::gfp in ADL and ASJ. n = 31.
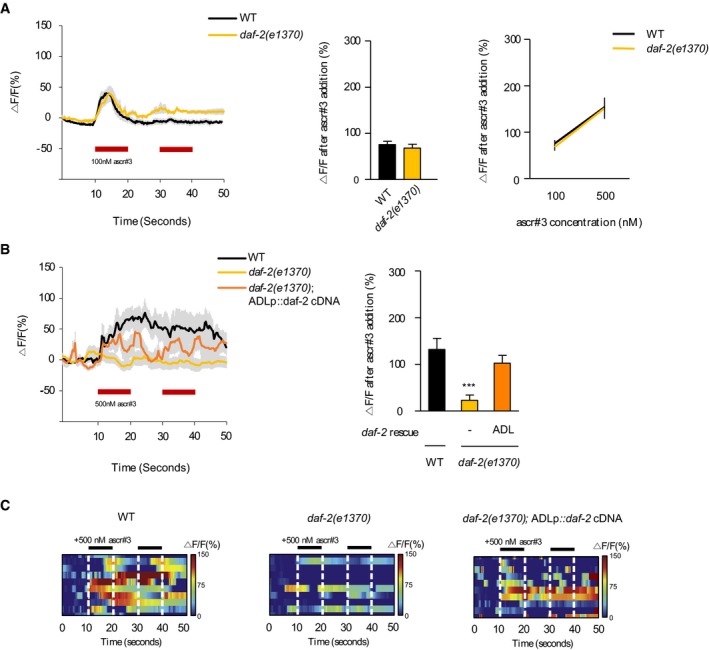
Ca2+ transients of ADL upon ascr#3 exposure in wild‐type animals and daf‐2 mutants. Ca2+ transients to 100 nM ascr#3 of ADL (left), the average peak percentage changes in fluorescence upon 100 nM ascr#3 exposure (middle), and the dose–response curve of the average peak percentage changes in fluorescence Ca2+ peaks upon 100 and 500 nM ascr#3 exposure (right). n = 7–12.
Ca2+ transients of AVA upon 500 nM ascr#3 exposure in wild‐type animals, daf‐2 mutants, and daf‐2 mutants expressing sre‐1p::daf‐2 cDNA (ADL). Ca2+ transients in response to ascr#3 in AVA (left), the average peak percentage changes in fluorescence upon 100 nM ascr#3 exposure (right). n = 10. ***P < 0.001 (Dunnett's test).
Heat‐map images of Ca2+ transients in AVA upon 500 nM ascr#3 exposure in wild‐type animals (left), daf‐2 mutants (middle), and daf‐2 mutants expressing sre‐1p::daf‐2 cDNA (right). Each row represents Ca2+ responses of individual animals to ascr#3 exposure. n = 10.
- A
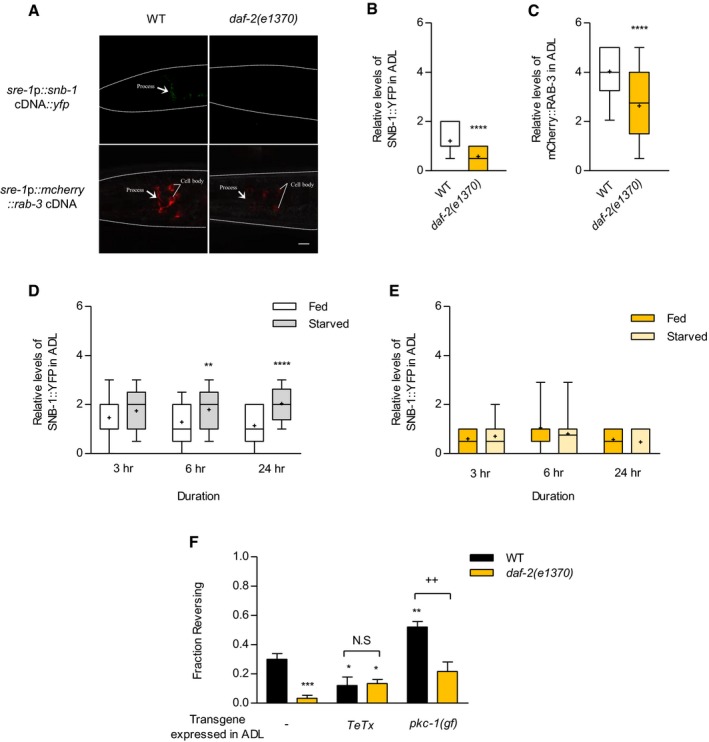
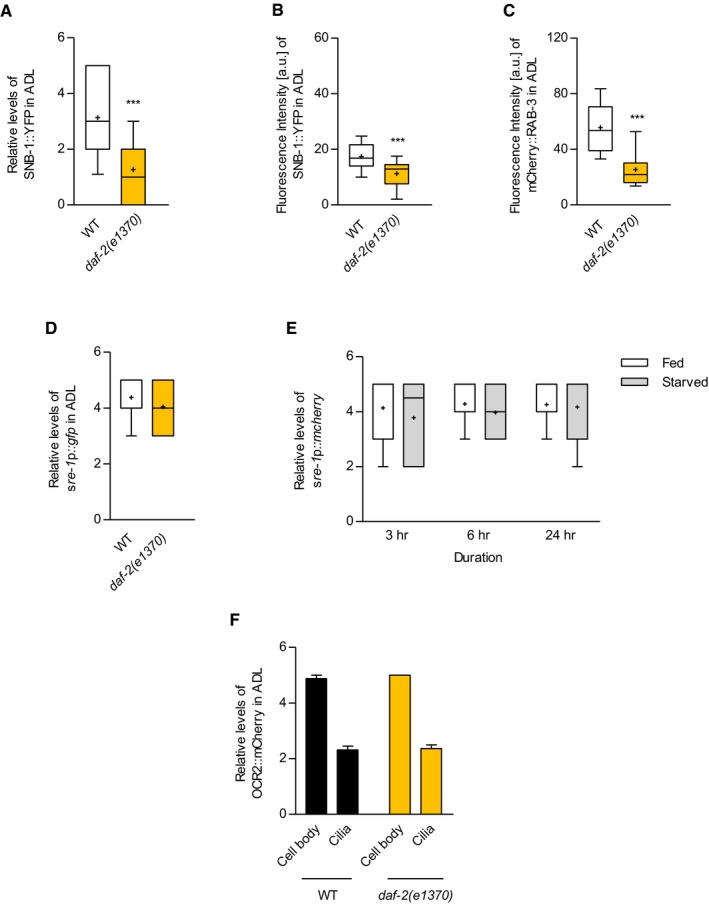
Representative images of wild‐type animals (left) and daf‐2 mutants (right) expressing sre‐1p::snb‐1 cDNA::yfp (top) and sre‐1p::mCherry::rab‐3 cDNA (bottom). The scale bar is 10 μm.
- B, C
Relative fluorescence intensity of wild‐type animals and daf‐2 mutant animals expressing sre‐1p::snb‐1 cDNA::yfp (B) and sre‐1p::mCherry::rab‐3 cDNA (C). n = 59–60. ****P < 0.0001 (unpaired Student's t‐test).
- D
Relative fluorescence intensity of sre‐1p::snb‐1 cDNA::yfp of wild‐type animals in fed and starved conditions for 3, 6, and 24 h. n = 37–80. **P < 0.01 and ****P < 0.0001 (Bonferroni's test).
- E
Relative fluorescence intensity of sre‐1p::snb‐1 cDNA::yfp of daf‐2 mutants in fed and starved conditions. n = 20–30.
- F
Fraction reversing of wild‐type animals and daf‐2 mutant animals expressing sre‐1p::TeTx and sre‐1p::pkc‐1(gf). n = 50–90. *P < 0.05, **P < 0.01, and ***P < 0.001 (Dunnett's test). ++ P < 0.01 (unpaired Student's t‐test).
- A
Relative fluorescence intensity of integrated animals expressing sre‐1p::snb‐1 cDNA::yfp. n = 30. ***P < 0.0001 (unpaired Student's t‐test).
- B, C
Quantification of fluorescence intensity of wild‐type and daf‐2 mutant animals expressing sre‐1p::snb‐1 cDNA::yfp (B) and sre‐1p::mCherry::rab‐3 cDNA (C) analyzed using ImageJ software. n = 13–41. ***P < 0.001 (unpaired Student's t‐test).
- D
Relative fluorescence intensity of daf‐2 mutants expressing sre‐1p::gfp. n = 50.
- E
Relative fluorescence intensity of transgenic animals expressing sre‐1p::mCherry in fed and starved conditions. n = 29–35.
- F
Relative fluorescence intensity of wild‐type and daf‐2 mutant animals expressing sre‐1p::ocr‐2 genome::mcherry. n = 41.
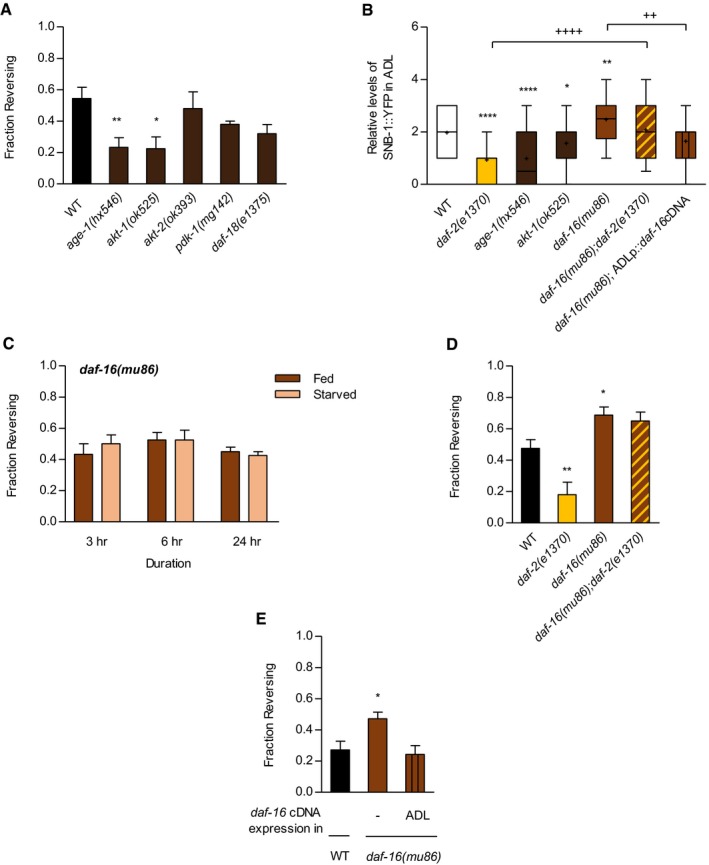
Fraction reversing of wild‐type animals, age‐1 mutants, akt‐1 mutants, akt‐2 mutants, and pdk‐1 mutants in response to 500 nM ascr#3. n = 40–90. *P < 0.05 and **P < 0.01 (Dunnett's test).
Relative fluorescence intensity of transgenic animals expressing sre‐1p::snb‐1 cDNA::yfp, including daf‐2 mutants, age‐1 mutants, akt‐1 mutants, daf‐16 mutants, daf‐16;daf‐2 double mutants, and daf‐16 mutants expressing sre‐1p::daf‐16 cDNA (ADL). n = 37–218. *, **, and **** present different from wild type at P < 0.05, P = 0.01, and P < 0.0001 (Dunnett's test). ++ P < 0.01 and ++++ P < 0.0001 (unpaired Student's t‐test). Tops and bottoms of boxes indicate the 25th and 75th percentiles, respectively; whiskers represent 10th–90th percentile. Median is indicated by a horizontal line, and the average is marked by “+” in the box.
Fraction reversing of daf‐16 mutant animals in fed and starved conditions in response to ascr#3 exposure. n = 30–40.
Fraction reversing of wild‐type animals, daf‐2 mutants, daf‐16 mutants, and daf‐16;daf‐2 double mutants in response to ascr#3. n = 50–80. *P < 0.05 and **P < 0.01 (Dunnett's test).
Fraction reversing of wild‐type animals, daf‐16 mutants, and daf‐16 mutants expressing sre‐1p::daf‐16 cDNA (ADL). n = 70. *P < 0.05 (Dunnett's test).
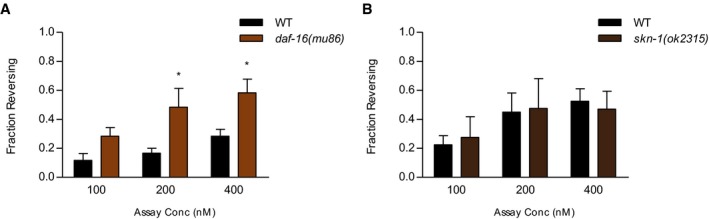
- A, B
Fraction reversing of daf‐16 mutants (A) and skn‐1 mutants (B) in response to 100, 200, and 400 nM ascr#3 under fed conditions. (A) n = 60, *P < 0.05 (Bonferroni's test). (B) n = 40–50.
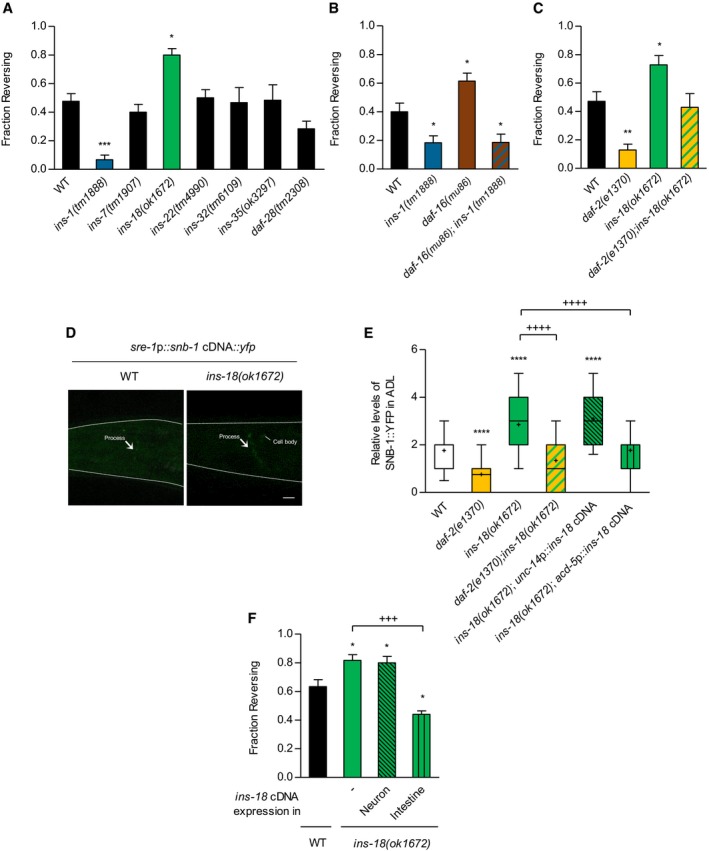
Fraction reversing of insulin‐like peptide mutants, ins‐1, ins‐7, ins‐18, ins‐22, ins‐32, ins‐35, and daf‐28 in response to ascr#3. n = 40–170. *P < 0.05 and ***P < 0.001 (Dunnett's test).
Fraction reversing of wild‐type animals, ins‐1 mutants, daf‐16 mutants, and daf‐16;ins‐1 double mutants in response to ascr#3. n = 60–70. *P < 0.05 (Dunnett's test).
Fraction reversing of wild‐type animals, daf‐2 mutants, ins‐18 mutants, and daf‐2;ins‐18 double mutants in response to ascr#3. n = 70. *P < 0.05 and **P < 0.01 (Dunnett's test).
Representative images of wild‐type animals (right) and ins‐18 mutants (left) expressing sre‐1p::snb‐1 cDNA::yfp. Scale bar is 10 μm.
Relative fluorescence intensity of sre‐1p::snb‐1 cDNA::yfp in wild‐type animals, daf‐2 mutants, ins‐18 mutants, daf‐2;ins‐18 double mutants, and ins‐18 mutants expressing unc‐14p::ins‐18 cDNA (neuron) and acd‐5p::ins‐18 cDNA (intestine). n = 35–75. ****P < 0.0001 (Dunnett's test). ++++ P < 0.0001 (unpaired Student's test). Tops and bottoms of boxes indicate the 25th and 75th percentiles, respectively; whiskers represent 10th–90th percentile. Median is indicated by a horizontal line, and the average is marked by “+” in the box.
Fraction reversing of wild‐type animals, ins‐18 mutants, and ins‐18 mutants expressing unc‐14p::ins‐18 cDNA (neuron), and ins‐18 mutants expressing acd‐5p::ins‐18 cDNA (intestine). n = 60. *P < 0.05 (Dunnett's test). +++ P < 0.001 (unpaired Student's test).
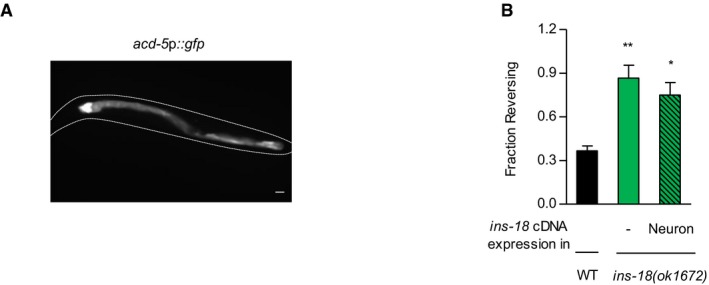
A representative image of a transgenic animal expressing acd‐5p::gfp. Scale bar is 10 μm.
Fraction reversing of wild‐type animals, ins‐18 mutants, and ins‐18 mutants expressing su006(rgef‐1)p::ins‐18 cDNA::gfp (neuron). n = 30–40. *P < 0.05 and **P < 0.01 (Dunnett's test).
- A
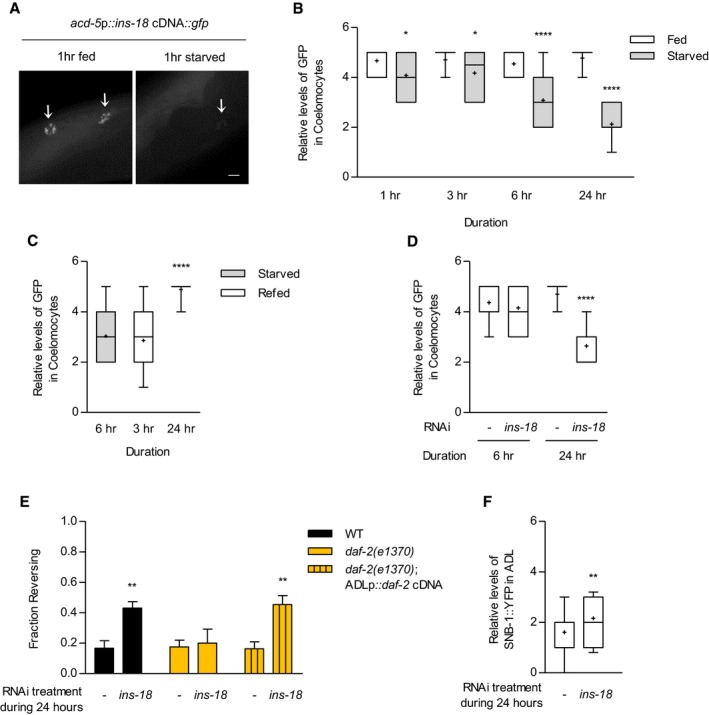
Representative images of transgenic animals expressing acd‐5p::ins‐18 cDNA::gfp at 1‐h fed and starved conditions. Arrows indicate coelomocyte. Scale bar is 10 μm.
- B, C
Relative fluorescence intensity of the accumulated GFP of transgenic animals expressing acd‐5p::ins‐18 cDNA::gfp in coelomocytes at different times after feeding, starving (B), and re‐feeding conditions (C). n = 39–50. (B) *P = 0.05 and ****P < 0.0001 (Bonferroni's test). (C) ****P < 0.0001 (Dunnett's test).
- D
Relative fluorescence intensity of the accumulated GFP of transgenic animals expressing acd‐5p::ins‐18 cDNA::gfp in coelomocytes under ins‐18 RNAi treatment. n = 36–59. ****P < 0.0001 (Bonferroni's test).
- E
Fraction reversing of wild‐type animals, daf‐2 mutants, and daf‐2 mutants expressing sre‐1p::daf‐2 cDNA treated with ins‐18 RNAi for 24 h. n = 80–100. **P < 0.01 (Bonferroni's test).
- F
Relative fluorescence intensity of wild‐type animals expressing sre‐1p::snb‐1 cDNA::yfp in 24 h‐ins‐18 RNAi condition. n = 57–58. **P < 0.01 (unpaired Student's t‐test).
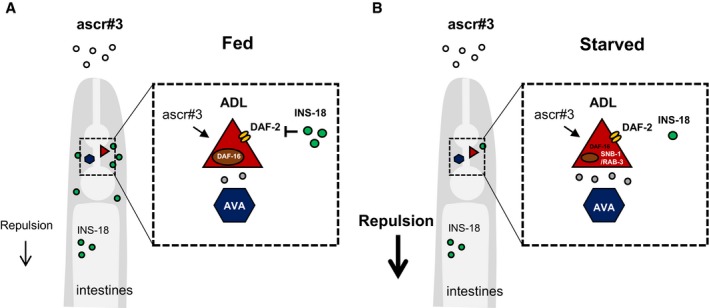
In fed conditions, INS‐18 released from the intestine blocks the activity of DAF‐2 signaling in ADL, which suppresses chemical synaptic transmission in ADL and decreases avoidance behavior to ascr#3.
In starved conditions, secretion of INS‐18 from the intestine is decreased, which activates the DAF‐2 signaling of ADL, resulting in increase in synaptic release from ADL to downstream neurons, and promotes enhanced avoidance behavior to ascr#3.
Similar articles
-
DAF-16/FOXO promotes taste avoidance learning independently of axonal insulin-like signaling.PLoS Genet. 2019 Jul 19;15(7):e1008297. doi: 10.1371/journal.pgen.1008297. eCollection 2019 Jul. PLoS Genet. 2019. PMID: 31323047 Free PMC article.
-
A conserved neuronal DAF-16/FoxO plays an important role in conveying pheromone signals to elicit repulsion behavior in Caenorhabditis elegans.Sci Rep. 2017 Aug 3;7(1):7260. doi: 10.1038/s41598-017-07313-6. Sci Rep. 2017. PMID: 28775361 Free PMC article.
-
DAF-2c signaling promotes taste avoidance after starvation in Caenorhabditis elegans by controlling distinct phospholipase C isozymes.Commun Biol. 2022 Jan 11;5(1):30. doi: 10.1038/s42003-021-02956-8. Commun Biol. 2022. PMID: 35017611 Free PMC article.
-
Ascaroside Pheromones: Chemical Biology and Pleiotropic Neuronal Functions.Int J Mol Sci. 2019 Aug 9;20(16):3898. doi: 10.3390/ijms20163898. Int J Mol Sci. 2019. PMID: 31405082 Free PMC article. Review.
-
Worming pathways to and from DAF-16/FOXO.Exp Gerontol. 2006 Oct;41(10):928-34. doi: 10.1016/j.exger.2006.05.020. Epub 2006 Jul 12. Exp Gerontol. 2006. PMID: 16839734 Review.
Cited by
-
Sex-specific, pdfr-1-dependent modulation of pheromone avoidance by food abundance enables flexibility in C. elegans foraging behavior.Curr Biol. 2021 Oct 25;31(20):4449-4461.e4. doi: 10.1016/j.cub.2021.07.069. Epub 2021 Aug 25. Curr Biol. 2021. PMID: 34437843 Free PMC article.
-
Social and sexual behaviors in C. elegans: the first fifty years.J Neurogenet. 2020 Sep-Dec;34(3-4):389-394. doi: 10.1080/01677063.2020.1838512. Epub 2020 Nov 4. J Neurogenet. 2020. PMID: 33146579 Free PMC article.
-
Pheromones Modulate Learning by Regulating the Balanced Signals of Two Insulin-like Peptides.Neuron. 2019 Dec 18;104(6):1095-1109.e5. doi: 10.1016/j.neuron.2019.09.006. Epub 2019 Oct 29. Neuron. 2019. PMID: 31676170 Free PMC article.
-
C. elegans foraging as a model for understanding the neuronal basis of decision-making.Cell Mol Life Sci. 2024 Jun 8;81(1):252. doi: 10.1007/s00018-024-05223-1. Cell Mol Life Sci. 2024. PMID: 38849591 Free PMC article. Review.
-
Neuronal control of maternal provisioning in response to social cues.Sci Adv. 2021 Aug 20;7(34):eabf8782. doi: 10.1126/sciadv.abf8782. Print 2021 Aug. Sci Adv. 2021. PMID: 34417172 Free PMC article.
References
-
- Altun‐Gultekin Z, Andachi Y, Tsalik EL, Pilgrim D, Kohara Y, Hobert O (2001) A regulatory cascade of three homeobox genes, ceh‐10, ttx‐3 and ceh‐23, controls cell fate specification of a defined interneuron class in C. elegans . Development 128: 1951–1969 - PubMed
-
- Avery L, Thomas JH (1997) Feeding and defecation In C. elegans II, Riddle DL, Blumenthal T, Meyer BJ, Priess JR. (eds), pp 679–716. Cold Spring Harbor, NY: Cold Spring Harbor Laboratory Press; - PubMed
-
- Bargmann CI, Hartwieg E, Horvitz HR (1993) Odorant‐selective genes and neurons mediate olfaction in C. elegans . Cell 74: 515–527 - PubMed
-
- Butcher RA, Fujita M, Schroeder FC, Clardy J (2007) Small‐molecule pheromones that control dauer development in Caenorhabditis elegans . Nat Chem Biol 3: 420–422 - PubMed
Publication types
MeSH terms
Substances
Grants and funding
LinkOut - more resources
Full Text Sources
Other Literature Sources
Medical
Research Materials
Miscellaneous
