

Protein kinase C signaling dysfunction in von Willebrand disease (p.V1316M) type 2B platelets
- PMID: 29925524
- PMCID: PMC6020816
- DOI: 10.1182/bloodadvances.2017014290
Protein kinase C signaling dysfunction in von Willebrand disease (p.V1316M) type 2B platelets
Abstract
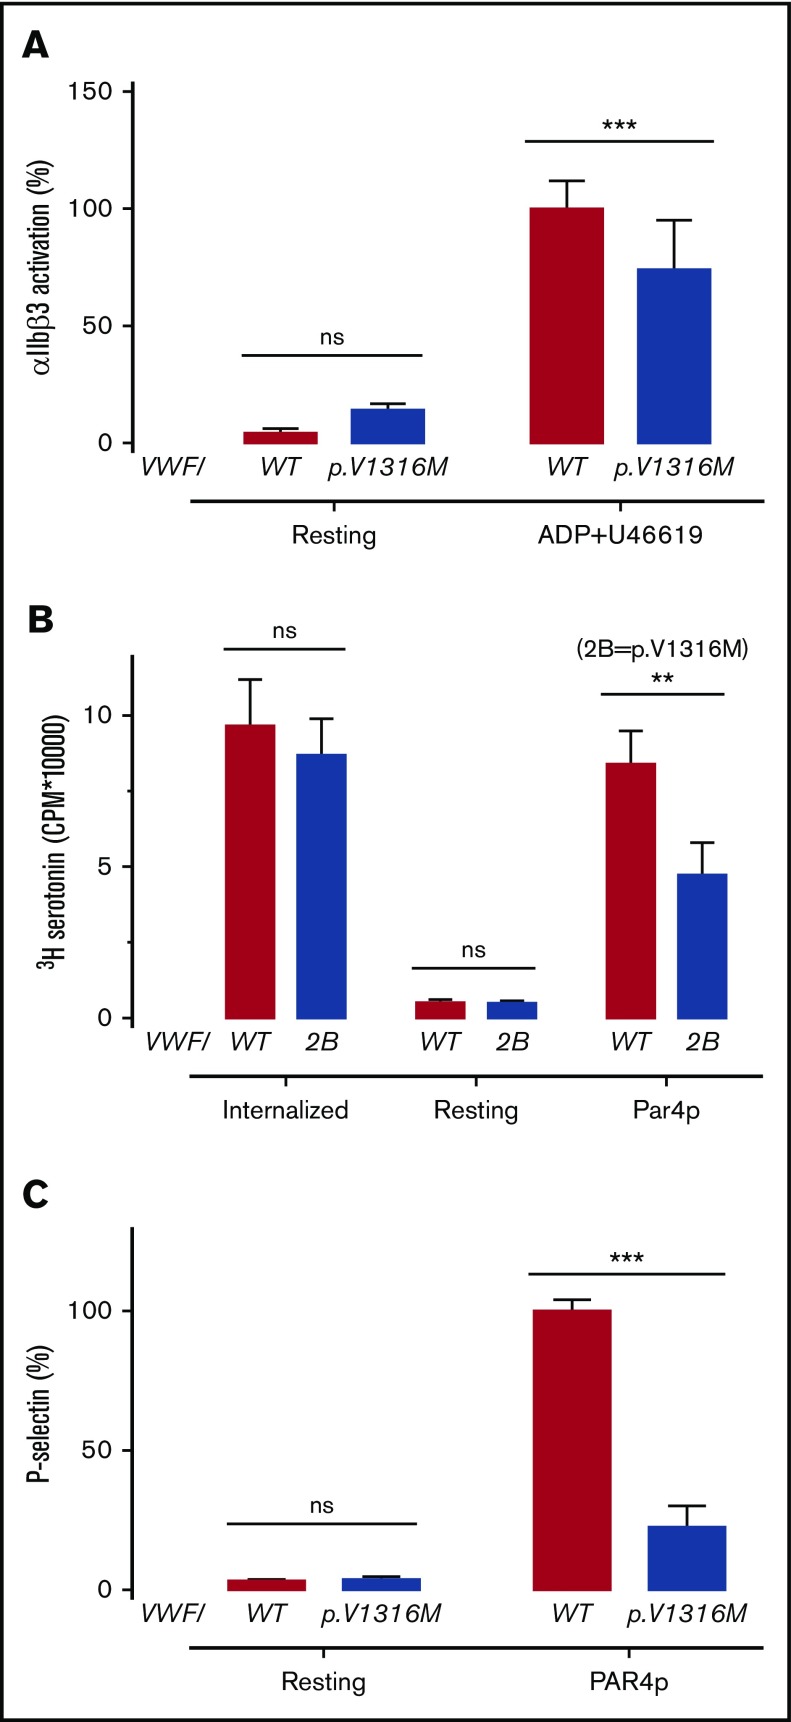
von Willebrand disease (VWD) type 2B is characterized by gain-of-function mutations in von Willebrand factor (VWF), enhancing its binding affinity for the platelet receptor glycoprotein (GP)Ibα. VWD type 2B patients display a bleeding tendency associated with loss of high-molecular-weight VWF multimers and variable thrombocytopenia. We recently demonstrated that a marked defect in agonist-induced activation of the small GTPase, Rap1, and integrin αIIbβ3 in VWD (p.V1316M) type 2B platelets also contributes to the bleeding tendency. Here, we investigated the molecular mechanisms underlying impaired platelet Rap1 signaling in this disease. Two distinct pathways contribute to Rap1 activation in platelets: rapid activation mediated by the calcium-sensing guanine nucleotide exchange factor CalDAG-GEF-I (CDGI) and sustained activation that is dependent on signaling by protein kinase C (PKC) and the adenosine 5'-diphosphate receptor P2Y12. To investigate which Rap1 signaling pathway is affected, we expressed VWF/p.V1316M by hydrodynamic gene transfer in wild-type and Caldaggef1-/- mice. Using αIIbβ3 integrin activation as a read-out, we demonstrate that platelet dysfunction in VWD (p.V1316M) type 2B affects PKC-mediated, but not CDGI-mediated, activation of Rap1. Consistently, we observed decreased PKC substrate phosphorylation and impaired granule release in stimulated VWD type 2B platelets. Interestingly, the defect in PKC signaling was caused by a significant increase in baseline PKC substrate phosphorylation in circulating VWD (p.V1316M) type 2B platelets, suggesting that the VWF-GPIbα interaction leads to preactivation and exhaustion of the PKC pathway. Consistent with PKC preactivation, VWD (p.V1316M) type 2B mice also exhibited marked shedding of platelet GPIbα. In summary, our studies identify altered PKC signaling as the underlying cause of platelet hypofunction in p.V1316M-associated VWD type 2B.
© 2018 by The American Society of Hematology.
Conflict of interest statement
Conflict-of-interest disclosure: The authors declare no competing financial interests.
Figures


Similar articles
-
von Willebrand factor mutation promotes thrombocytopathy by inhibiting integrin αIIbβ3.J Clin Invest. 2013 Dec;123(12):5071-81. doi: 10.1172/JCI69458. Epub 2013 Nov 25. J Clin Invest. 2013. PMID: 24270421 Free PMC article.
-
The impact of aberrant von Willebrand factor-GPIbα interaction on megakaryopoiesis and platelets in humanized type 2B von Willebrand disease model mouse.Haematologica. 2022 Sep 1;107(9):2133-2143. doi: 10.3324/haematol.2021.280561. Haematologica. 2022. PMID: 35142156 Free PMC article.
-
Mutation-specific hemostatic variability in mice expressing common type 2B von Willebrand disease substitutions.Blood. 2010 Jun 10;115(23):4862-9. doi: 10.1182/blood-2009-11-253120. Epub 2010 Apr 6. Blood. 2010. PMID: 20371742
-
How I treat type 2B von Willebrand disease.Blood. 2018 Mar 22;131(12):1292-1300. doi: 10.1182/blood-2017-06-742692. Epub 2018 Jan 29. Blood. 2018. PMID: 29378695 Review.
-
Type 2B von Willebrand Disease: A Matter of Plasma Plus Platelet Abnormality.Semin Thromb Hemost. 2016 Jul;42(5):478-82. doi: 10.1055/s-0036-1579638. Epub 2016 May 5. Semin Thromb Hemost. 2016. PMID: 27148840 Review.
Cited by
-
A thrombopoietin receptor agonist to rescue an unusual platelet transfusion-induced reaction in a p.V1316M-associated von Willebrand disease type 2B patient.Ther Adv Hematol. 2022 Feb 16;13:20406207221076812. doi: 10.1177/20406207221076812. eCollection 2022. Ther Adv Hematol. 2022. PMID: 35186246 Free PMC article.
-
Membrane procoagulation and N‑terminomics/TAILS profiling in Montreal platelet syndrome kindred with VWF p.V1316M mutation.Commun Med (Lond). 2023 Sep 21;3(1):125. doi: 10.1038/s43856-023-00354-1. Commun Med (Lond). 2023. PMID: 37735203 Free PMC article.
-
Platelet dysfunction in platelet-type von Willebrand disease due to the constitutive triggering of the Lyn-PECAM1 inhibitory pathway.Haematologica. 2022 Jul 1;107(7):1643-1654. doi: 10.3324/haematol.2021.278776. Haematologica. 2022. PMID: 34407603 Free PMC article.
-
Loss of P2Y1 receptor desensitization does not impact hemostasis or thrombosis despite increased platelet reactivity in vitro.J Thromb Haemost. 2023 Jul;21(7):1891-1902. doi: 10.1016/j.jtha.2023.03.013. Epub 2023 Mar 21. J Thromb Haemost. 2023. PMID: 36958516 Free PMC article.
-
Efficacy of platelet-inspired hemostatic nanoparticles on bleeding in von Willebrand disease murine models.Blood. 2023 Jun 8;141(23):2891-2900. doi: 10.1182/blood.2022018956. Blood. 2023. PMID: 36928925 Free PMC article.
References
-
- Rayes J, Hollestelle MJ, Legendre P, et al. . Mutation and ADAMTS13-dependent modulation of disease severity in a mouse model for von Willebrand disease type 2B. Blood. 2010;115(23):4870-4877. - PubMed
-
- Federici AB, Mannucci PM, Castaman G, et al. . Clinical and molecular predictors of thrombocytopenia and risk of bleeding in patients with von Willebrand disease type 2B: a cohort study of 67 patients. Blood. 2009;113(3):526-534. - PubMed
-
- Castaman G, Federici AB. Type 2B von Willebrand disease: a matter of plasma plus platelet abnormality. Semin Thromb Hemost. 2016;42(5):478-482. - PubMed
-
- Burkhart JM, Vaudel M, Gambaryan S, et al. . The first comprehensive and quantitative analysis of human platelet protein composition allows the comparative analysis of structural and functional pathways. Blood. 2012;120(15):e73-e82. - PubMed
Publication types
MeSH terms
Substances
Grants and funding
LinkOut - more resources
Full Text Sources
Other Literature Sources
Molecular Biology Databases
Miscellaneous
