MAP1B-LC1 prevents autophagosome formation by linking syntaxin 17 to microtubules
- PMID: 29925525
- PMCID: PMC6073212
- DOI: 10.15252/embr.201745584
MAP1B-LC1 prevents autophagosome formation by linking syntaxin 17 to microtubules
Abstract
In fed cells, syntaxin 17 (Stx17) is associated with microtubules at the endoplasmic reticulum-mitochondria interface and promotes mitochondrial fission by determining the localization and function of the mitochondrial fission factor Drp1. Upon starvation, Stx17 dissociates from microtubules and Drp1, and binds to Atg14L, a subunit of the phosphatidylinositol 3-kinase complex, to facilitate phosphatidylinositol 3-phosphate production and thereby autophagosome formation, but the mechanism underlying this phenomenon remains unknown. Here we identify MAP1B-LC1 (microtubule-associated protein 1B-light chain 1) as a critical regulator of Stx17 function. Depletion of MAP1B-LC1 causes Stx17-dependent autophagosome accumulation even under nutrient-rich conditions, whereas its overexpression blocks starvation-induced autophagosome formation. MAP1B-LC1 links microtubules and Stx17 in fed cells, and starvation causes the dephosphorylation of MAP1B-LC1 at Thr217, allowing Stx17 to dissociate from MAP1B-LC1 and bind to Atg14L. Our results reveal the mechanism by which Stx17 changes its binding partners in response to nutrient status.
Keywords: Atg14L; MAP1B‐LC1; autophagy; microtubules; syntaxin 17.
© 2018 The Authors.
Figures

Cell lysates prepared from each cell line (10 μg protein each) were subjected to SDS–PAGE and analyzed by IB using antibodies against MAP1B (HC and LC1), MAP1A‐LC2, MAP1S, and CNX.
HeLa cells were mock‐treated (Mock) or treated with siRNA LC1 #1 for 72 h (MAP1B KD), lysed, and analyzed by IB (10 μg protein each). Alternatively, PLA was performed using antibodies against Stx17 and α‐tubulin (upper row) or Drp1 (lower row). Scale bar, 5 μm. Error bars indicate SEM (30 cells/condition, n = 3). ***P ≤ 0.001 (paired Student's t‐test).
293T cells were transfected with FLAG vector or FLAG‐Stx17, lysed, immunoprecipitated (IP) with anti‐FLAG M2 beads, and analyzed by IB using antibodies against MAP1S, MAP1B‐LC1, and FLAG (lanes 3 and 4). Five percent of lysates was analyzed as input (lanes 1 and 2). An asterisk indicates a non‐specific band.
293T cells were transfected with FLAG‐Stx17 wild type or the K254C mutant and lysed in buffer containing 10 mM NaF and 2 mM sodium vanadate. The lysates were immunoprecipitated (IP) with anti‐FLAG M2 beads and analyzed by IB using antibodies against MAP1B‐LC1 and FLAG (lanes 4–6). One percent of lysates was analyzed as input (lanes 1–3).
HeLa cells stably expressing FLAG‐Stx17 wild type or the K254C mutant were fixed and subjected to PLA using antibodies against FLAG and MAP1B‐LC1. Scale bars, 5 μm. Error bars indicate SEM (30 cells/condition, n = 3). **P ≤ 0.01 (paired Student's t‐test).
HeLa cells stably expressing FLAG‐Stx17 wild type were transfected with a plasmid encoding Su9‐GFP (mitochondria) or Sec61β‐GFP (ER). At 24 h after transfection, the cells were subjected to PLA using antibodies against FLAG and MAP1B‐LC1. The bar graph shows the Manders’ coefficients for the colocalization between PLA dots and Su9‐GFP or Sec61β‐GFP. Error bars indicate SD (10 cells/condition, n = 3). **P ≤ 0.01 (paired Student's t‐test). Scale bar, 5 μm.
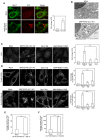
- A
HeLa cells were mock‐treated (Mock) or treated with siRNA LC1 #1 for 72 h (MAP1B KD) and double‐immunostained for Stx17 and LC3. Scale bar, 5 μm. Data in the bar graph are expressed as a fold change compared with mock‐treated cells. Error bars indicate SD (30 cells/condition, n = 3).
- B
HeLa cells were treated as described in (A) and subjected to immunoelectron microscopic analysis using an antibody against LC3. Scale bar, 1 μm.
- C, D
HeLa cells or ones transiently expressing FLAG‐DFCP1 or 3x‐FLAG‐Atg14L were mock‐treated (Mock) or treated with siRNA LC1 #1 (MAP1B KD), siRNA for Stx17 (Stx17 KD), or both (MAP1B/Stx17 DKD) for 72 h and immunostained for LC3 (C) or FLAG (D). Scale bar, 10 μm. Data in the bar graphs are expressed as a fold change compared with mock‐treated cells. Error bars indicate SD (30 cells/condition (C) and 40 cells/condition (D), n = 3). ***P ≤ 0.001 (paired Student's t‐test).
- E, F
HeLa cells were mock‐transfected or transfected with siRNA LC1 #1. At 48 h after siRNA transfection, the cells were transfected with a plasmid encoding 3x‐FLAG‐Atg14L and incubated for 24 h. The cells were subjected to PLA using antibodies against FLAG and Stx17 (E) or Vps34 (F). Error bars indicate SEM (30 cells/condition, n = 3). **P ≤ 0.01, ***P ≤ 0.001 (paired Student's t‐test).
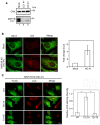
HeLa cells were mock‐transfected or transfected with siRNA LC1 #1 or HC #1. At 72 h after transfection, cell lysates (5 μg proteins each) were subjected to IB using antibodies against CNX and MAP1B‐LC1.
HeLa cells were mock‐treated (Mock) or treated with siRNA HC #1 for 72 h (MAP1B KD) and subjected to double‐immunostaining using the indicated antibodies. Scale bar, 5 μm. Data in the bar graph are expressed as a fold change compared with mock‐treated cells. Error bars indicate SD (30 cells/condition, n = 3).
HeLa cells were transfected with a plasmid encoding the FLAG‐MAP1B‐LC1 wild type, the T217A mutant, or the T217E mutant. After 24 h, the cells were transfected with siRNA HC #1, incubated for 72 h and double‐immunostained using antibodies against FLAG and LC3. Of note is that siRNA HC #1 does not target the MAP1B‐LC1 coding region. Scale bar, 10 μm. The bar graph shows the ratio of the LC3 staining intensity of FLAG‐expressing to that of non‐expressing cells. Error bars indicate SD (20 cells/condition, n = 3). ***P ≤ 0.001 (paired Student's t‐test).

- A
HeLa cells were mock‐transfected (Mock) or transfected with siRNA LC1 #1 (MAP1B KD). At 72 h after transfection, the cells were immunostained for ULK1, Vps34, and WIPI2. Scale bar, 10 μm.
- B, C
HeLa cells were mock‐transfected (Mock) or transfected with siRNA LC1 #1 (MAP1B KD). At 72 h after transfection, the cells were starved (Starved) or not starved (Fed) for 2 h, lysed, and subjected to IB using the indicated antibodies.
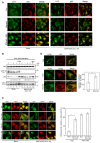
HeLa cells were mock‐treated (Mock) or treated with siRNA LC1 #1 (MAP1B KD) for 72 h and then without starvation treatment (Fed) or with starvation for 2 h in the absence (Starved) or presence (Starved + Baf) of 0.1 μM Baf. The cells were double‐immunostained using antibodies against LC3 and p62. Scale bar, 10 μm.
HeLa cells were mock‐treated (Mock) or treated with siRNA LC1 #1 (MAP1B KD) for 72 h and then starved for the indicated times in the absence or presence of 0.1 μM Baf. Cell lysates (10 μg protein each) were analyzed by IB using the indicated antibodies. Values below the p62 strip represent the mean of the p62 intensity (n = 3) normalized to that before starvation.
HeLa cells were mock‐transfected (Mock) or transfected with siRNA LC1 #1 (MAP1B KD). At 48 h after transfection, the cells were transfected with a plasmid encoding mRFP‐GFP‐LC3. At 24 h after the second transfection, the cells were not subjected to starvation treatment (Fed) or starved for 2 h (Starved) in the absence or presence of 0.1 μM Baf. Scale bar, 10 μm. The bar graph shows the quantification of the merged (both GFP and mRFP) images shown in the left upper two rows. Only, the cytoplasmic puncta were analyzed, and the nuclear staining was ignored. Error bars indicate SD (30 cells/condition, n = 3). **P ≤ 0.01 (paired Student's t‐test).
HeLa cells stably expressing FLAG‐Stx17 wild type were transfected with siRNA LC1 #1. At 72 h after transfection, the cells were without starvation treatment (Fed) or with starvation for 1 h (Starved) and double‐immunostained with the indicated antibodies. Scale bar, 10 μm. The bar graph shows the Manders’ coefficients for the colocalization between FLAG‐Stx17 and Lamp2. Error bars indicate SD (30 cells/condition, n = 3). **P ≤ 0.01 (paired Student's t‐test).

- A–C
HeLa cells (A and C) or ones stably expressing FLAG‐Stx17 (B) were fixed without treatment (Fed) or after starvation for 2 h (Starved) and subjected to PLA using antibodies against MAP1B‐LC1 alone (‐anti‐Stx17) or MAP1B‐LC1 and Stx17 (A), MAP1B‐LC1 and FLAG (B) or MAP1B‐LC1 and α‐tubulin (C). Scale bars, 5 μm. Error bars indicate SEM (30 cells/condition, n = 3). **P ≤ 0.01, ***P ≤ 0.001 (paired Student's t‐test).

- A, B
HeLa cells were transfected with one of the FLAG‐tagged MAP1B constructs. At 24 h after transfection, the cells were starved for 2 h and double‐immunostained for FLAG (Alexa Fluor® 488) and LC3 (Alexa Fluor® 594). In (A), only the image of cells expressing MAP1B‐LC1 wild type is shown. Scale bar, 5 μm. The bar graph shows the ratio of the LC3 staining intensity of FLAG‐expressing to that of non‐expressing cells. Error bars indicate SD (20 cells/condition, n = 3). **P ≤ 0.01, ***P ≤ 0.001 (paired Student's t‐test).
- C
Schematic representation of MAP1B‐LC1 (right). Immunoprecipitation data (left). 293T cells were treated as described above except for no starvation treatment, lysed, immunoprecipitated (IP) with anti‐FLAG M2 beads, and analyzed by IB using antibodies against Stx17 and FLAG. Five percent of lysates was analyzed as input.

HeLa cells were transfected with one of the FLAG‐tagged rat MAP1B constructs. At 24 h, the cells were not subjected to starvation treatment (Fed) or starved for 2 h (Starved) in the absence or presence of 0.1 μM Baf and double‐immunostained for FLAG and LC3. Scale bar, 10 μm. The bar graph shows the ratio of the LC3 staining intensity of FLAG‐expressing to that of non‐expressing cells. Error bars indicate SD (20 cells/condition, n = 3). **P ≤ 0.01, ***P ≤ 0.001 (paired Student's t‐test).
HeLa cells were co‐transfected with one of the FLAG‐tagged rat MAP1B constructs and mRFP‐GFP‐LC3. At 24 h, the cells were not subjected to starvation treatment (Fed) or starved for 2 h (Starved) in the absence or presence of 0.1 μM Baf. Images were captured by a BX53 microscope with a DP53 CCD camera. Scale bar, 10 μm. The bar graph shows the fluorescence intensity of GFP relative to that of mRFP in FLAG‐expressing cells. Because mRFP‐GFP‐LC3 was overexpressed, some fluorescence (yellow) puncta were observed even when full‐length rat MAP1B or LC1 was overexpressed. Error bars indicate SD (20 cells/condition, n = 3). **P ≤ 0.01, ***P ≤ 0.001 (paired Student's t‐test).

Lysates (10 μg protein each) from HeLa cells expressing FLAG‐MAP1B‐LC1 were mock‐treated (Mock) or treated with 3 μg/ml BIAP for 1 h (BIAP), and analyzed by IB using antibodies against CNX and FLAG.
HeLa cells without starvation (Fed), with starvation for 2 h (Starved), or with starvation for 2 h followed by refeeding for 1 h (Re‐fed) were lysed and analyzed by IB using the indicated antibodies.
HeLa cells were transfected with one of the FLAG‐tagged MAP1B‐LC1 constructs. At 24 h after transfection, cell lysates were prepared, mock‐treated (Vehicle) or treated with BIAP (BIAP) and subjected to IB using antibodies against CNX and FLAG.
The sequences of MAP1B‐LC1, MAP1A‐LC2, and MAP1S are aligned. Asterisks indicate the amino acids conserved in the three homologues. Amino acids 195–220 of MAP1B‐LC1, including the phosphorylation site (Thr217), are compared.
HeLa cells were transfected with a plasmid encoding the FLAG‐MAP1B‐LC1 wild type, the T217A mutant, or the T213A mutant, and analyzed by IB using an antibody against FLAG.
HeLa cells were mock‐treated (Mock) or treated with siRNA LC1 #1 for 72 h (MAP1B KD), or mock‐treated (Mock) or treated with 3 μg/ml BIAP for 1 h (BIAP) and analyzed by IB using antibodies against phospho‐Thr217, MAP1B‐LC1, and CNX.
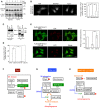
HeLa cells were starved or incubated with 1 μM Torin1 for the indicated times, and cell lysates were analyzed by IB using antibodies against phospho‐Thr217, MAP1B‐LC1, and CNX.
HeLa cells stably expressing FLAG‐Stx17 wild type were not starved (Fed), starved for 2 h (Starved), or incubated with 1 μM Torin1 for 2 h (Torin1), and PLA was performed using antibodies against FLAG and MAP1B‐LC1. Scale bar, 10 μm. Error bars indicate SEM (30 cells/condition, n = 3). *P ≤ 0.05, **P ≤ 0.01 (paired Student's t‐test).
293T cells were transfected with a plasmid encoding the FLAG‐MAP1B‐LC1 wild type or the T217A mutant, lysed, immunoprecipitated with anti‐FLAG M2 beads, and analyzed by IB using antibodies against Stx17 and FLAG. Five percent of lysates was analyzed as input.
HeLa cells were co‐transfected with plasmids encoding GFP and FLAG‐MAP1B‐LC1 wild type or the T217A mutant, and subjected to PLA using antibodies against FLAG and Stx17. PLA‐positive dots in GFP‐expressing cells were counted. Error bars indicate SEM (30 cells/condition, n = 3). ***P ≤ 0.001 (paired Student's t‐test).
HeLa cells stably expressing FLAG‐MAP1B‐LC1 wild type or the T217A mutant were starved for 2 h and double‐immunostained using antibodies against FLAG and LC3. As a control, the parent HeLa cells were used. The bar graph shows the ratio of the LC3 staining intensity of FLAG‐expressing to that of parental cells. Scale bar, 10 μm. Error bars indicate SD (40 cells/condition, n = 3). ***P ≤ 0.001 (paired Student's t‐test).
In fed cells, Stx17 binds to MTs through Thr217‐phosphorylated MAP1B‐LC1 and facilitates mitochondrial (Mt) division by preventing Drp1 from protein kinase A‐mediated phosphorylation/inactivation.
Upon starvation, Thr217 on MAP1B‐LC1 is dephosphorylated by unknown phosphatase(s), and Stx17 dissociates from MTs and Drp1 and interacts with Atg14L, leading to the recruitment of Vps34 (PI3‐kinase) to the MAM and thereby inducing PI3P formation. The Vps34 complex in cooperation with the activated ULK1 complex facilitates autophagosome formation.
In MAP1B‐LC1‐depleted cells, autophagosome formation occurs without marked dephosphorylation of ULK1. ULK1 may translocate to the ER due to the production of PI3P at the MAM and/or its interaction with Atg14L and perhaps other proteins. Phosphorylated ULK1 remains inactive but may function as a scaffold to support the assembly of the autophagy machinery on the ER.
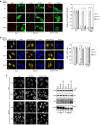
HeLa cells were transfected with one of the FLAG‐tagged MAP1B‐LC1 constructs. At 24 h, the cells were not subjected to starvation treatment (Fed) or starved for 2 h (Starved) in the absence or presence of 0.1 μM Baf and double‐immunostained for FLAG and LC3. Scale bar, 10 μm. The bar graph shows the ratio of the LC3 staining intensity of FLAG‐expressing to that of non‐expressing cells. Error bars indicate SD (20 cells/condition, n = 3). **P ≤ 0.01, ***P ≤ 0.001 (paired Student's t‐test).
HeLa cells were co‐transfected with one of the FLAG‐tagged MAP1B‐LC1 constructs and mRFP‐GFP‐LC3. At 24 h, the cells were not subjected to starvation treatment (Fed) or starved for 2 h (Starved) in the absence or presence of 0.1 μM Baf. Images were captured by a BX53 microscope with a DP53 CCD camera. Scale bar, 10 μm. The bar graph shows the fluorescence intensity of GFP relative to that of mRFP in FLAG‐expressing cells. Because mRFP‐GFP‐LC3 was overexpressed, some fluorescence (yellow) puncta were observed even when wild‐type MAP1B‐LC1 or the T217E mutant was overexpressed. Error bars indicate SD (20 cells/condition, n = 3). **P ≤ 0.01, ***P ≤ 0.001 (paired Student's t‐test).
HeLa cells stably expressing FLAG‐MAP1B‐LC1 wild type (Top and second rows) or the T217A mutant (third and bottom rows) were not subjected to starvation treatment (Fed) or starved for 2 h (Starved) in the absence or presence of 0.1 μM Baf and immunostained for LC3 (top and third rows) or p62 (second and bottom rows). Scale bar, 10 μm. Alternatively, cell lysates (10 μg protein each) were analyzed by IB using the indicated antibodies.
References
-
- Mizushima N, Yoshimori T, Ohsumi Y (2011) The role of Atg proteins in autophagosome formation. Annu Rev Cell Dev Biol 27: 107–132 - PubMed
-
- Carlsson SR, Simonsen A (2015) Membrane dynamics in autophagosome biogenesis. J Cell Sci 128: 193–205 - PubMed
-
- Ktistakis NT, Tooze SA (2016) Digesting the expanding mechanisms of autophagy. Trends Cell Biol 26: 624–635 - PubMed
Publication types
MeSH terms
Substances
LinkOut - more resources
Full Text Sources
Other Literature Sources
Molecular Biology Databases
Research Materials
Miscellaneous

