. 2018 Aug;209(4):1121-1138.
doi: 10.1534/genetics.118.301240. Epub 2018 Jun 20.

Secretory Vesicle Polar Sorting, Endosome Recycling and Cytoskeleton Organization Require the AP-1 Complex in Aspergillus nidulans

Affiliations

Secretory Vesicle Polar Sorting, Endosome Recycling and Cytoskeleton Organization Require the AP-1 Complex in Aspergillus nidulans

Olga Martzoukou et al. Genetics. 2018 Aug.

Abstract

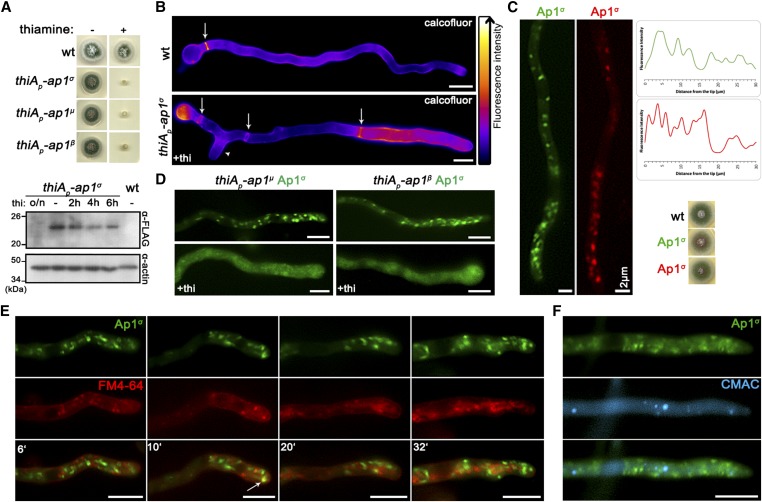
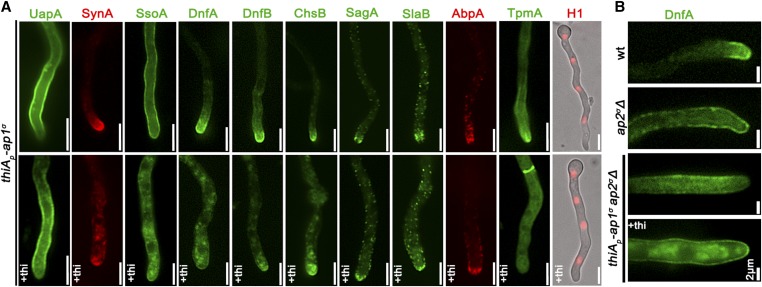
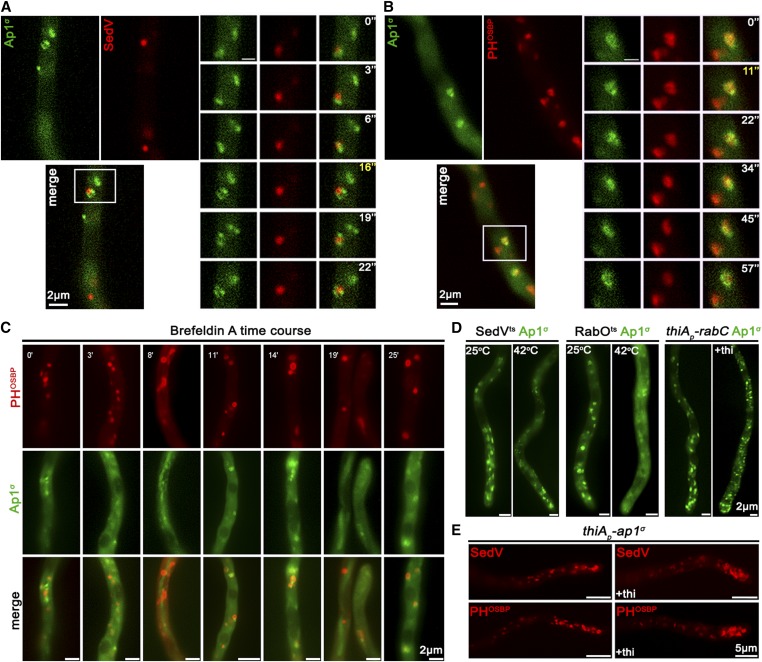
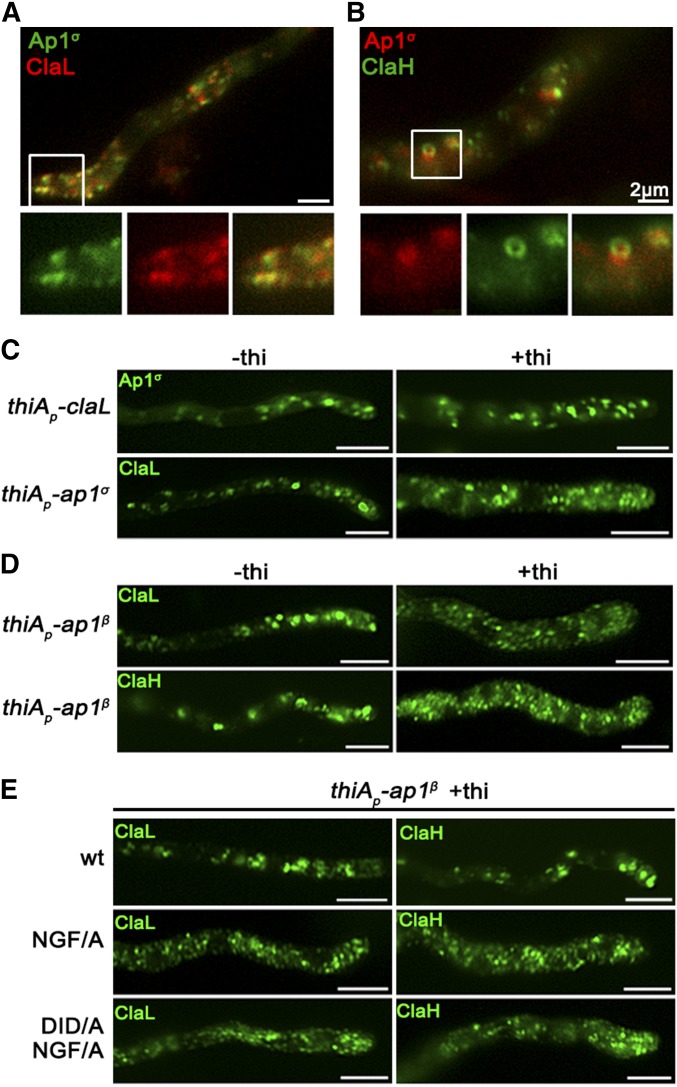
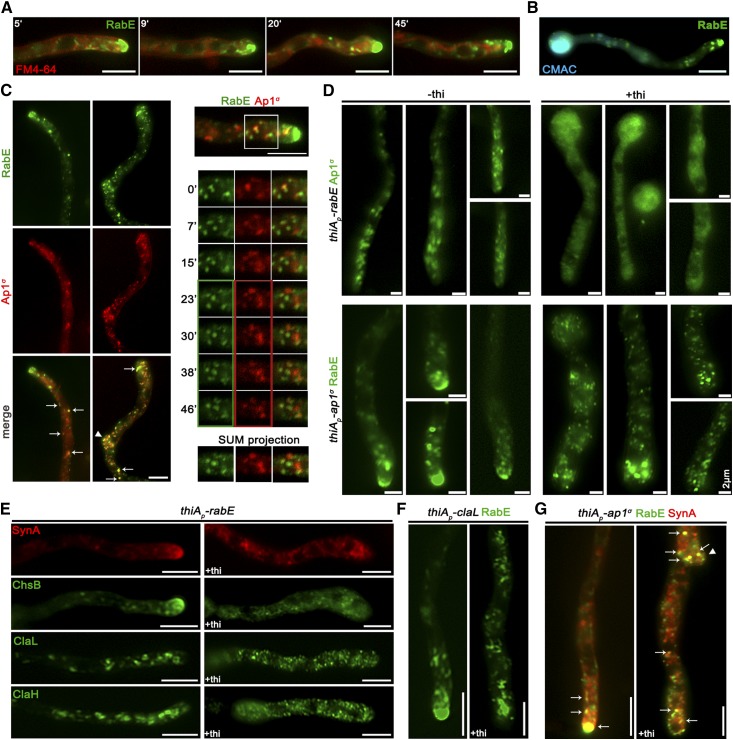
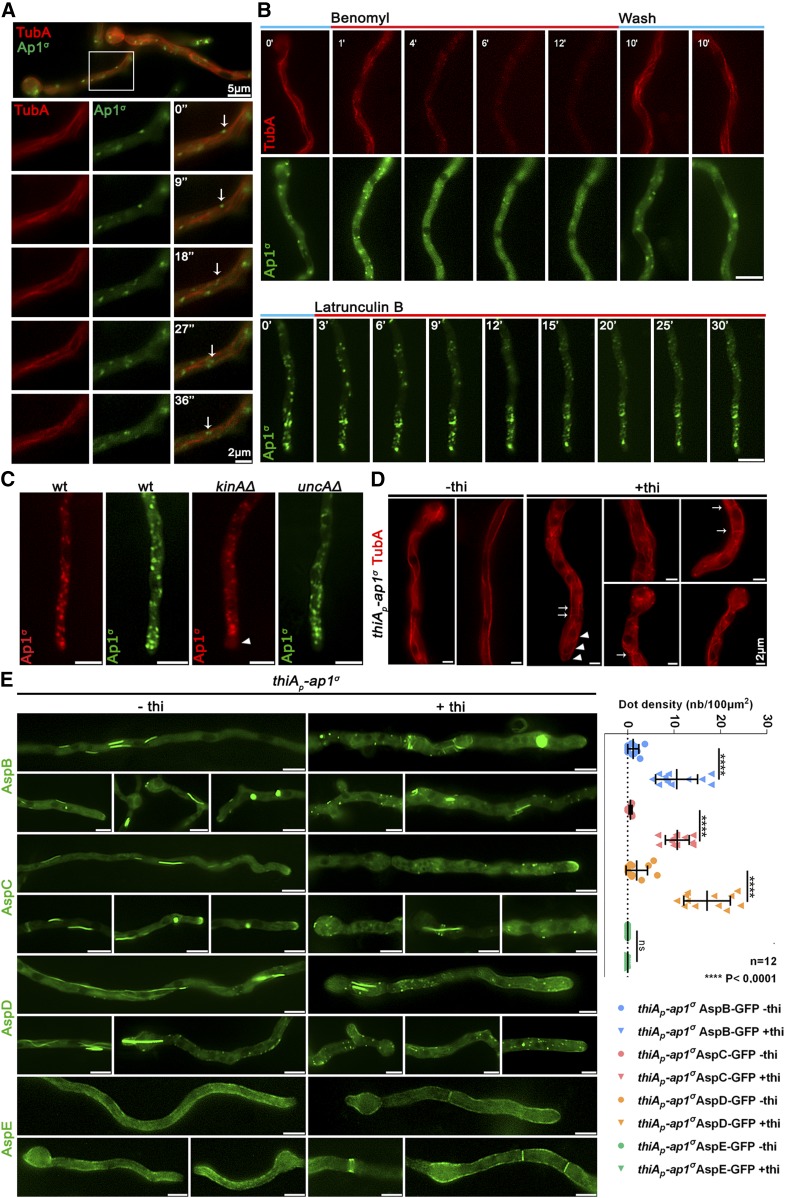
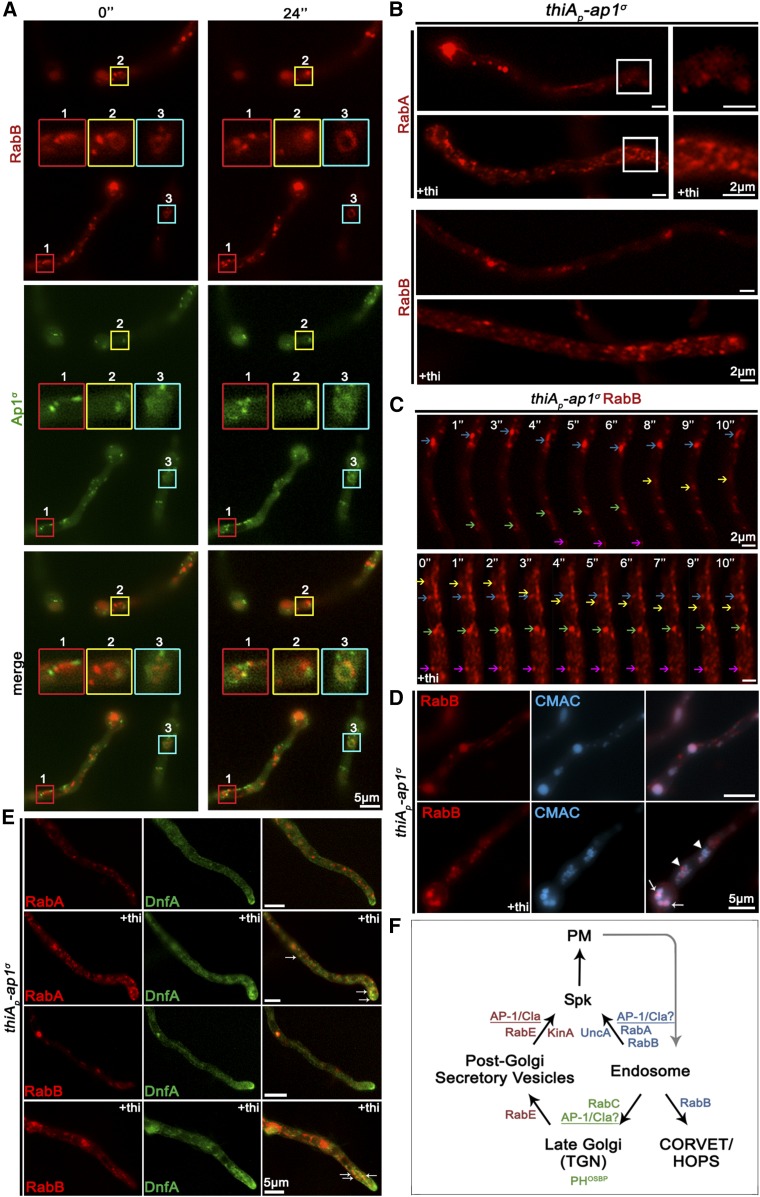
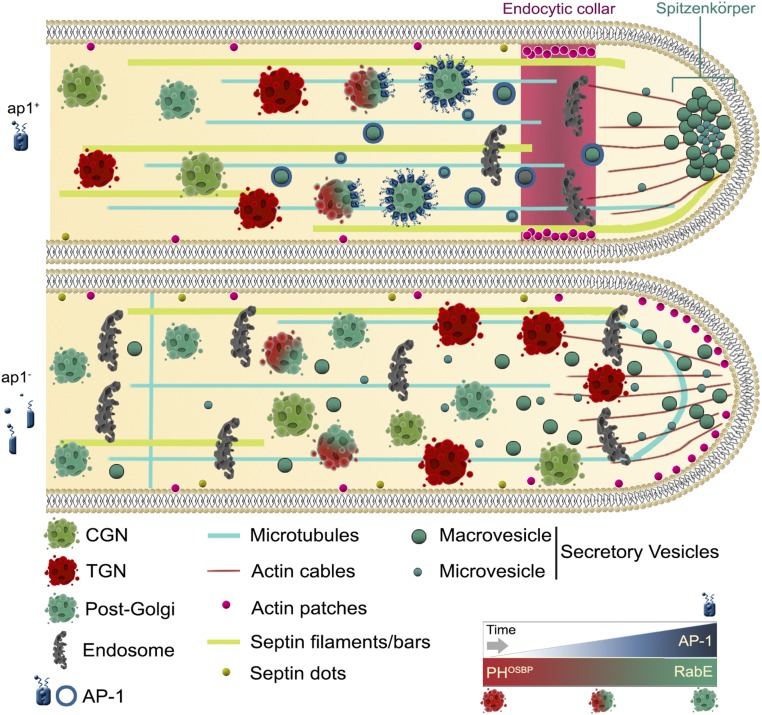
The AP-1 complex is essential for membrane protein traffic via its role in the pinching-off and sorting of secretory vesicles (SVs) from the trans-Golgi and/or endosomes. While its essentiality is undisputed in metazoa, its role in simpler eukaryotes seems less clear. Here, we dissect the role of AP-1 in the filamentous fungus Aspergillus nidulans and show that it is absolutely essential for growth due to its role in clathrin-dependent maintenance of polar traffic of specific membrane cargoes toward the apex of growing hyphae. We provide evidence that AP-1 is involved in both anterograde sorting of RabERab11-labeled SVs and RabA/BRab5-dependent endosome recycling. Additionally, AP-1 is shown to be critical for microtubule and septin organization, further rationalizing its essentiality in cells that face the challenge of cytoskeleton-dependent polarized cargo traffic. This work also opens a novel issue on how nonpolar cargoes, such as transporters, are sorted to the eukaryotic plasma membrane.

Keywords: Rab GTPases; fungi; microtubules; secretion; traffic; transport.


Figures

Figure 1
Figure 1
The AP-1 complex localizes in distinct polarly distributed structures and is essential for growth. (A) Upper panel: Growth of isogenic strains carrying thi-repressible alleles of ap1σ, ap1μ, and ap1β (thiAp-ap1σ, thiAp-ap1μ, and thiAp-ap1β) compared to wild-type (wt) in the absence (−) or presence (+) of thi. Lower panel: Western blot analysis comparing protein levels of FLAG-Ap1σ in the absence (0 hr) or presence of thi, added for 2, 4, 6, or 16 hr (overnight culture, o/n). wt is a standard wild-type strain (untagged ap1σ) which is included as a control for the specificity of the α-FLAG antibody. Equal loading is indicated by actin levels. (B) Microscopic morphology of hyphae in a strain repressed for ap1σ expression (+thi, lower panel) compared to wt (upper panel) stained with calcofluor white. Septal rings and side branches are indicated by arrows and arrowheads. Notice the differences in the calcofluor deposition at the hyphal head, tip, and the sub apical segment (Lookup table [LUT] fire [ImageJ, National Institutes of Health]). (C) Subcellular localization of Ap1σ-GFP and Ap1σ-mRFP in isogenic strains and relative quantitative analysis of fluorescence intensity (right upper panel), highlighting the polar distribution of Ap1σ. Growth tests showing that the tagged versions of Ap1σ are functional (right lower panel). (D) Subcellular localization of Ap1σ-GFP in isogenic strains carrying thi-repressible alleles of ap1μ (left panels) or ap1β (right panels) in the absence (upper panels) or presence of thi (+thi, o/n). Note that repression of expression of either the μ or the β subunit leads to diffuse cytoplasmic fluorescence of Ap1σ. (E) Subcellular localization of Ap1σ-GFP in the presence of FM4-64, which labels dynamically endocytic steps (PM, EEs, late endosomes/vacuoles). Notice that Ap1σ-GFP structures do not colocalize with FM4-64, except a few cases observed in the subapical region (indicated with an arrow at the 10 min picture). (F) Subcellular localization of Ap1σ-GFP in the presence of the vacuolar stain 7-amino-4-chloromethylcoumarin (Blue CMAC). No Ap1σ-GFP/CMAC colocalization is observed. Unless otherwise stated, Bar, 5 μm. Except (C) where the hyphal apex is at the lower side, in all other cases the hyphal apex is at the right side of the image series.
Figure 2
Figure 2
Lack of expression of AP-1 affects the topology of polar cargoes. (A) Comparison of the cellular localization of specific GFP- or mRFP/mCherry-tagged protein cargoes under conditions where ap1σ is expressed (upper panel) or fully repressed by thi (lower panel, +thi). The cargoes tested are the UapA transporter, the SNAREs SynA and SsoA, phospholipid flippases DnfA and DnfB, chitin synthase ChsB, endocytic markers SagA and SlaB, the actin-polymerization marker AbpA, tropomyosin TpmA, and histone H1 (i.e., nuclei). Notice that when ap1σ is fully repressed polar apical cargoes are depolarized and mark numerous relatively static cytoplasmic puncta. Hyphal apex is at the lower side of the image series. (B) Localization of DnfA-GFP in strains carrying the ap2σΔ null allele, or the ap2σΔ null allele together with the repressible thiAp-ap1σ allele, or an isogenic wild-type control (wt: ap2σ+ ap1σ+). Note that loss of polar distribution due to defective apical endocytosis observed in the ap2σΔ strains (Martzoukou et al. 2017) persists when AP-1σ is also repressed, indicating that, in the latter case, the majority of accumulating internal structures are due to problematic exocytosis of DnfA. Hyphal apex at the right side of the image series. Unless otherwise stated, Bar, 5 μm.
Figure 3
Figure 3
AP-1 associates transiently with the late-Golgi. (A and B) Subcellular localization of Ap1σ-GFP relative to cis- (SedV-mCherry) and trans-Golgi (PHOSBP-mRFP) markers. Notice that Ap1σ colocalizes significantly with the trans-Golgi marker PHOSBP (n = 7; PCC = 0.66, P < 0.0001), but not with the cis-Golgi marker SedV (n = 5; PCC = 0.35, P < 0.01). This colocalization is dynamic and transient, as shown in selected time-lapse images on the right panels (for relevant videos, see also File S1 and File S2). (C) Subcellular localization of Ap1σ and PHOSBP in the presence of the inhibitor Brefeldin A, showing that a fraction of Brefeldin bodies (i.e., collapsed Golgi membranes) includes both markers, further supporting a transient AP-1/late Golgi association. (D) Subcellular localization of Ap1σ in SedVts or RabOts thermosensitive mutants or a strain carrying a repressible rabC allele. These strains are used as tools for transiently blocking proper Golgi function. Notice that at the restrictive temperature (42°), Ap1σ fluorescence becomes increasingly diffuse, mostly in the RabOts mutant, whereas, under RabC-repressed conditions, small Ap1σ-labeled puncta increase in number. These results are compatible with the notion that AP-1 proper localization necessitates wild-type Golgi dynamics. (E) Distribution of early- and late-Golgi markers SedV and PHOSBP relative to ap1σ expression or repression (+thi). Notice the effect of accumulation of Golgi toward the hyphal apex under repressed conditions. Image series in (A–C) present subapical regions of hyphae, whereas in (D) the hyphal apex is at the lower image side and in (E) at the right image side.
Figure 4
Figure 4
C-terminal motifs in AP-1β are essential for wild-type clathrin localization. (A and B) Subcellular localization of Ap1σ relative to that of clathrin light (ClaL) and heavy (ClaH) chains. Notice the significant colocalization of AP-1 with both clathrin chains (claL: n = 9; PCC = 0.78, P < 0.0001) (claH: n = 5; PCC = 0.76, P < 0.0001), also highlighted by the comigration of the two markers in the relevant videos (File S3 and File S4, see also Figure S4). Hyphal apex is at the left side of (A), whereas in (B) a subapical hyphal region is presented. (C and D) Subcellular distribution of Ap1σ and clathrin light chain ClaL under conditions where claL or ap1σ are expressed/repressed, respectively (−thi/+thi). Note that repression of ClaL expression has no significant effect on Ap1σ-GFP localization, whereas repression of Ap1σ expression leads to more diffuse ClaL fluorescence with parallel appearance of increased numbers of cytoplasmic puncta. A similar picture is obtained when clathrin light and heavy chain localization are monitored under conditions of expression/repression of ap1β. These results are compatible with the idea that clathrin localization is dependent on the presence of AP-1, but not vice versa. Hyphal apex is at the right side of the image series. (E) Effect of Ap1β C-terminal mutations, modifying putative clathrin-binding motifs (709NGF/A711 and 632DID/A634), on ClaL and ClaH distribution. Notice that replacement of 709NGF711, and to a lesser extent, of 632DID634, by alanines, leads to modification of clathrin subcellular localization, practically identical to the picture observed in (D) when Ap1β expression is fully repressed. Hyphal apex is at the right side of the image series. Unless otherwise stated, Bar, 5 μm.
Figure 5
Figure 5
AP-1 associates with RabERab11-labeled SVs. (A and B) Time course of RabE-GFP localization in the presence of FM4-64 (see also Figure S6A) or CMAC, indicating the nonendocytic character for RabE-labeled structures. Hyphal apex is at the right side of the image series. (C) Left panel: subcellular localization of Ap1σ-mRFP and RabE-GFP, showing significant colocalization in several fluorescent cytoplasmic puncta (arrows) throughout the hyphae but more prominent at subapical regions and sites of branch emergence (arrowheads) (n = 5; PCC = 0.72, P < 0.0001). Notice that colocalization is apparently excluded at the level of Spk, where RabE is prominent, whereas Ap1σ is not. Hyphal apex is at the upper side of the image series. Right panel: localization of Ap1σ–mRFP and RabE-GFP in a selected area sliced in time frames. Colored boxes indicate the slices used for SUM projection. Hyphal apex is at the right side of the image series. (D) Subcellular localization of Ap1σ-GFP or RabE-GFP in strains carrying thiamine-repressible thiAp-rabE or thiAp-ap1σ alleles respectively, observed under conditions of expression (−thi) or repression (+thi). Note that, in the absence of rabE expression, Ap1σ-labeled fluorescence appears as a cytoplasmic haze rather than distinct puncta (upper panels), while in the absence of ap1σ expression, RabE fluorescence disappears from the Spk, and is associated with numerous scattered bright puncta along the hypha (lower panels − 43.24% uniform distribution, and intensity of puncta, 37.84% more than two brighter puncta close to the apex are observed, 18.9% one brighter mislocalized punctum at the apex is observed, n = 37). Hyphal apex is at the lower side of the image series. (E) Subcellular localization of SynA, ChsB, ClaL, and ClaH in strains carrying the thiamine-repressible thiAp-rabE allele, observed under conditions of expression (−thi) or repression (+thi) of rabE. Note that, in all cases, the wild-type distribution of fluorescence is severely affected, resulting in loss of polarized structures and appearance of an increased number of scattered bright foci, the latter being more evident in ClaL and ClaH. Hyphal apex is at the right side of the image series. (F) Localization of RabE-GFP in a strain carrying a thiamine-repressible thiAp-claL allele, observed under conditions of expression (−thi) or repression (+thi) of claL. Notice the disappearance of RabE from the Spk and its association with numerous scattered bright clusters along the hypha—a picture similar to that obtained in absence of ap1σ expression in (D). Hyphal apex is at the lower side of the image series. (G) Colocalization analysis of SynA and RabE in a strain carrying a thiamine-repressible thiAp-ap1σ allele (see also Figure S6B). Note that, when Ap1σ is expressed, SynA and RabE colocalize intensively at the Spk but also elsewhere along the hypha, whereas when Ap1σ expression is repressed (+thi), both fluorescent signals disappear from the Spk and appear mostly in numerous scattered and rather immotile puncta, several of which show double fluorescence. Hyphal apex is at the lower side of the image series. Unless otherwise stated, Bar, 5 μm.
Figure 6
Figure 6
AP-1 associates with the cytoskeleton and affects septin organization. (A) Relative Ap1σ-GFP and mCherry-TubA (α-tubulin) subcellular localization. Notice Ap1σ fluorescent foci decorating dynamically TubA-labeled MTs, as highlighted with arrows in the selected time-lapse images on the lower panels (see also File S5). Hyphal apex is at the right side of the image series. (B) Time course of treatment of strains expressing Ap1σ and TubA with the anti-MT drug Benomyl (upper panels). Notice that Benomyl elicits an almost complete, but reversible, disassociation of Ap1σ and TubA, resulting in diffuse cytoplasmic florescent signals. In contrast, treatment with the anti-actin drug Latrunculin B does not elicit a significant change in the polar distribution of Ap1σ (lower panels). Hyphal apex is at the lower side of the image series. (C) Subcellular localization of AP-1 in wt and in strains lacking the kinesins KinA and UncA, respectively. Notice the absence of apical labeling of AP-1 in the kinAΔ strain, indicated with an arrowhead. Hyphal apex is at the lower side of the image series. (D) Subcellular organization of the MT network, as revealed by TubA-labeling, in a strain carrying a thiamine-repressible thiAp-ap1σ allele, observed under conditions of expression (−thi) or repression (+thi) of ap1σ. Note that the absence of Ap1σ leads to a less orientated network, bearing vertical (arrows) and curved MTs (arrowheads), and, in some cases, the appearance of bright cortical spots (two to seven puncta/hypha, usually exhibiting perinuclear localization). (E) Subcellular localization of GFP-tagged versions of septins AspB, AspC, AspD, and AspE in a strain carrying a thiamine-repressible thiAp-ap1σ allele, observed under conditions of expression (−thi) or repression (+thi) of ap1σ. Note that when ap1σ is repressed, AspB, AspC, and AspD form less higher order structures (HOS) such as filaments or bars (ap1+: 1.58 HOS/hypha, n = 87, ap1: 0.96 HOS/hypha, n = 103) and instead label more cortical spots (see right panel for quantification), some of which appear as opposite pairs at both sides of the plasma membrane, resembling septum formation initiation areas. In contrast, AspE localization remains apparently unaffected under ap1σ repression conditions. Hyphal apex is at the right side of the image series. Unless otherwise stated, Bar, 5 μm.
Figure 7
Figure 7
AP-1 is involved in endosome recycling. (A) Images showing the relative localization of Ap1σ and the endosomal marker RabB. Selected areas in small color boxes are magnified, marked with the same border coloration and positioned at the center of the relevant subpanel. Notice the dynamic association of AP-1 with RabB (see also File S6). (B) Subcellular localization of RabA (upper panels) and RabB (lower panels) in a strain carrying a thi-repressible thiAp-ap1σ allele, observed under conditions of expression (−thi) or repression (+thi) of ap1σ. Notice the increased numbers and clustering of both endosomal markers in rather immotile puncta when AP-1 expression is repressed. RabA endosomal subpopulation motility for n = 5 hyphae is 0.91 ± 0.11 static and 2.8 ± 0.49 mobile endosomes per 10 μm hyphal length in wild-type and 3.03 ± 0.10 static and 3.15 ± 0.31 motile endosomes per 10 μm hyphal length in AP-1 depleted conditions. In the case of RabB and for n = 7, endosomal subpopulations motility data are 1.41 ± 0.36 static and 2.76 ± 0.26 mobile endosomes per 10 μm hyphal length in wild-type and 3.16 ± 0.99 static and 2.72 ± 0.63 motile endosomes per 10 μm hyphal length in AP-1 depleted conditions. The increase of immotile endosomes in AP-1 depleted conditions compared to wt is statistically significant (P < 0.001 for RabA and P < 0.0001 for RabB). The motile subpopulation appears to be unaffected and shows no statistically significant difference. Hyphal apex is at the right side of the image series. (C) Selected time-lapse images of RabB in a strain carrying a thi-repressible thiAp-ap1σ allele, showing that the immotile RabB foci increase in number when ap1σ is repressed (+thi). However, faster trafficking endosomes can still be observed, in both retrograde and anterograde direction. Colored arrows are used to point out specific endosomal dots at 1 sec intervals. Subapical hyphal regions are presented in the image series. (D) Expression of RabB in a strain carrying a thi-repressible thiAp-ap1σ allele, stained with CMAC. Note that when ap1σ expression is repressed (+thi), most immotile RabB puncta are stained with CMAC. Note foci that colocalize with CMAC (arrow) and others that do not (arrowheads). Hyphal head is at the bottom left side of the image series. (E) Localization of endosomal markers RabA/B with the phospholipid flippase DnfA, in a strain carrying a thi-repressible thiAp-ap1σ allele, observed under conditions of expression (−thi) or repression (+thi) of ap1σ. Colocalization in both cases occurs only in a few spots (arrows) dispersed mostly subapically, being, however, more prominent in the case of RabA. Hyphal apex is at the bottom right side of the image series. (F) Working model summarizing major findings on the role of the AP-1 complex. Unless otherwise stated, Bar, 5 μm.
Figure 8
Figure 8
Highly speculative scheme on the role of AP-1 in A. nidulans hyphal tip growth based on the herein described microscopic observation of fluorescent tagged protein markers. In an ap1+ background the late-Golgi progressively turns into post-Golgi RabE-containing SVs coated by AP-1 (also depicted in the lower right panel). In the absence of a functional AP-1 complex (ap1), apparent accumulation of Golgi toward the fungal apex, mislocalization of endocytic collar associated actin patches toward the tip, failure of accumulation of SVs at the level of Spk, septin, and MT disorganization, and an overall enrichment in “sorting” endosomal and/or vacuolar structures are observed.

Similar articles

Cited by

References

    1. Abenza J. F., Pantazopoulou A., Rodríguez J. M., Galindo A., Peñalva M. A., 2009. Long-distance movement of Aspergillus nidulans early endosomes on microtubule tracks. Traffic 10: 57–75. 10.1111/j.1600-0854.2008.00848.x - DOI - PubMed
    1. Abenza J. F., Galindo A., Pantazopoulou A., Gil C., de los Ríos V., et al. , 2010. Aspergillus RabB Rab5 integrates acquisition of degradative identity with the long distance movement of early endosomes. Mol. Biol. Cell 21: 2756–2769. 10.1091/mbc.e10-02-0119 - DOI - PMC - PubMed
    1. Abenza J. F., Galindo A., Pinar M., Pantazopoulou A., de los Ríos V., et al. , 2012. Endosomal maturation by Rab conversion in Aspergillus nidulans is coupled to dynein-mediated basipetal movement. Mol. Biol. Cell 23: 1889–1901. 10.1091/mbc.e11-11-0925 - DOI - PMC - PubMed
    1. Anitei M., Hoflack B., 2011. Exit from the trans-Golgi network: from molecules to mechanisms. Curr. Opin. Cell Biol. 23: 443–451. 10.1016/j.ceb.2011.03.013 - DOI - PubMed
    1. Anton C., Taubas J. V., Roncero C., 2018. The functional specialization of exomer as a cargo adaptor during the evolution of fungi. Genetics 208: 1483–1498. 10.1534/genetics.118.300767. - DOI - PMC - PubMed

Publication types

MeSH terms