. 2018 Jul 3;115(27):E6356-E6365.
doi: 10.1073/pnas.1801582115. Epub 2018 Jun 20.

The impact of traditional neuroimaging methods on the spatial localization of cortical areas

Affiliations

The impact of traditional neuroimaging methods on the spatial localization of cortical areas

Timothy S Coalson et al. Proc Natl Acad Sci U S A. .

Abstract

Localizing human brain functions is a long-standing goal in systems neuroscience. Toward this goal, neuroimaging studies have traditionally used volume-based smoothing, registered data to volume-based standard spaces, and reported results relative to volume-based parcellations. A novel 360-area surface-based cortical parcellation was recently generated using multimodal data from the Human Connectome Project, and a volume-based version of this parcellation has frequently been requested for use with traditional volume-based analyses. However, given the major methodological differences between traditional volumetric and Human Connectome Project-style processing, the utility and interpretability of such an altered parcellation must first be established. By starting from automatically generated individual-subject parcellations and processing them with different methodological approaches, we show that traditional processing steps, especially volume-based smoothing and registration, substantially degrade cortical area localization compared with surface-based approaches. We also show that surface-based registration using features closely tied to cortical areas, rather than to folding patterns alone, improves the alignment of areas, and that the benefits of high-resolution acquisitions are largely unexploited by traditional volume-based methods. Quantitatively, we show that the most common version of the traditional approach has spatial localization that is only 35% as good as the best surface-based method as assessed using two objective measures (peak areal probabilities and "captured area fraction" for maximum probability maps). Finally, we demonstrate that substantial challenges exist when attempting to accurately represent volume-based group analysis results on the surface, which has important implications for the interpretability of studies, both past and future, that use these volume-based methods.

Keywords: CIFTI grayordinates; blurring; cross-subject alignment; neuroimaging analysis; standard space.


Conflict of interest statement

The authors declare no conflict of interest.

Figures

Fig. 1.
Fig. 1.
Probabilistic maps for five areas using both MSMAll areal-feature–based surface registration and FNIRT volume alignment. The volume-based peak probabilities are all lower than the surface-based probabilities for these example areas. Each volume-based area is shown on a parasagittal slice through the peak volumetric probability. See SI Appendix, Supplemental Methods M2 and M3. Data are available at https://balsa.wustl.edu/xK0Z.
Fig. 2.
Fig. 2.
(A) A scatterplot of areal-feature–based surface registration (MSMAll) peak areal probability vs. volume-based registration (FNIRT) peak areal probability for all 360 areas (180 per hemisphere). (B) A scatterplot of the individual areal signal captured by the group areal definitions (MPMs) (SI Appendix, Supplemental Methods M6 and M7) at resolutions of 4-mm functional (e.g., legacy fMRI data, in green), 2-mm functional (e.g., HCP-style fMRI, in blue), and 0.7-mm structural (e.g., myelin or ultrahigh field fMRI, in red). In the right scatter plot, gray lines connect the three data points for each area (averaged across hemispheres, 180 total) showing the degree to which surface-based and volume-based methods benefit from increased resolution (with intermediate resolutions lying along the lines). See SI Appendix, Supplemental Methods M2, M3, M6, and M7.
Fig. 3.
Fig. 3.
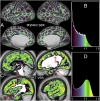
Areal uncertainty of MSMAll surface-based alignment (A) versus FNIRT volume-based alignment (C) for the 210V probabilistic cortical areas. The traditional volume-based approach has substantially greater uncertainty (greens, yellows, and oranges) than the HCP-style surface-based approach as seen in the histograms (B and D) as well as the images (A and C). In the volume-based results, some locations have low uncertainty (purple and black) and relatively sharp boundaries between areas (red arrows: early sensorimotor, insular, and inferior temporal cortex), comparable to what is consistently found on the surface. The volume ROIs that were used to create this figure were generated by mapping the individuals’ parcellations to the 0.7-mm MNI template space using the indiivduals’ native resolution MNI space surfaces and the ribbon-mapping method (19). Using 0.7-mm voxels minimizes the effects of voxel size on the group probability maps, allowing the effect of alignment to be investigated separately from the effect of voxel resolution. In practice, typical fMRI resolutions lead to increased signal mixing between areas and noncortical tissues, for both surface and volume analysis (see Effect of Acquisition Resolution). See SI Appendix, Supplemental Methods M2, M3, and M8. Data are available at https://balsa.wustl.edu/PGX1.
Fig. 4.
Fig. 4.
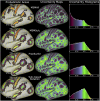
Effects of volume-based and surface-based smoothing on example cortical areas. The Top three rows show enlarged sagittal slices of volumetric probabilistic maps through the maximum probability of three exemplar areas, before (Left) and after unconstrained volume-based Gaussian smoothing of 4-mm (Center) or 8-mm (Right) FWHM. In each row, white dots are in corresponding positions for reference. The Bottom row shows the same amounts of surface-based Gaussian smoothing applied to the same three areas after areal-feature–based registration (MSMAll). Areal probability values decrease in the volume after smoothing substantially more than on the surface with the same amount in millimeters FWHM of smoothing. See SI Appendix, Supplemental Methods M3 and M4. Data are available at https://balsa.wustl.edu/7Blg.
Fig. 5.
Fig. 5.
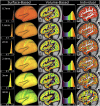
Comparison of different degrees of smoothing (columns) for both volume-based (Upper two rows) and surface-based (Lower two rows) approaches. Both areal uncertainty maps and histograms are shown. These were computed by smoothing the probability maps, which is equivalent to smoothing the per subject ROIs before averaging. Smoothing kernels on the surface clearly have less deleterious effects than smoothing kernels of the same size in the volume, because surface smoothing avoids smoothing across sulci or into other tissues. As with Fig. 3, the volume-based histograms have substantial “low uncertainty” tails that arise from poor alignment of the cortical ribbon, and from the tail of the Gaussian smoothing kernel within the white matter and CSF. See SI Appendix, Supplemental Methods M3, M4, and M8. Data are available at https://balsa.wustl.edu/6MB7.
Fig. 6.
Fig. 6.
Comparison of four surface-based alignments: MSMAll areal-feature–based registration (Top), MSMSulc folding-based registration (second row), FreeSurfer folding-based registration (third row), and a rigid spherical rotation alignment based on the FreeSurfer registration (Bottom). The Left column shows six probabilistic areas for each registration approach with yellow contours representing the areal boundaries from the 210V MPM. The Center column shows the maps of areal uncertainty (1 minus maximum probability at each vertex), as in Fig. 3. The Right column shows the histograms of the uncertainty maps. See SI Appendix, Supplemental Methods M4. Data are available at https://balsa.wustl.edu/1616.
Fig. 7.
Fig. 7.
The effect of acquisition resolution on the separation of cortical signal from noncortical signal, for surface-based (Left two columns) and volume-based (Center two columns) processing. The measure shown is the group average cortical gray matter fraction of each vertex or voxel. The Right-most column shows an individual’s (HCP subject 121618) cortical fraction volumes for the same six resolutions, as an example of the inputs to the analyses. Smoothing was not applied. The cortical signal fraction becomes somewhat degraded at the edge of cortex (green voxels) in many regions, even at 2-mm resolution (even though this is less than the mean cortical thickness) and is severely degraded (many green and blue voxels) at traditionally used resolutions between 3 and 4 mm. See SI Appendix, Supplemental Methods M2. Data are available at https://balsa.wustl.edu/5gMx.
Fig. 8.
Fig. 8.
(Left) Box and whisker plots of the peak probability of each area for various SBR methods and for FNIRT volume-based registration, plus the effects of differing amounts of surface (4-, 8-, and 15-mm FWHM) and volume smoothing (4- and 8-mm FWHM). Less optimal registration methods and greater smoothing consistently reduce peak areal probability. Volume-based smoothing has the largest impact, followed by volume-based versus surface-based alignment. The decrease of FreeSurfer compared with MSMSulc is similar in magnitude to that of smoothing MSMAll data by 4-mm FWHM. (Right) MPM captured area fraction using 2-mm MNI space voxels for the same 10 methods, showing a similar pattern. Notably, the areas that do worse in the new MSMAllStrain are generally well aligned by folding, whereas the areas that do better in MSMAllStrain have more variability across subjects (the new MSMAllStrain allows more mild-to-moderate distortions while clamping peak distortions). Red line is the median, box edges are the 25–75 percentiles, whiskers are 2.7 SDs, and red pluses are outliers beyond 2.7 SDs. See SI Appendix, Supplemental Methods M2–M7.
Fig. 9.
Fig. 9.
Comparison of the surface-based maximum partial-volume map to the maps produced after volume-based analysis with ASM or MIM, and 4-mm FWHM volume-based smoothing before ASM and MIM. The figure uses the same methods as SI Appendix, Fig. S10, and then uses the maximum fraction to label the surface vertices. In the Upper two rows, bright yellow is the white matter label, and bright orange is the CSF label (occurring in only a few small patches). Substantial regions of the cortex are not separated into cortical areas after volume-based analysis and MIM, and ASM shows significant stripes where the gyral crowns are decapitated. On the other hand, in regions of lower folding variability and variability of areas vs. folds, such as the insula, volume-based methods reproduce the parcellation found with the surface-based approach, particularly if smoothing is not used. See SI Appendix, Supplemental Methods M2 and M9. Data are available at https://balsa.wustl.edu/nKvx.

References

    1. Geschwind N. Selected Papers on Language and the Brain. Springer; Dordrecht, TheNetherlands: 1974. Disconnexion syndromes in animals and man; pp. 105–236.
    1. Brodmann K. Vergleichende Lokalisationslehre der Grosshirnrinde in ihren Prinzipien dargestellt auf Grund des Zellenbaues. Johann Ambrosius Barth; Leipzig, Germany: 1909.
    1. Nieuwenhuys R. The myeloarchitectonic studies on the human cerebral cortex of the Vogt-Vogt school, and their significance for the interpretation of functional neuroimaging data. Brain Struct Funct. 2013;218:303–352. - PubMed
    1. Petersen SE, Fox PT, Posner MI, Mintun M, Raichle ME. Positron emission tomographic studies of the cortical anatomy of single-word processing. Nature. 1988;331:585–589. - PubMed
    1. Belliveau JW, et al. Functional mapping of the human visual cortex by magnetic resonance imaging. Science. 1991;254:716–719. - PubMed

Publication types