

The evolution of juvenile susceptibility to infectious disease
- PMID: 29925619
- PMCID: PMC6030539
- DOI: 10.1098/rspb.2018.0844
The evolution of juvenile susceptibility to infectious disease
Abstract
Infection prior to reproduction usually carries greater fitness costs for hosts than infection later in life, suggesting selection should tend to favour juvenile resistance. Yet, juveniles are generally more susceptible than adults across a wide spectrum of host taxa. While physiological constraints and a lack of prior exposure can explain some of this pattern, studies in plants and insects suggest that hosts may trade off juvenile susceptibility against other life-history traits. However, it is unclear precisely how trade-offs shape the evolution of juvenile susceptibility. Here, we theoretically explore the evolution of juvenile susceptibility subject to trade-offs with maturation or reproduction, which could realistically occur due to resource allocation during development (e.g. prioritizing growth over immune defence). We show how host lifespan, the probability of maturation (i.e. of reaching the adult stage) and transmission mode affect the results. Our key finding is that elevated juvenile susceptibility is expected to evolve over a wide range of conditions, but should be lowest when hosts have moderate lifespans and an intermediate probability of reaching the adult stage. Our results elucidate how interactions between trade-offs and the epidemiological-demographic structure of the population can lead to the evolution of elevated juvenile susceptibility.
Keywords: age structure; development; eco-evolutionary theory; host–parasite; susceptibility; trade-off.
© 2018 The Authors.
Conflict of interest statement
We have no competing interests.
Figures
 ,
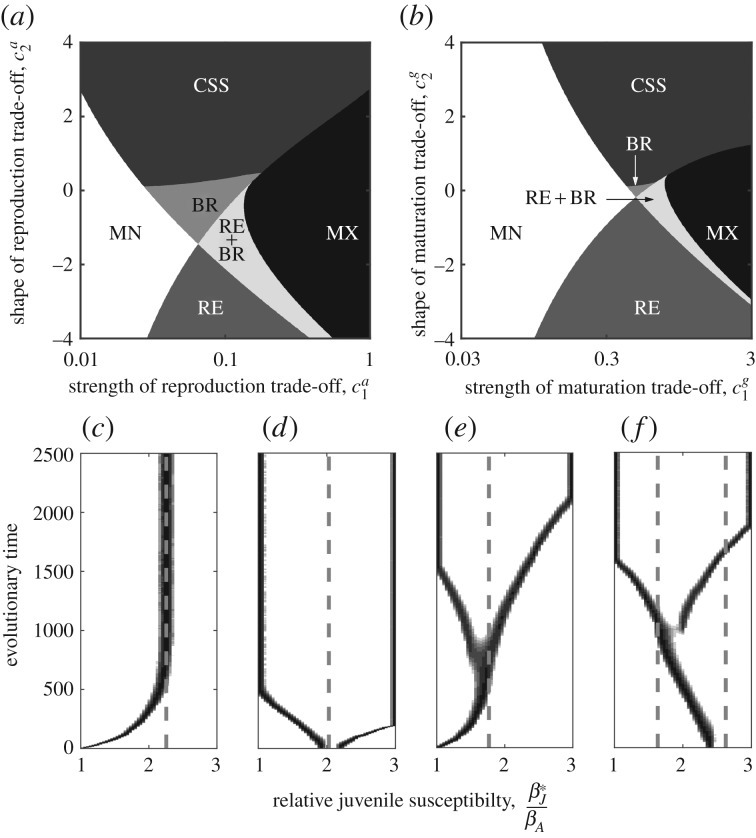
,  and βA = 2q.
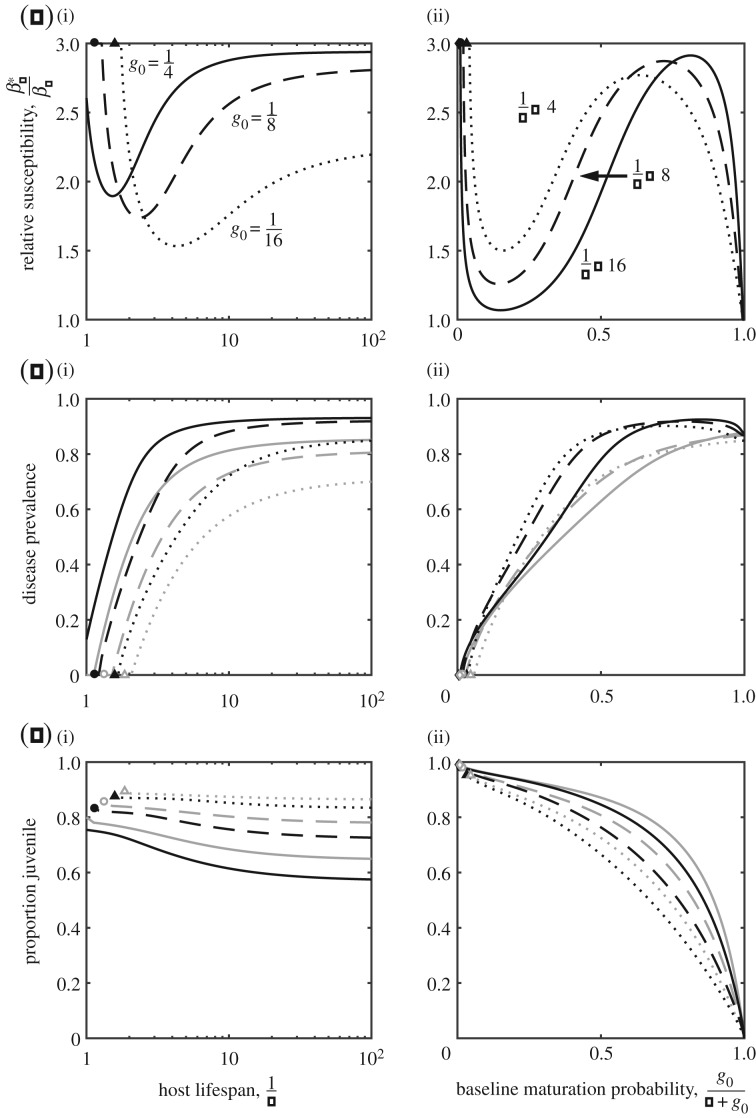
 ,
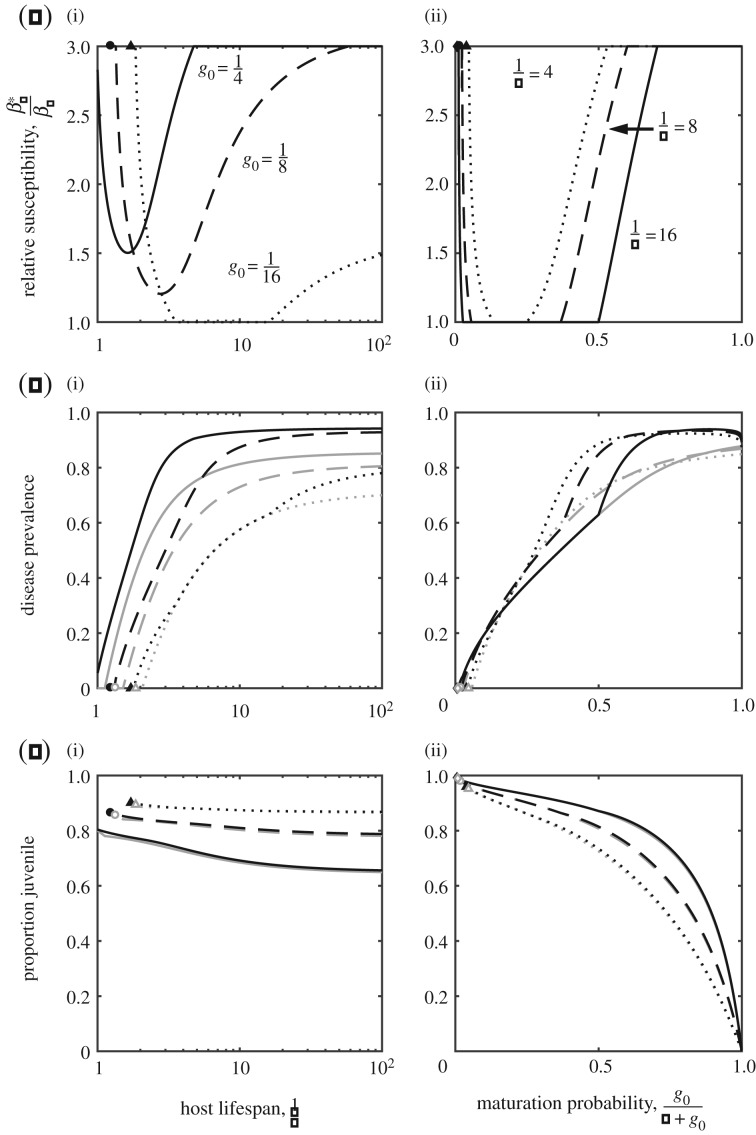
,  and βA = 2.
 (in a,b),
  ,
,  (in c,d),
  , and βA adjusted so that the age structure and disease structure of the population matches that when transmission is density-dependent.
Similar articles
-
The evolution of age-specific resistance to infectious disease.Proc Biol Sci. 2023 Jan 25;290(1991):20222000. doi: 10.1098/rspb.2022.2000. Epub 2023 Jan 25. Proc Biol Sci. 2023. PMID: 36695037 Free PMC article.
-
The Evolution of the Age of Onset of Resistance to Infectious Disease.Bull Math Biol. 2023 Apr 15;85(5):42. doi: 10.1007/s11538-023-01144-5. Bull Math Biol. 2023. PMID: 37060428 Free PMC article.
-
Cancer susceptibility and reproductive trade-offs: a model of the evolution of cancer defences.Philos Trans R Soc Lond B Biol Sci. 2015 Jul 19;370(1673):20140220. doi: 10.1098/rstb.2014.0220. Philos Trans R Soc Lond B Biol Sci. 2015. PMID: 26056364 Free PMC article.
-
Constraints, Trade-offs and the Currency of Fitness.J Mol Evol. 2016 Mar;82(2-3):117-27. doi: 10.1007/s00239-016-9730-3. Epub 2016 Feb 26. J Mol Evol. 2016. PMID: 26920684 Review.
-
The evolution of growth trajectories: what limits growth rate?Biol Rev Camb Philos Soc. 2011 Feb;86(1):97-116. doi: 10.1111/j.1469-185X.2010.00136.x. Biol Rev Camb Philos Soc. 2011. PMID: 20394607 Review.
Cited by
-
Dynamics of Pathogenic Fungi in Field Hedges: Vegetation Cover Is Differentially Impacted by Weather.Microorganisms. 2022 Feb 9;10(2):400. doi: 10.3390/microorganisms10020400. Microorganisms. 2022. PMID: 35208855 Free PMC article.
-
Season, size, and sex: factors influencing monogenean prevalence and intensity on Gambusia affinis in New Zealand.Parasitol Res. 2024 May 31;123(6):228. doi: 10.1007/s00436-024-08241-x. Parasitol Res. 2024. PMID: 38819616 Free PMC article.
-
Meta-Analysis of the Effects of Insect Pathogens: Implications for Plant Reproduction.Pathogens. 2023 Feb 18;12(2):347. doi: 10.3390/pathogens12020347. Pathogens. 2023. PMID: 36839619 Free PMC article. Review.
-
Hematodinium sp. infection does not drive collateral disease contraction in a crustacean host.Elife. 2022 Feb 18;11:e70356. doi: 10.7554/eLife.70356. Elife. 2022. PMID: 35179494 Free PMC article.
-
Age-dependent relationships among diet, body condition, and Echinococcus multilocularis infection in urban coyotes.PLoS One. 2023 Aug 30;18(8):e0290755. doi: 10.1371/journal.pone.0290755. eCollection 2023. PLoS One. 2023. PMID: 37647321 Free PMC article.
References
-
- Duca C. 1948. Age specific susceptibility to tuberculosis: experiments on guinea pigs and rats. Am. Rev. Tuberc. Pulm. Dis. 57, 389–399. - PubMed
-
- Sait S, Begon M, Thompson DJ. 1994. The influcence of larval age on the response of Plodia interpunctella to a granulosis virus. J. Invertebr. Pathol. 63, 107–110. (10.1006/jipa.1994.1020) - DOI
Publication types
MeSH terms
Associated data
Grants and funding
LinkOut - more resources
Full Text Sources
Other Literature Sources
Medical
