. 2018 Jun 20;10(446):eaao2301.
doi: 10.1126/scitranslmed.aao2301.

Afatinib restrains K-RAS-driven lung tumorigenesis

Affiliations

Afatinib restrains K-RAS-driven lung tumorigenesis

Herwig P Moll et al. Sci Transl Med. .

Abstract

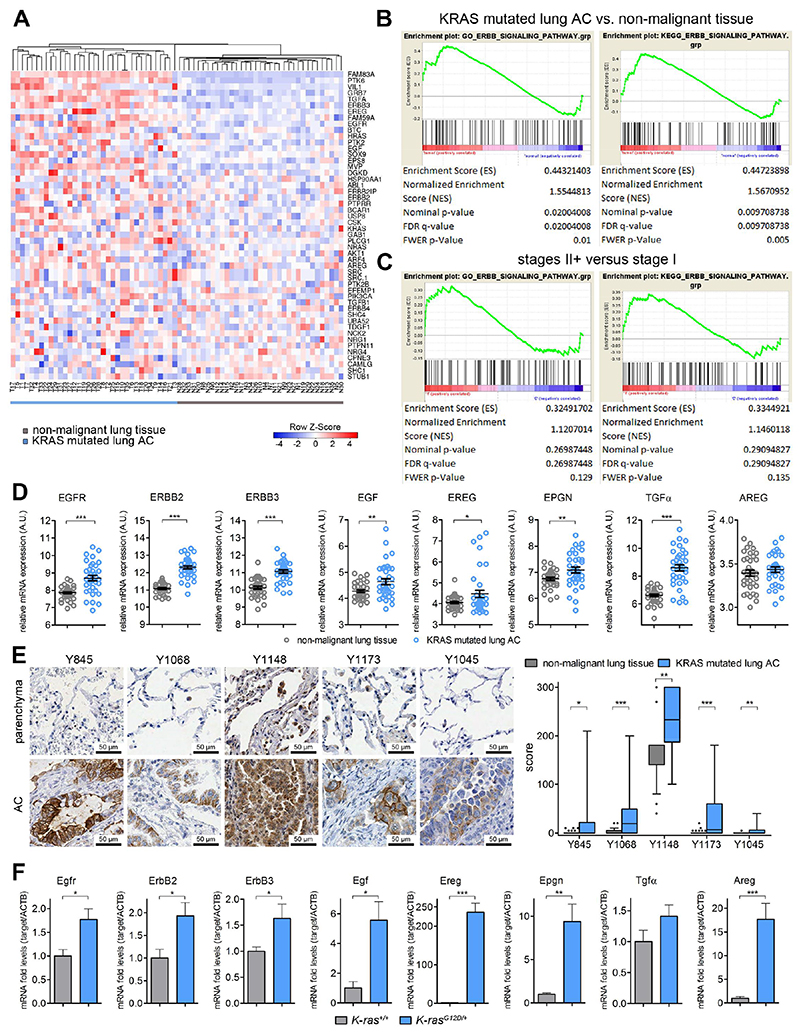
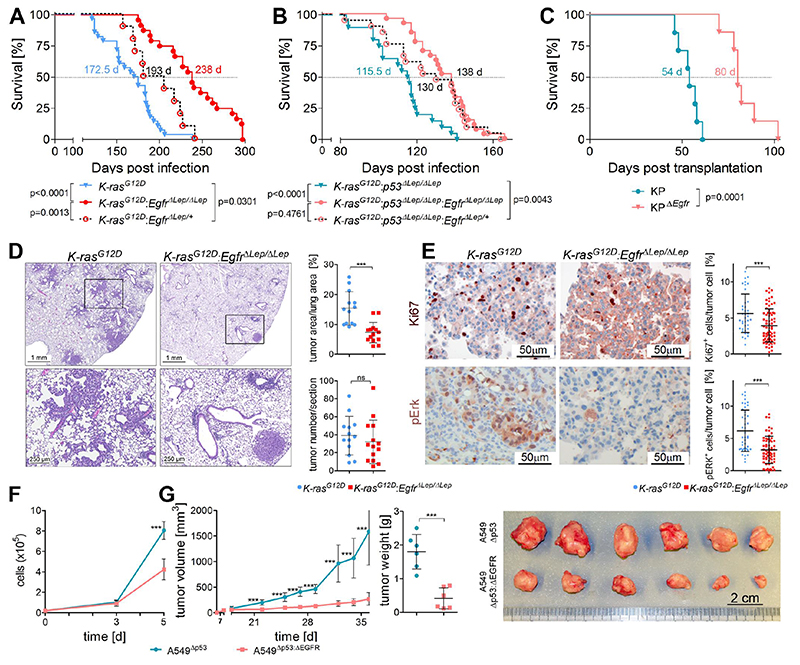
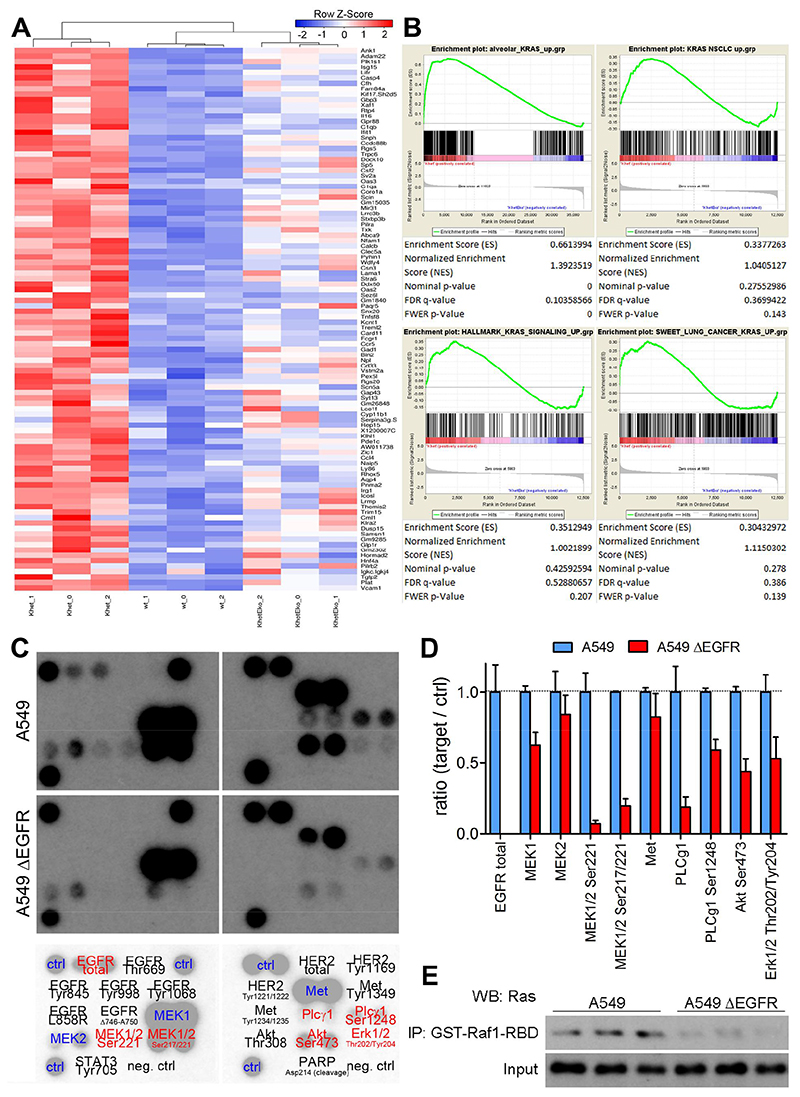
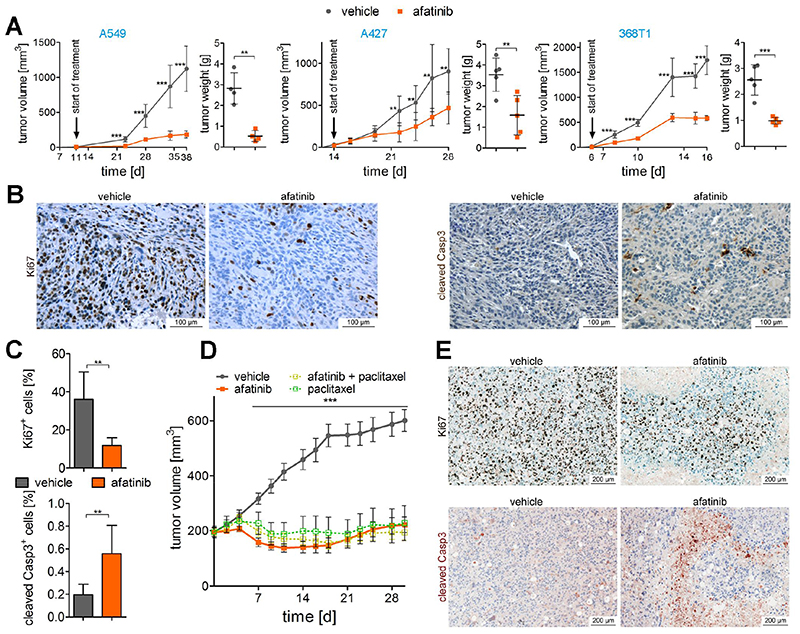
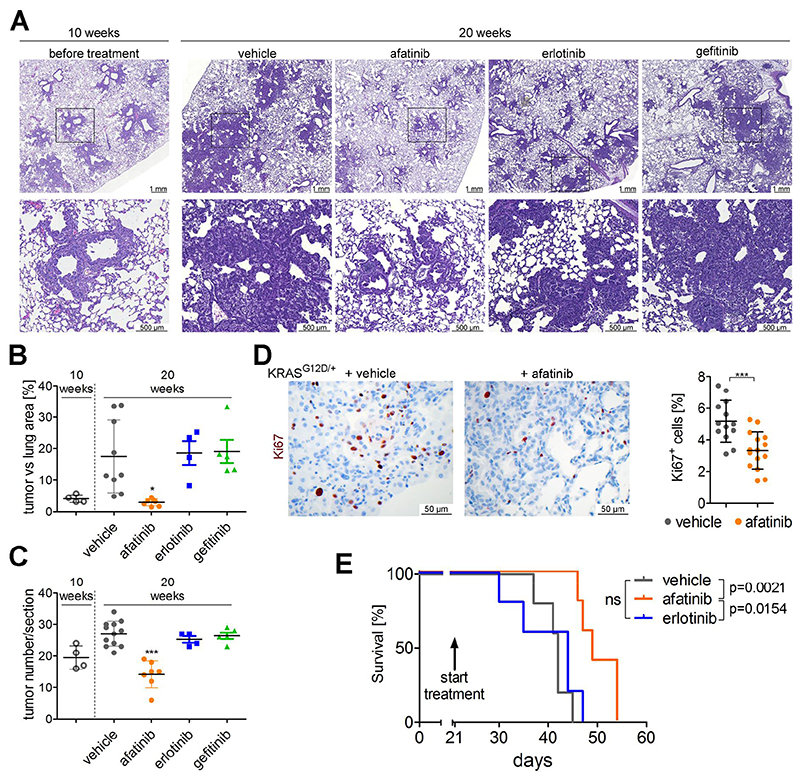
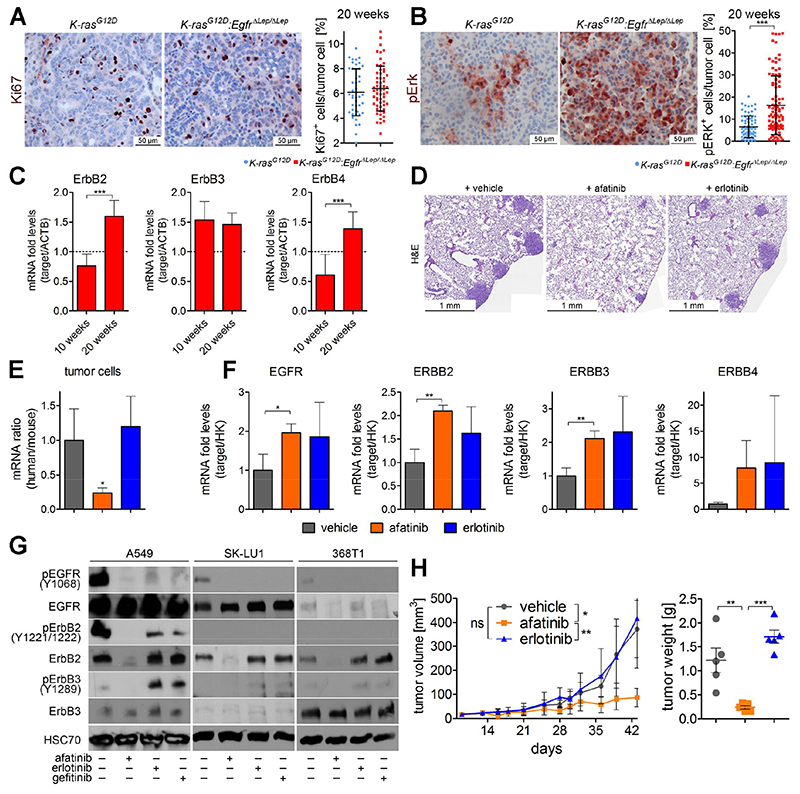
On the basis of clinical trials using first-generation epidermal growth factor receptor (EGFR) tyrosine kinase inhibitors (TKIs), it became a doctrine that V-Ki-ras2 Kirsten rat sarcoma viral oncogene homolog (K-RAS) mutations drive resistance to EGFR inhibition in non-small cell lung cancer (NSCLC). Conversely, we provide evidence that EGFR signaling is engaged in K-RAS-driven lung tumorigenesis in humans and in mice. Specifically, genetic mouse models revealed that deletion of Egfr quenches mutant K-RAS activity and transiently reduces tumor growth. However, EGFR inhibition initiates a rapid resistance mechanism involving non-EGFR ERBB family members. This tumor escape mechanism clarifies the disappointing outcome of first-generation TKIs and suggests high therapeutic potential of pan-ERBB inhibitors. On the basis of various experimental models including genetically engineered mouse models, patient-derived and cell line-derived xenografts, and in vitro experiments, we demonstrate that the U.S. Food and Drug Administration-approved pan-ERBB inhibitor afatinib effectively impairs K-RAS-driven lung tumorigenesis. Our data support reconsidering the use of pan-ERBB inhibition in clinical trials to treat K-RAS-mutated NSCLC.


Conflict of interest statement

Competing interests

The authors declare no potential conflicts of interest.

Figures

Fig. 1
Fig. 1. K-RAS mutated lung AC display increased EGFR activity.
(A) Heat map for mRNA expression in K-RAS mutated tumor biopsies (T1-T35) and adjacent non-malignant, healthy lung parenchyma (N1-N35) of the same patients. Displayed are the top 50 differentially regulated genes within the GO ERBB signaling pathway (GO: 0038127) and hierarchical clustering was performed using heatmapper.ca online tool (B) GSEA for GO and KEGG ERBB pathway signatures in K-RAS mutant tumors versus healthy “normal” tissue and (C) and in K-RAS mutated tumors of stage II and higher versus stage I. (D) Relative mRNA expression of indicated genes in healthy lung tissue and K-RAS tumors. n=35 per group, error bars, mean ± s.d. Data in (A)-(D) was retrieved from the Gene Expression Omnibus (GSE75037) (E) High resolution pictures of representative immunohistochemical stainings for indicated EGFR phosphorylation sites in human non-malignant lung parenchyma and K-RAS mutated lung AC and boxplot (min to max) of scoring values comparing EGFR phosphorylation specifically in tumor cells versus healthy tissue. n≥30 per group. (F) Relative mRNA expression in wildtype (K-ras+/+, n=5) and tumor bearing mouse lungs (K-rasG12D/+, n=6) at 10 weeks post tumor induction via Ad.Cre treatment. Actb was used for normalization. Data presented as mean ± s.d. (D) – (F) *p<0.05, **p<0.01, ***p<0.001.
Fig. 2
Fig. 2. Genetic EGFR ablation in K-RAS mutated lung AC reduces tumor growth.
(A) and (B) Kaplan-Meier analysis of K (K-rasG12D, n=24), KE (K-rasG12D:EgfrΔLep/ΔLep, n=28), KP (K-rasG12D:p53ΔLep/ΔLep, n=20) and KPE (K-rasG12D:p53ΔLep/ΔLep:EgfrΔLep/ΔLep, n=27) mice following intranasal infection with Ad.Cre. (C) Survival analysis of immunocompetent recipient mice following orthotopic transplantation of syngeneic K-ras G12D mutated and p53 deficient KP cells, with and without Egfr deletion (n=7 per group). (A) – (C) The median survival times of the respective groups are indicated. Differences in survival of groups were tested using the Log-rank test, and respective p values are shown. (D) Representative pictures of H&E staining including higher magnification of indicated area (bottom) of tumor bearing lungs 10 weeks post Ad.Cre inhalation of mice with specified genotypes. For quantitation, the mean values of two sections per mouse were used. Graphs represent mean of ratios ± s.d. of tumor area versus healthy lung area and mean of tumor numbers ± s.d. per section (n=13 mice for K-rasG12D and n=14 mice for K-rasG12D:EgfrΔLep/ΔLep). (E) Representative pictures of immunohistochemical staining of mouse lungs 10 weeks post tumor induction using antibodies specific for Ki67 and pErk. Tumor cell intrinsic expression of the respective genes in at least 5 individual tumors per mouse was evaluated using TissueGnostics software. Graphs represent mean ± s.d. of Ki67 and pErk positive tumor cells normalized to all tumor cells (n=5-7 mice per group). (F) Cell count of p53 deficient versus p53/EGFR double knockout A549 cells following standard in vitro cultivation. Graph represents mean ± s.d. of three individual clones per group. (G) Mean volumes ± s.d. of xenografted tumors comparing EGFR expressing versus EGFR deficient p53 knockout A549 cells, monitored over the course of the experiment as well as the endpoint tumor weight ± s.d. (n=6 per group). Picture illustrates the tumors after finalization of the experiment. (D) to (G) *p<0.05, ***p<0.001.
Fig. 3
Fig. 3. Inhibition of EGFR signaling downregulates K-RAS mutated activity.
(A) Heat map of top 100 upregulated genes in K-rasG12D versus wildtype type II alveolar cells and hierarchical clustering of wildtype (wt_0-2), K-rasG12D (Khet_0 – 2) and K-rasG12D:EgfrΔ/Δ (KhetEko_0-2) mouse pneumocytes. (B) GSEA of K-rasG12D versus K-rasG12D:EgfrΔ/Δ mouse pneumocytes for indicated gene sets. (C), Representative picture of antibody array of cell lysates of A549 and A549ΔEGFR cells (n=2 clones per group with 2 spots each). Antibody probes are decoded in lower panel, black color indicates that proteins were not detected in this assay and red color specifies proteins downregulated in the A549ΔEGFR group. (D) Densitometric quantitation of microarray films (n=2 clones per groups). (E) Western blot probing for RAS following GST-RAF1-RBD mediated pulldown in A549 and A549ΔEGFR cell lysates and respective input samples (n=3 per group).
Fig. 4
Fig. 4. Afatinib reduces growth of K-RAS mutant lung AC in vivo.
(A) Graphs display tumor volumes of (xeno-)grafts using indicated cell lines monitored over the experimental period and tumor volumes at the end of experiment. Mice were treated with vehicle alone or afatinib at 5 mg/kg body weight via oral gavage, 5 times per week, and the start of treatment is indicated. Means ± s.d. are shown. n=4 per group in the A549 experiment and n=5 per group in A427 and 368T1 experiment. Unpaired two-tailed t-test for individual time points and tumor weight. (B) Representative pictures of Ki67 and cleaved Caspase 3 staining of 368T1 cell line derived grafts upon vehicle and afatinib treatment and (C) quantitation of positive cells for respective staining (n=5). Positive tumor cells where determined using TissueGnostics software. (D) Mean tumor volumes ± s.d. of patient derived xenografts of lung AC tissue with KRASG12C mutation. Mice were treated with afatinib (15 mg/kg body weight, daily), paclitaxel (15 mg/kg body weight, once per week) or a combination of both treatments (n=8 per group). Unpaired two-tailed t-test for individual time points. (E) Representative Ki67 and cleaved caspase 3 stainings of sections of vehicle treated versus afatinib treated patient derived xenografts. (A), (C), (D), **p<0.01, ***p<0.001.
Fig. 5
Fig. 5. Afatinib, but not first generation EGFR TKI, inhibits growth of autochthonous K-ras tumors.
(A) Representative pictures of H&E stained lung sections of KrasG12D/+ mice 10 weeks post Ad.Cre inhalation (left panel) or 20 weeks post Ad.Cre inhalation and treatment over the last 10 weeks with vehicle, afatinib, erlotinib or gefitinib (5 mg/kg body weight, 5 times per week via oral gavage). Lower panels represent magnifications of indicated sections in top panel. n≥4 per group. (B), (C) Graphs represent mean ± s.d. of tumor area versus total lung area ratios and mean of tumor numbers ± s.d. per section of lung of mice. Each data point represents the mean value of two sections derived from one mouse. One way ANOVA and Tukey’s Multiple Comparison Test. (D) Representative pictures of Ki67 staining of lung tumors 20 weeks post Ad.Cre induction and 10 weeks of vehicle versus afatinib treatment. Ki67 positive tumor cells in at least 3 tumors per mouse were quantitated using TissueGnostic software, and blot indicates mean ± s.d. of Ki67 positive tumor cells. Student t-test, n= 4 mice per group. (E) Survival analysis of immunocompetent mice following orthotopic transplantation of syngeneic 368T1 lung AC cells. 3 weeks post injection, treatment with vehicle, afatinib or erlotinib (5 mg/kg body weight, 5 times per week via oral gavage) was started. Median survival times were 42 days for vehicle group, 49 days for afatinib group and 44 days for erlotinib group. Log-rank test, n=5. (B) to (E) *p<0.05, **p<0.01, ***p<0.001.
Fig. 6
Fig. 6. ERBB family members mediate resistance to EGFR inhibition, which can be blocked by afatinib.
(A) Representative picture of Ki67 and (B) of pErk in lung tumors of indicated mice 20 weeks post Ad.Cre administration. The percentage of tumor cells expressing the respective proteins were quantitated in at least 8 individual tumors per mouse using TissueGnostics software. Graphs represent mean ± s.d. of percentage of Ki67 and pErk positive tumor cells (n=6 mice per group). (C) mRNA expression of indicated genes in lungs of K-rasG12D:EgfrΔLep/ΔLep mice 10 weeks and 20 weeks post Ad.Cre inhalation. Actb was used as a housekeeper gene and relative expression is normalized to expression levels of K-rasG12D mice at respective time points (dotted line). n≥6 per group. (D) Representative photographs of H&E stained mouse lung sections, 5 weeks post orthotopic transplantation of A549Δp53 cells by tail vein injection and 3 weeks of treatment with vehicle, afatinib or erlotinib (5 mg/kg body weight, 5 times per week via oral gavage). (E) Relative mRNA expression ratios of human versus mouse housekeeping genes (ACTB and 28S) and in mouse lungs 5 weeks following orthotopic transplantation of A549Δp53 cells and 3 weeks of indicated treatment, and (F) relative mRNA expression levels of human variants of indicated genes normalized to human housekeeping genes (ACTB and 28S). (G) Western blot probing for indicated proteins in A549, SK-LU1 and 368T1 cell lysates following treatment with 1 μM of afatinib, erlotinib or gefitinib for 48 h. (H) Tumor volumes of A549ΔEGFR xenografts in mice receiving vehicle, afatinib or erlotinib treatment (5 mg/kg body weight, 5 times per week via oral gavage), starting 14 days post transplantation, monitored over the experimental period and tumor weights at the end of experiment. n≥5. (A) - (H) *p<0.05, **p<0.01, ***p<0.001.

Comment in

  • Redefining KRAS activation.
    Romero D. Romero D. Nat Rev Clin Oncol. 2018 Sep;15(9):532. doi: 10.1038/s41571-018-0068-1. Nat Rev Clin Oncol. 2018. PMID: 29985468 No abstract available.

References

    1. Siegel RL, Miller KD, Jemal A. Cancer statistics, 2016. CA: a cancer journal for clinicians. 2016;66:7–30. - PubMed
    1. T. C. G. A. Consortium. Comprehensive molecular profiling of lung adenocarcinoma. Nature. 2014;511:543–550. - PMC - PubMed
    1. Swanton C, Govindan R. Clinical Implications of Genomic Discoveries in Lung Cancer. The New England journal of medicine. 2016;374:1864–1873. - PubMed
    1. Kobayashi S, Boggon TJ, Dayaram T, Janne PA, Kocher O, Meyerson M, Johnson BE, Eck MJ, Tenen DG, Halmos B. EGFR mutation and resistance of non-small-cell lung cancer to gefitinib. The New England journal of medicine. 2005;352:786–792. - PubMed
    1. Pao W, Miller V, Zakowski M, Doherty J, Politi K, Sarkaria I, Singh B, Heelan R, Rusch V, Fulton L, Mardis E, et al. EGF receptor gene mutations are common in lung cancers from “never smokers” and are associated with sensitivity of tumors to gefitinib and erlotinib. Proceedings of the National Academy of Sciences of the United States of America. 2004;101:13306–13311. - PMC - PubMed

Publication types

MeSH terms

LinkOut - more resources