. 2018 Jun 20;10(446):eaao2565.
doi: 10.1126/scitranslmed.aao2565.

The ERBB network facilitates KRAS-driven lung tumorigenesis

Affiliations

The ERBB network facilitates KRAS-driven lung tumorigenesis

Björn Kruspig et al. Sci Transl Med. .

Erratum in

Abstract

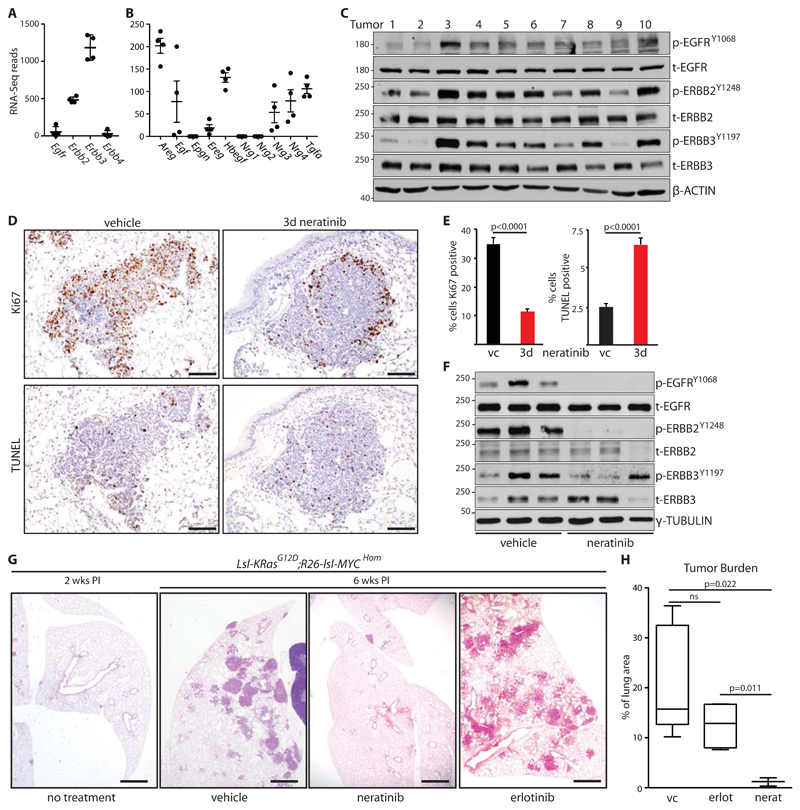
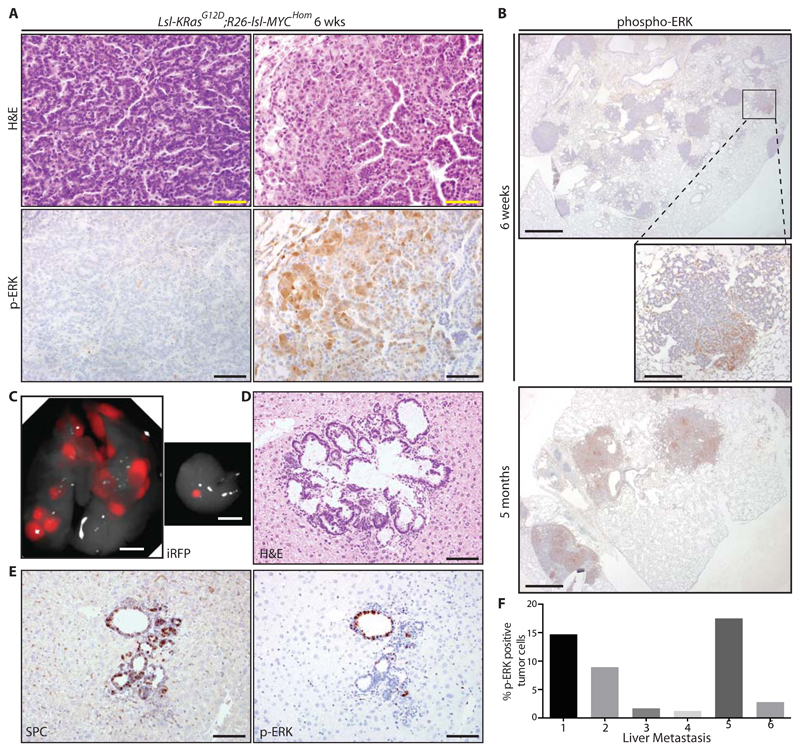
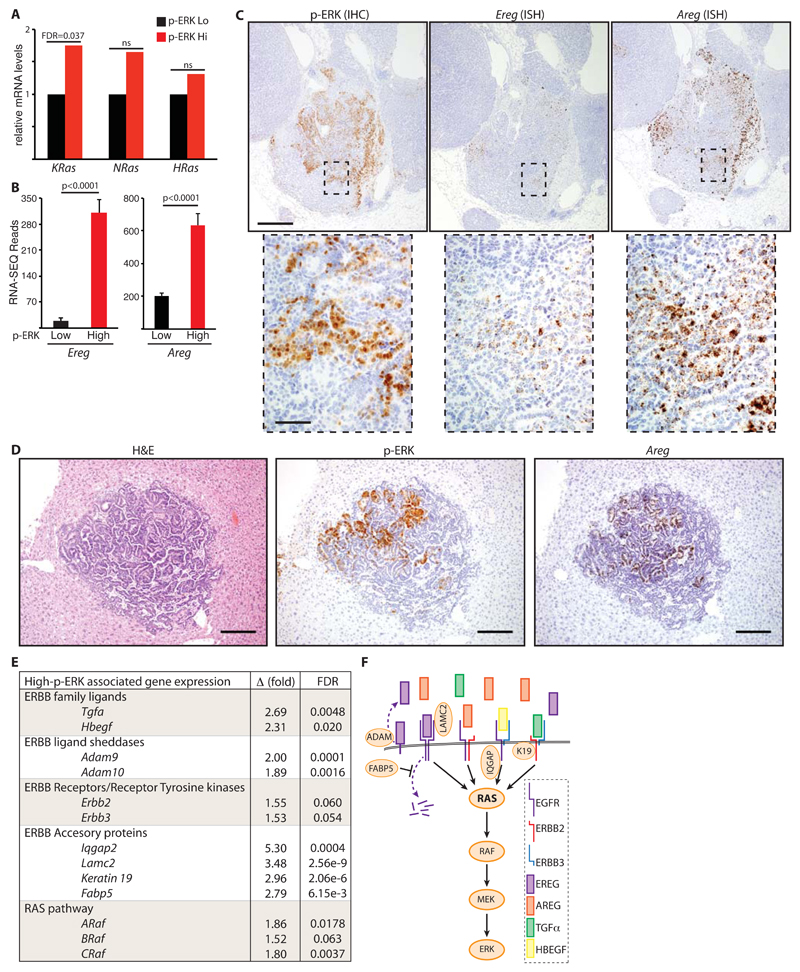
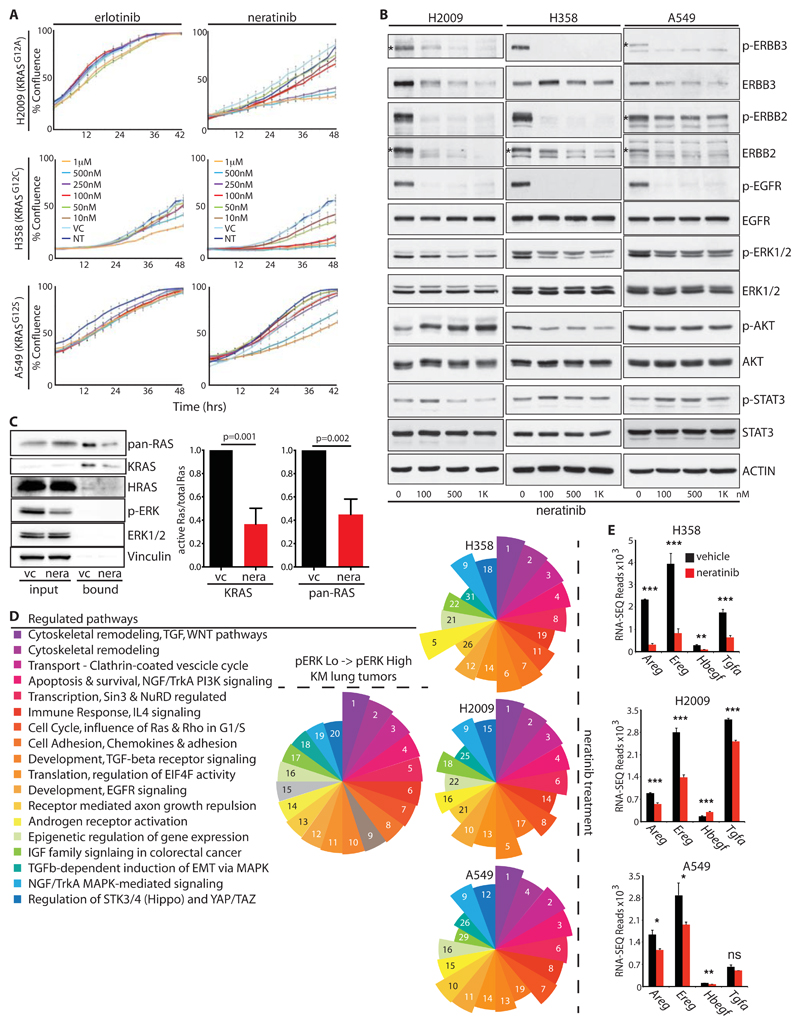
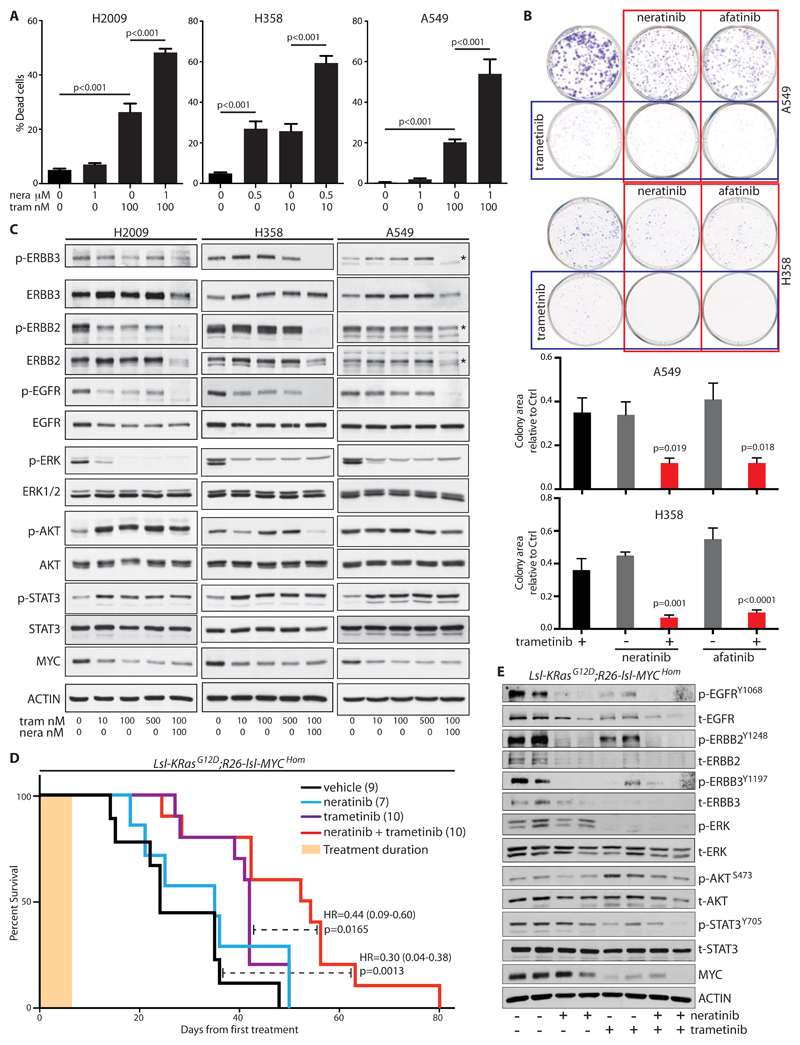
KRAS is the most frequently mutated driver oncogene in human adenocarcinoma of the lung. There are presently no clinically proven strategies for treatment of KRAS-driven lung cancer. Activating mutations in KRAS are thought to confer independence from upstream signaling; however, recent data suggest that this independence may not be absolute. We show that initiation and progression of KRAS-driven lung tumors require input from ERBB family receptor tyrosine kinases (RTKs): Multiple ERBB RTKs are expressed and active from the earliest stages of KRAS-driven lung tumor development, and treatment with a multi-ERBB inhibitor suppresses formation of KRASG12D-driven lung tumors. We present evidence that ERBB activity amplifies signaling through the core RAS pathway, supporting proliferation of KRAS-mutant tumor cells in culture and progression to invasive disease in vivo. Brief pharmacological inhibition of the ERBB network enhances the therapeutic benefit of MEK (mitogen-activated protein kinase kinase) inhibition in an autochthonous tumor setting. Our data suggest that lung cancer patients with KRAS-driven disease may benefit from inclusion of multi-ERBB inhibitors in rationally designed treatment strategies.


Conflict of interest statement

Competing interests: The authors declare no conflict of interest.

Figures

Figure 1
Figure 1. ERBB activity is required for KRAS-driven lung tumor formation
A) Expression of ERBB family RTKs in KM lung tumors harvested 6 weeks post allele induction (PI), measured by RNA-SEQ. Mean±SD read counts in tumors from 4 mice shown. B) Expression of ERBB family ligands in KM lung tumors harvested 6 weeks PI, as per (A). C) Immunoblots of lysates generated from 10 individual KM tumors, harvested 6 weeks PI, using the indicated antibodies. D) Representative images of IHC for Ki67 and TUNEL staining of KM mice treated for 3 days with 80 mg/kg neratinib (n=3) or vehicle control (n=3). Scale bars = 100 μm. E) Quantification (mean ± SEM) of staining in 5 tumors from each mouse as per (D). Left panel shows % of tumor cells expressing Ki67; right panel shows % of TUNEL-positive tumor cells; vc = vehicle control. P values are from 2-tailed T tests. F) Immunoblots of 3 individual KM tumors from mice treated for 3 days with neratinib or vehicle control. G) Representative H&E images from KM mice treated daily with neratinib (2 x 40 mg/kg) or erlotinib (2 x 50 mg/kg), commencing 2 weeks PI, and harvested at 6 weeks PI. Scale bar = 1 mm. H) Quantification of tumor burden from (G). Box and whisker plots show median, interquartile and 99% range of tumor area, expressed as a percentage of total lung tissue area, measured across >25 sections from each mouse. N = 5 vehicle control (vc); n = 4 erlotininb; n = 3 neratinib. ANOVA followed by Tukey test, ns=not significant.
Figure 2
Figure 2. KM lung tumor progression is associated with increased ERK phosphorylation
A) Images of H&E (upper panels) and phospho-ERK (lower panels) stained KM lung tumors harvested at 6 weeks PI illustrating histological changes associated with tumor progression: left panels are representative of >95% of total tumor area at 6 weeks PI, while right panels represent 2-5% of total tumor area at 6 weeks PI. Scale bar = 50 μm. B) Phospho-ERK staining in KM tumors harvested at 6 weeks PI (top and center panels) versus 5 months PI (bottom panel). Scale bars = 1 mm (top and bottom panels) and 200 μm (center panel). C) Detection of Hprt-lsl-IRFP expression in primary lung tumors (left) and a liver metastasis (right) in a KM mouse harvested 6 months PI. Scale bar = 5mm. D) Histological confirmation of liver metastasis stained by H&E. E) IHC detection of SPC and p-ERK in the same metastasis as (D). Scale bar = 50 μm (D and E). Images are representative of 6 mice. F) Halo quantification of p-ERK positive cells in individual metastases, expressed as % of tumor cells.
Figure 3
Figure 3. Expression of the ERBB network increases during progression from p-ERKlow to p-ERKhigh KM tumors
A) Normalized expression of RAS genes in laser-capture micro-dissected (LCM) p-ERKHigh KM tumor regions relative to p-ERKLow regions from tumors in the same mice (n = 4 mice), measured by RNA-SEQ. False discovery rate (FDR) shown for KRAS; ns = not statistically significant. B) Mean and SEM RNA-SEQ reads of Ereg and Areg mRNA from p-ERKLow & p-ERKHigh KM tumor regions from 4 mice. Adjusted p values were calculated in R. C) Serial sections of KM tumors stained by IHC for p-ERK (left panels) or by in situ hybridization for Ereg (center panels) or Areg (right panels). Scale bars = 200 μm (upper panels) & 25 μm (lower panels). D) Representative images of p-ERK (IHC) and Areg (ISH) expression in KM liver metastasis. Scale bar = 200 μm. Images are representative of 4 metastases with sufficient material. E) Normalized expression of ERBB network genes showing mean fold increase (Δ) in expression in p-ERKHigh relative to p-ERKLow KM tumor regions from 4 mice as per (A). FDR = false discovery rate. F) Diagrammatic representation of up-regulated components of the ERBB-RAS-ERK pathway associated with KM tumor progression.
Figure 4
Figure 4. A feed-forward ERBB signaling loop drives proliferation of KRAS-mutant human NSCLC cells
A) Growth curves of 3 KRAS-mutant human NSCLC lines upon treatment with increasing doses of the EGFR-selective inhibitor erlotinib or the multi-ERBB inhibitor, neratinib, measured by Incucyte time-lapse video-microscopy. Error bars show SD for technical triplicates. Data are representative of at least 2 independent experiments. B) Lysates from KRAS-mutant NSCLC cells treated with increasing doses of neratinib, immunoblotted with the indicated antibodies. Asterisks, where present, indicate the correct band. C) RAS immunoblots of RAF-coated bead precipitates from lysates of A549 cells treated with neratinib or vehicle control for 2 hours. Lysate input aliquots were also immunoblotted with the indicated antibodies. Right panel shows mean ± SEM for quantification of KRAS band intensities from 3 independent experiments (arbitrary units). P values are from 2-tailed T-tests. D) Top 20 significantly modulated pathways associated with the transition to p-ERKHigh disease in the KM model, identified using Metacore GeneGO analysis of RNA-SEQ expression data. Segment size in the pie chart (left panel) reflects ranking of the pathways by false discovery rate (FDR). Right panels show that 18 of the same pathways are modulated in each of 3 KRAS-mutant human NSCLC lines after overnight treatment with neratinib (250nM for A549 and H2009; 25nM for H358). Numbers and pie segment size reflect ranking by FDR. E) Expression of ERBB ligands in the indicated cells treated overnight with vehicle (black) or neratinib (red), measured by RNA-SEQ as per (D). Mean & SEM of biological triplicates shown. P values are from 2-tailed T-tests, abbreviated as follows: * =<0.05; ** = <0.01; *** <0.0001; ns = not significant.
Figure 5
Figure 5. ERBB blockade enhances MEK inhibitor-driven apoptosis in vitro and therapeutic impact in vivo
A) Apoptosis induced in human NSCLC cells, measured 48 hours after treatment with the indicated doses of neratinib (nera) and/or trametinib (tram). Mean ± SEM of 3 independent experiments shown (ANOVA & Tukey test). B) Clonogenic assay showing suppression of colony formation in A549 and H358 cells after 48 hours of treatment with the indicated inhibitors. Lower panels show quantification of colony area (% surface coverage) from 5 independent experiments. Significance was determined for drug combinations versus trametinib alone. (ANOVA & Tukey test). C) Lysates from the indicated cells treated for 24 hours with increasing doses of trametinib alone or the combination of trametinib and neratinib, immunoblotted with the indicated antibodies. Asterisks, where present, indicate the correct band. D) Overall survival, measured from the first day of treatment, of tumor-bearing KM mice treated daily for 1 week (tan bar) with neratinib (80 mg/kg), trametinib (1 mg/kg), or the combination of both, then followed without further intervention. Treatment was commenced at 5 weeks PI. Cohorts shown are vehicle (n=9); neratinib (n=7); trametinib (n=10); trametinib + neratinib (n=10). Logrank hazard ratios (HR±95% CI) and p values are shown for comparisons of T+N versus vehicle and T+N versus T alone (dashed lines). E) Lysates of individual tumors from mice treated with neratinib (80 mg/kg) and/or trametininb (1 mg/kg) for 3 days, blotted with the indicated antibodies.

Comment in

  • Redefining KRAS activation.
    Romero D. Romero D. Nat Rev Clin Oncol. 2018 Sep;15(9):532. doi: 10.1038/s41571-018-0068-1. Nat Rev Clin Oncol. 2018. PMID: 29985468 No abstract available.
  • Second chances.
    Dart A. Dart A. Nat Rev Cancer. 2018 Sep;18(9):531. doi: 10.1038/s41568-018-0044-1. Nat Rev Cancer. 2018. PMID: 30022145 No abstract available.

References

    1. Allemani C, Weir HK, Carreira H, Harewood R, Spika D, Wang XS, Bannon F, Ahn JV, Johnson CJ, Bonaventure A, Marcos-Gragera R, et al. Global surveillance of cancer survival 1995-2009: analysis of individual data for 25,676,887 patients from 279 population-based registries in 67 countries (CONCORD-2) Lancet. 2015;385:977–1010. - PMC - PubMed
    1. Cancer Genome Atlas Research Network. Comprehensive molecular profiling of lung adenocarcinoma. Nature. 2014;511:543–50. - PMC - PubMed
    1. Ostrem JM, Peters U, Sos ML, Wells JA, Shokat KM. K-Ras(G12C) inhibitors allosterically control GTP affinity and effector interactions. Nature. 2013;503:548–51. - PMC - PubMed
    1. Lito P, Solomon M, Li LS, Hansen R, Rosen N. Allele-specific inhibitors inactivate mutant KRAS G12C by a trapping mechanism. Science. 2016;351:604–8. - PMC - PubMed
    1. Roskoski R., Jr The ErbB/HER family of protein-tyrosine kinases and cancer. Pharmacological research. 2014;79:34–74. - PubMed

Publication types

MeSH terms

Substances