. 2018 Jun 20;38(25):5807-5825.
doi: 10.1523/JNEUROSCI.3565-17.2018.

Optogenetic Inhibition of CGRPα Sensory Neurons Reveals Their Distinct Roles in Neuropathic and Incisional Pain

Affiliations

Optogenetic Inhibition of CGRPα Sensory Neurons Reveals Their Distinct Roles in Neuropathic and Incisional Pain

Ashley M Cowie et al. J Neurosci. .

Abstract

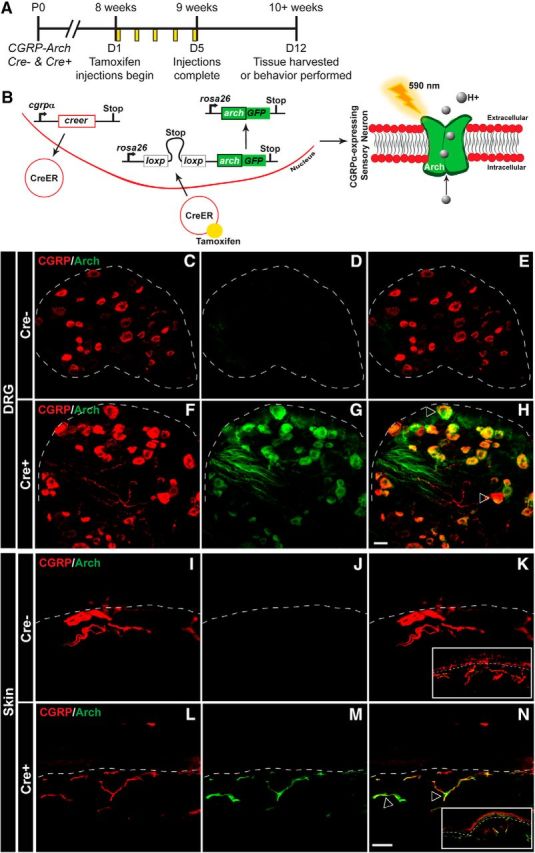
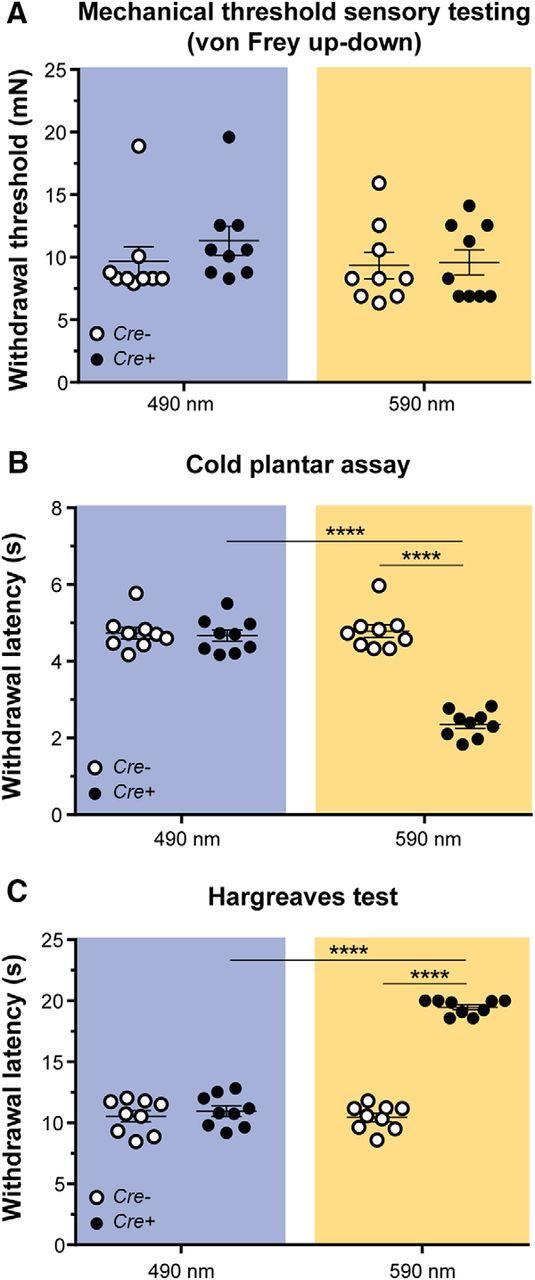
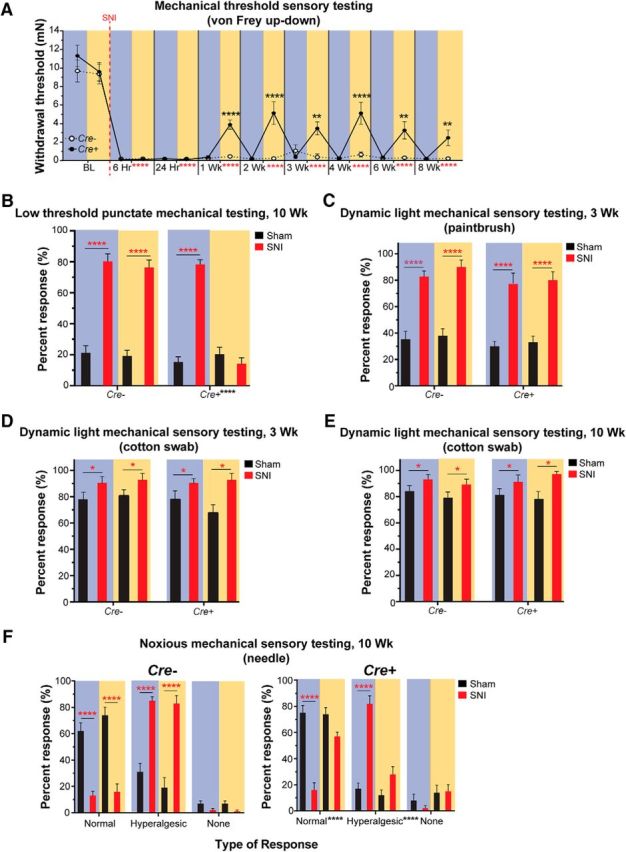
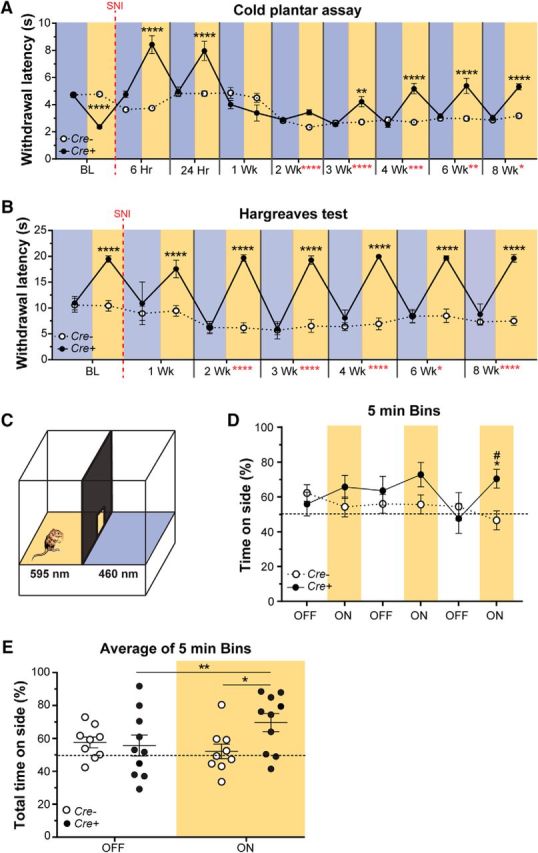
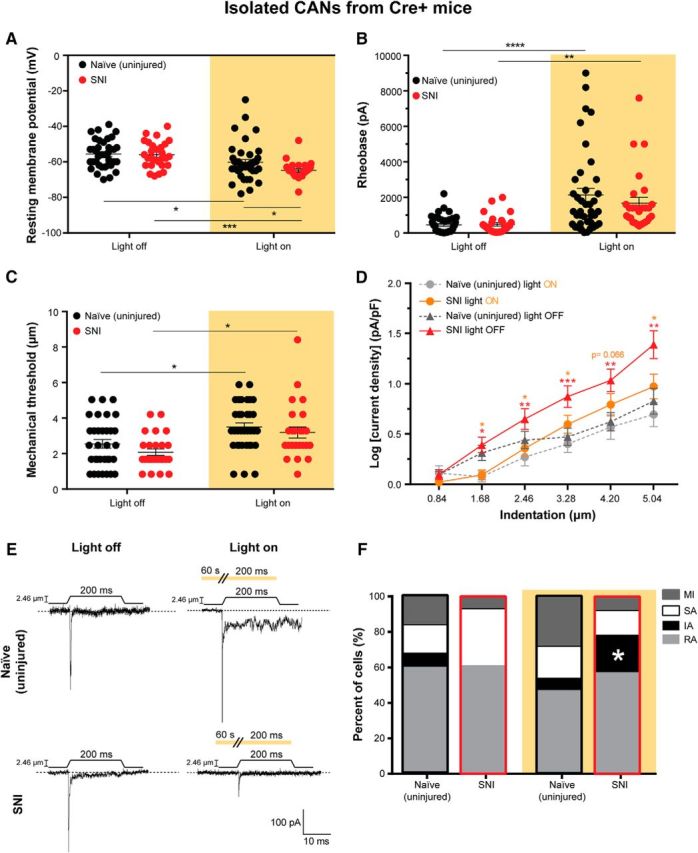
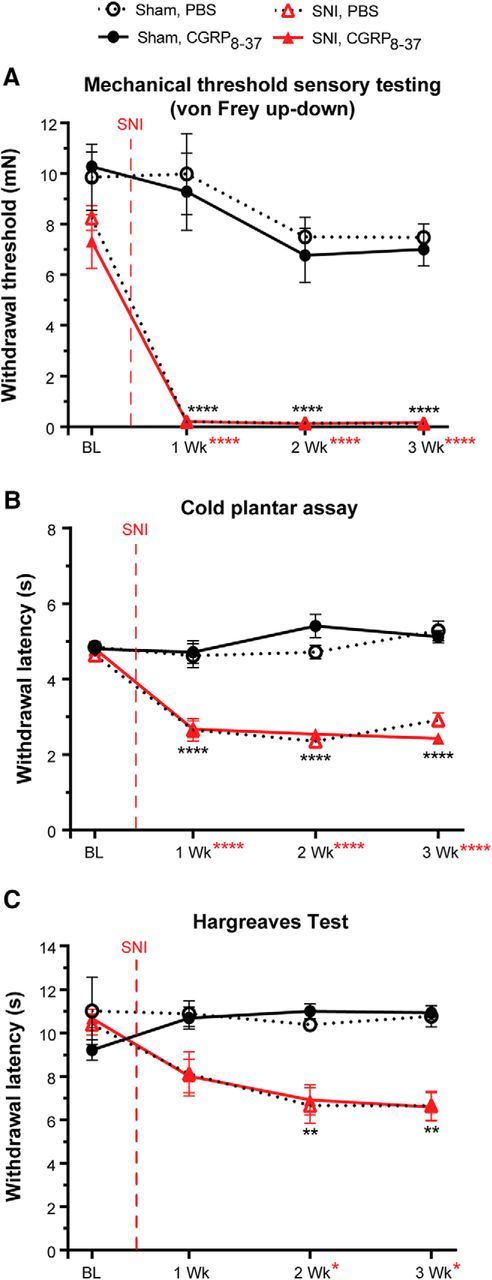
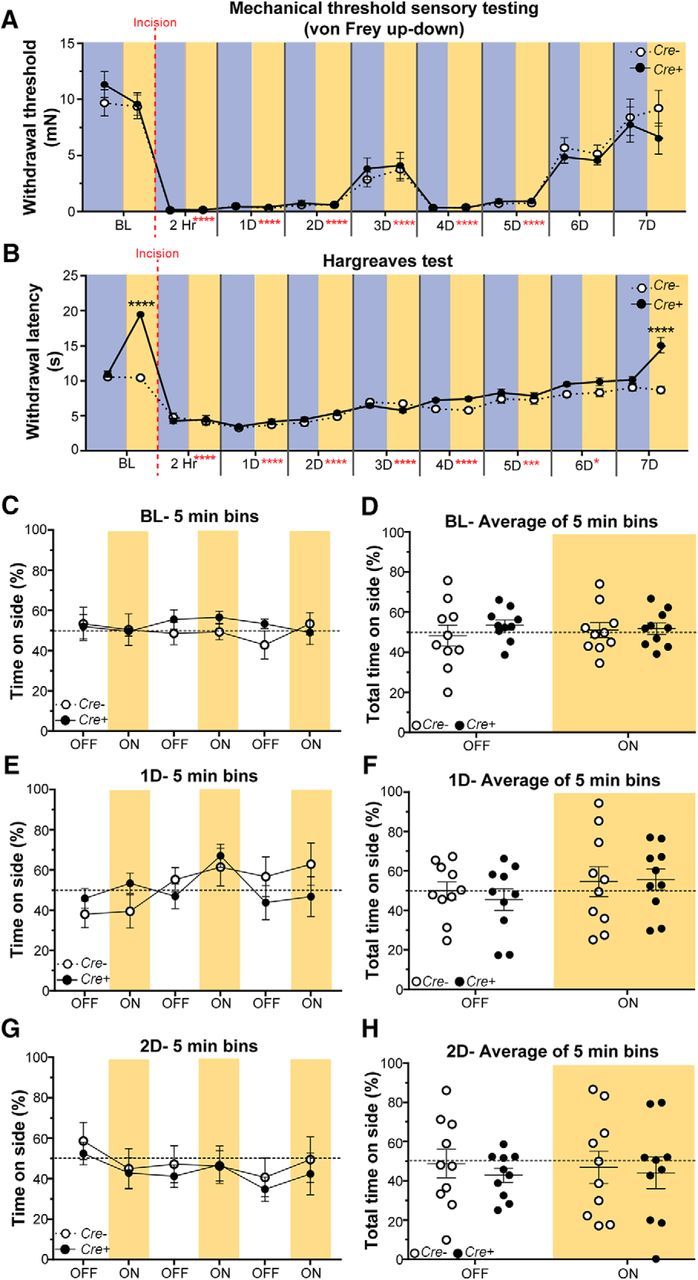
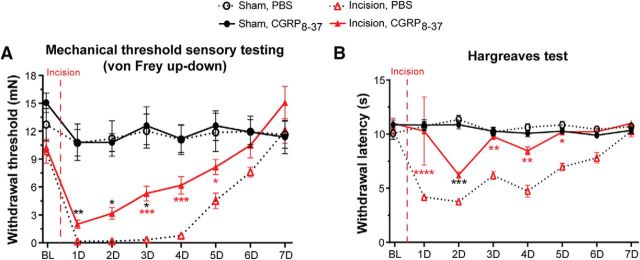
Cutaneous somatosensory neurons convey innocuous and noxious mechanical, thermal, and chemical stimuli from peripheral tissues to the CNS. Among these are nociceptive neurons that express calcitonin gene-related peptide-α (CGRPα). The role of peripheral CGRPα neurons (CANs) in acute and injury-induced pain has been studied using diphtheria toxin ablation, but their functional roles remain controversial. Because ablation permanently deletes a neuronal population, compensatory changes may ensue that mask the physiological or pathophysiological roles of CANs, particularly for injuries that occur after ablation. Therefore, we sought to define the role of intact CANs in vivo under baseline and injury conditions by using noninvasive transient optogenetic inhibition. We assessed pain behavior longitudinally from acute to chronic time points. We generated adult male and female mice that selectively express the outward rectifying proton pump archaerhodopsin-3 (Arch) in CANs, and inhibited their peripheral cutaneous terminals in models of neuropathic (spared nerve injury) and inflammatory (skin-muscle incision) pain using transdermal light activation of Arch. After nerve injury, brief activation of Arch reversed the chronic mechanical, cold, and heat hypersensitivity, alleviated the spontaneous pain, and reversed the sensitized mechanical currents in primary afferent somata. In contrast, Arch inhibition of CANs did not alter incision-induced hypersensitivity. Instead, incision-induced mechanical and heat hypersensitivity was alleviated by peripheral blockade of CGRPα peptide-receptor signaling. These results reveal that CANs have distinct roles in the time course of pain during neuropathic and incisional injuries and suggest that targeting peripheral CANs or CGRPα peptide-receptor signaling could selectively treat neuropathic or postoperative pain, respectively.SIGNIFICANCE STATEMENT The contribution of sensory afferent CGRPα neurons (CANs) to neuropathic and inflammatory pain is controversial. Here, we left CANs intact during neuropathic and perioperative incision injury by using transient transdermal optogenetic inhibition of CANs. We found that peripheral CANs are required for neuropathic mechanical, cold, and heat hypersensitivity, spontaneous pain, and sensitization of mechanical currents in afferent somata. However, they are dispensable for incisional pain transmission. In contrast, peripheral pharmacological inhibition of CGRPα peptide-receptor signaling alleviated the incisional mechanical and heat hypersensitivity, but had no effect on neuropathic pain. These results show that CANs have distinct roles in neuropathic and incisional pain and suggest that their targeting via novel peripheral treatments may selectively alleviate neuropathic versus incisional pain.

Keywords: archaerhodopsin; incision; inflammation; mechanotransduction; nerve injury; nociceptor.


Figures

Figure 1.
Figure 1.
Generation of mouse expressing Arch-GFP selectively in CANs. A, CGRPα-CreER was induced with tamoxifen injections given once a day for 5 consecutive days in adult mice (8+ weeks). All experiments were performed at least 7 d after the last tamoxifen injection. B, Left, Schematic of CGRPα-CreER induction and removal of floxed stop codon, which subsequently drives the expression of Arch-GFP in CANs. Right, Arch is a proton pump that when activated by 590 nm light, pumps H+ ions out of the cell, and thereby hyperpolarizes the cell. C–H, Representative confocal images of lumbar DRG from CGRP-Arch Cre mice (C–E) and Cre+ mice (F–H) stained with a CGRPα antibody (red) and excited Arch-GFP (green) with a 488 laser. Dotted line indicates border of DRG. C, F, Similar immunoreactivity was observed for CGRPα in both Cre (C) and Cre+ (F) animals. D, G, Whereas negligible fluorescence was observed for Arch-GFP in Cre animals (D), Arch+ fibers were observed throughout the DRG in Cre+ animals (G). E, H, Merged images showed no overlap between CGRPα and Arch-GFP in Cre animals (E), but significant overlap in Cre+ animals (H). I–N, Representative confocal images of glabrous skin from CGRP-Arch Cre mice (I–K) and Cre+ mice (L–N) stained with a CGRPα antibody (red) and excited Arch-GFP (green). Dotted line indicates epidermal/dermal border. I, L, CGRPα immunoreactivity was observed throughout neurons of the skin in Cre (I) and Cre+ (L) animals. J, M, No Arch+ fibers were observed in Cre mice (J), but many Arch+ fibers were observed in the skin of Cre+ animals (M). K, N, Merging showed no overlap between CGRPα and Arch-GFP in Cre animals (K), but significant overlap in Cre+ animals (N). Inset, Image of skin at 6× lower magnification. Open arrows indicate examples of CGRPα and Arch-GFP overlapping expression. Scale bar, 25 μm. DRG marker quantification is shown in Table 1.
Figure 2.
Figure 2.
Effects of transient inhibition of CANs in naïve animals. A, Mechanical threshold sensory testing was done using the von Frey up-down method. There was no change in mechanical threshold with either control 490 nm (p = 0.5449) or Arch-activating 590 nm (p = 0.9852) light treatment of CGRP-Arch Cre and Cre+ animals. B, Cold plantar testing was done using the cold plantar assay to determine withdrawal latencies to noxious cold. Inhibition of CANs with 590 nm light increased cold sensitivity only in Cre+ animals (****p < 0.0001), whereas 490 nm light had no effect on cold sensation (p = 0.9385). C, Hargreaves paw withdrawal testing was done using a radiant heat source shone on the plantar hindpaw. Inhibition of CANs with 590 nm light decreased heat sensitivity only in Cre+ animals (****p < 0.0001), whereas 490 nm light had no effect on heat sensitivity (p = 0.5686). Blue background represents 490 nm light treatment. Amber background represents 590 nm light treatment. Data are mean ± SEM and analyzed using two-way repeated-measures ANOVA; n = 9 animals/genotype.
Figure 3.
Figure 3.
Effects of CAN inhibition on mechanical sensitivity following nerve injury. A, Longitudinal measurements of von Frey thresholds were recorded at baseline (BL, uninjured) and 6 h through 8 weeks after SNI. Animals became hypersensitive to von Frey testing following SNI starting at 6 h and lasting at least 8 weeks. Treatment with 590 nm light partially reversed the mechanical hypersensitivity beginning 1 week after SNI and lasted 8 weeks. Vertical red dashed line indicates when SNI surgery was performed. B, Light punctate mechanical sensory testing was tested 10 weeks following SNI using repeated application of a 0.68 mN von Frey filament. SNI animals were hypersensitive to the 0.68 mN von Frey stimulus compared with sham animals. The 590 nm light treatment completely reversed the hypersensitivity in Cre+, but not Cre, animals. C, Dynamic light mechanical sensory testing was performed 3 weeks after SNI using a paintbrush. Responses to repeated paintbrush swiping are expressed as percentage of total number of responses over the number of times tested. SNI animals were hypersensitive to the dynamic paintbrush stimulus compared with sham animals. Treatment with 590 nm light had no effect on Cre or Cre+ animals. D, E, Dynamic light mechanical sensory testing was tested 3 weeks (D) and 10 weeks (E) after SNI using the cotton swab assay. Responses to repeated cotton swab swiping are expressed as percentage of total number of responses over the number of times tested. SNI animals were hypersensitive to the dynamic stimulus compared with sham animals. Treatment with 590 nm light had no effect on Cre+ or Cre animals. F, Noxious mechanical sensory testing was performed 10 weeks after SNI by applying a spinal needle to the lateral plantar hindpaw. Normal, hyperalgesic, and no responses are expressed as percentage of total number of responses over the number of times tested. Left, Cre animals, where SNI animals displayed more hyperalgesic responses to the needle compared with sham animals and light treatment had no effect on their responses. Right, Cre+ animals, where SNI animals displayed more hyperalgesic responses to the needle compared with sham animals, similar to Cre animals. Unlike Cre animals, 590 nm light treatment of SNI Cre+ animals exhibited responses similar to sham levels. A–F, Black asterisks indicate significant differences between 490 and 590 nm light treatment in Cre+ animals. Red asterisks indicate significant differences between BL/sham and post-SNI hypersensitivity. Blue background bars represent 490 nm light treatment. Amber background bars represent 590 nm light treatment. Hr, hours; Wk, weeks. n = 10/genotype and surgery. Data are mean ± SEM and analyzed using three-way ANOVA. ****p < 0.0001, **p < 0.005, *p < 0.05. ns, Not significant (p > 0.05).
Figure 4.
Figure 4.
Effects of CAN inhibition on thermal sensitivity and spontaneous pain following nerve injury. A, Longitudinal measurement of cold sensitivity before and after SNI using the cold plantar assay. Hypersensitivity to the cold stimulus occurred 2 weeks after SNI and lasted 8 weeks. Treatment of Cre+ animals with 590 nm light-induced cold hyposensitivity at 6 and 24 h after SNI, and partially reversed cold hypersensitivity beginning by 3 weeks after SNI and lasting 8 weeks. B, Longitudinal measurement of sensitivity to a radiant heat source before and after SNI using the Hargreaves paw withdrawal assay. Hypersensitivity to the heat stimulus occurred 2 weeks after SNI and lasted 8 weeks. Treatment of Cre+ animals with 590 nm light-induced heat hyposensitivity immediately at BL and lasted 8 weeks following SNI. A, B, Vertical red dashed line indicates the time point that SNI surgery was performed; n = 10 animals/genotype and surgery. Black asterisks indicate significant differences between 490 and 590 nm light treatment in Cre+ animals. Red asterisks indicate significant differences between BL and post-SNI hypersensitivity. Blue background bars represent 490 nm light treatment. Amber background bars represent 590 nm light treatment. Hr, hours; Wk, weeks. Data are mean ± SEM and analyzed using three-way ANOVA. ****p < 0.0001, ***p < 0.0005, **p < 0.005, *p < 0.05. ns, Not significant (p > 0.05). C, Diagram represents the real-time place preference setup, where at 10 weeks after SNI, Cre+ and Cre animals were allowed to choose to spend time in a chamber with a floor lit with either 595 and 460 nm light. The lights were off for 5 min and then turned on for 5 min; this sequence was repeated 3 times for a total of 30 min. D, Percentage time spent on the 595 nm side of the box during each 5 min bin. By the last 5 min ON bin, the Cre+ animals significantly preferred the 595 nm side of the box compared with light OFF (*p = 0.0205) and opposed to Cre animals (#p = 0.0471). E, The time spent on the 595 nm side of the box is represented as percentage of total time (15 min) during the light OFF and light ON conditions. Cre+ animals preferred the 595 nm side of the box when the lights were on (**p = 0.0047). Cre+ animals had a higher preference for the 595 nm side of the box when the lights were on compared with the Cre animals (*p = 0.0439). D, E, Amber bars represent 595 nm light treatment Data are mean ± SEM and analyzed using two-way repeated-measures ANOVA; n = 9 for Cre animals and n = 10 for Cre+ animals.
Figure 5.
Figure 5.
SNI increases mechanical responsiveness of CAN somata, which is reversed by Arch activation. Neurons from only the Cre+ CGRP-Arch mice were used for these experiments to be able to specifically identify CANs via their GFP expression. A, Resting membrane potential of naïve (uninjured) and SNI DRG neurons with (right) and without (left) Arch activation. Treatment of naïve (*p = 0.0254) and SNI (***p = 0.0002) neurons with 590 nm light decreased their resting membrane potentials compared with no light treatment. The 590 nm light decreased the resting membrane potential of the SNI neurons significantly more than naïve neurons (*p = 0.0474), two-way ANOVA. B, Rheobase (amount of current required to induce an action potential) in naïve and SNI neurons with (right) and without (left) Arch-activating light treatment. Treatment of naïve (****p < 0.0001) and SNI (**p = 0.0074) neurons with 590 nm light increased their rheobases compared with no light treatment, two-way ANOVA. C, Level of mechanical indentation required to elicit an inward current (mechanical threshold) in naïve and SNI neurons with (right) and without (left) light treatment. Treatment of naïve (*p = 0.0237) and SNI (*p = 0.0184) neurons with 590 nm light increased their mechanical threshold compared with no light treatment, two-way ANOVA. D, Log of mechanically gated current densities in response to a series of 6 increasing indentations of the DRG membrane of naïve neurons during light off (dark gray) and light on (light gray) and SNI neurons during light off (red) and light on (orange). Treatment of naïve neurons with 590 nm had no effect. SNI neurons had a greater current density in response to mechanical probing than naïve neurons. This increase in current density in response to mechanical probing in SNI neurons was reversed by 590 nm light treatment. Red asterisks indicate significant differences between naïve and SNI light off. Orange asterisks indicate significant differences between SNI light off and light on conditions. ***p < 0.0005 (mixed-model analysis). **p < 0.005 (mixed-model analysis). *p < 0.05 (mixed-model analysis). ns, Not significant (p > 0.05). E, Representative current traces from 2.46 μm indentation of naïve and SNI neurons during light off (left) and light on (right) conditions indicated by amber background. Amber bar above current traces during light on conditions (right) represents a continuous duration of light stimulation (60 s before the mechanical stimulus and throughout the 200 ms mechanical stimulus). F, Current kinetics in response to mechanical probing of naïve and SNI neurons during light off (left) and on (right) conditions. SNI neurons with no light treatment did not display IA currents, but SNI neurons treated with 590 nm light displayed a return of IA currents similar to naïve controls (*p = 0.0232). Black outline indicates naïve neurons. Red outline designates SNI neurons. Analysis was done using χ2 and Fisher's exact test. Amber background bars represent Arch-activating light treatment. Data are mean ± SEM. Naïve light off, n = 38 cells and n = 3 animals. Naïve light on, n = 40 cells and n = 3 animals. SNI light off, n = 28 cells and n = 6 animals. SNI light on, n = 28 cells and n = 6 animals.
Figure 6.
Figure 6.
Peripheral CAPS is not required for SNI mechanical and thermal hypersensitivity. A–C, Mice were administered intraplantar CGRP8–37 (533 μm) or PBS each test day 45 min before testing. A, Measurement of paw withdrawal threshold using the von Frey up-down method. CGRP8–37 had no effect on mechanical hypersensitivity in SNI animals or sham controls. B, Measurement of cold sensitivity using the cold plantar assay. CGRP8–37 had no effect on the SNI-induced cold hypersensitivity in SNI or sham animals. C, Measurement of sensitivity to a radiant heat source using the Hargreaves paw withdrawal assay. CGRP8–37 had no effect on heat hypersensitivity in SNI or sham animals. Vertical red dashed line indicates when SNI surgery was performed. Red asterisks indicate significant differences between naïve and SNI surgery. Black asterisks indicate significant differences between naïve and SNI animals treated with CGRP8–37. Data are mean ± SEM and analyzed using three-way ANOVA; n = 8 animals for each treatment group. ****p < 0.0001, **p < 0.005, *p < 0.05. ns, Not significant (p > 0.05).
Figure 7.
Figure 7.
Brief optogenetic inhibition of CANs has no effect on incisional pain. A, Measurement of paw withdrawal threshold using the von Frey up-down method. The 590 nm light had no effect on mechanical sensitivity. B, Measurement of sensitivity to a radiant heat source using the Hargreaves assay. The 590 nm light-induced heat hyposensitivity before incision, and also when the incision-induced hypersensitivity was gone at 7 d after incision; however, 590 nm light had no effect on incision-induced heat hypersensitivity. Blue background represents 490 nm light treatment. Amber background represents 590 nm light treatment. Vertical red dashed line indicates when the incision surgery was performed. Red asterisks indicate significant differences between baseline and postincision surgery. Black asterisks indicate significant differences between Cre+ and Cre animals. Data are mean ± SEM and analyzed using three-way ANOVA; n = 9 animals for each treatment group. ****p < 0.0001, ***p < 0.0005, *p < 0.05. ns, Not significant (p > 0.05). C–H, Real-time place preference where incision Cre and Cre+ animals were allowed to choose between a 595 and 460 nm lit floor. The lights were off for 5 min and then turned on for 5 min; this was repeated 3 times for a total of 30 min. C, E, G, Percentage time spent on the 595 nm side of the box during each 5 min bin before incision (BL) (C), 1 d (1D) following incision (E), and 2 d (2D) following incision (G). Neither Cre+ nor Cre exhibited preference (C: p = 0.6884; E: p = 0.1082; G: p = 0.1237). D, F, H, The time spent on the 595 nm side of the box is represented as percentage of total time (15 min) during the light OFF and light ON conditions before incision (BL) (D), 1 d (1D) following incision (F), and 2 d (2D) following incision (H). Neither Cre+ nor Cre animals exhibited a preference (D: p = 0.5428; F: p = 0.5498; H: p = 0.6557). C–H, Amber bars represent 595 nm light treatment. Data are mean ± SEM and analyzed using two-way repeated-measures ANOVA; n = 9 for Cre animals and n = 10 for Cre+ animals.
Figure 8.
Figure 8.
Peripheral antagonism of CAPS alleviates incisional pain. A, B, Mice were administered intraplantar CGRP8–37 (533 μm) or PBS each test day 45 min before testing. A, Measurement of paw withdrawal threshold using the von Frey up-down method. CGRP8–37 partially reversed the mechanical hypersensitivity of incision animals by 3 d and had no effect on sham animals. B, Measurement of sensitivity to a radiant heat source using the Hargreaves assay. CGRP8–37 immediately reversed the heat hypersensitivity following incision but had no effect on sham animals. Vertical red dashed line indicates when the incision surgery occurred. Red asterisks indicate significant differences between incision CGRP8–37 and incision PBS animals. Black asterisks indicate significant differences between sham CGRP8–37 and incision CGRP8–37. Data are mean ± SEM and analyzed using three-way ANOVA; n = 8 animals for each treatment group. ****p < 0.0001, ***p < 0.0005, **p < 0.005, *p < 0.05. ns, Not significant (p > 0.05).
Figure 9.
Figure 9.
Injury does not induce ectopic expression of Arch. A–D, Representative confocal images of glabrous skin from sham CGRP-Arch Cre+ mice stained with a keratin 14 antibody (red) and DRAQ5 nuclear stain (blue) and excited Arch-GFP (green) with a 488 laser. D, Merged image showed no overlap between Arch-GFP and keratin 14. E–H, Representative confocal images of glabrous skin from CGRP-Arch Cre+ mice 3 weeks following SNI stained with a keratin 14 antibody (red) and DRAQ5 nuclear stain (blue) and excited Arch-GFP (green) with a 488 laser. F, Arch-GFP CANs are significantly decreased compared with sham. H, Merged image shows no overlap between Arch-GFP and keratin 14. I–L, Representative confocal images of glabrous skin from CGRP-Arch Cre+ mice 1 d following incision stained with a keratin 14 antibody (red) and DRAQ5 nuclear stain (blue) and excited Arch-GFP (green) with a 488 laser. J, Arch-GFP CANs are not changed compared with sham. L, Merged image shows that there is no overlap between Arch-GFP and keratin 14. Scale bar, 25 μm.

References

    1. Abrahamsen B, Zhao J, Asante C, Cendan CM, Marsh S, Martinez-Barbera JP, Nassar MA, Dickenson AH, Wood JN (2008) The cell and molecular basis of mechanical, cold, and inflammatory pain. Science 321:702–705. 10.1126/science.1156916 - DOI - PubMed
    1. Assas BM, Pennock JI, Miyan JA (2014) Calcitonin gene-related peptide is a key neurotransmitter in the neuro-immune axis. Front Neurosci 8:1–9. 10.3389/fnins.2014.00023 - DOI - PMC - PubMed
    1. Baliki M, Calvo O, Chialvo DR, Apkarian AV (2005) Spared nerve injury rats exhibit thermal hyperalgesia on an automated operant dynamic thermal escape task. Mol Pain 1:18. 10.1186/1744-8069-1-18 - DOI - PMC - PubMed
    1. Banik RK, Woo YC, Park SS, Brennan TJ (2006) Strain and sex influence on pain sensitivity after plantar incision in the mouse. Anesthesiology 105:1246–1253. 10.1097/00000542-200612000-00025 - DOI - PubMed
    1. Barabas ME, Stucky CL (2013) TRPV1, but not TRPA1, in primary sensory neurons contributes to cutaneous incision-mediated hypersensitivity. Mol Pain 9:1–14. 10.1186/1744-8069-9-9 - DOI - PMC - PubMed

Publication types

Substances