. 2018 Aug 16;92(17):e00404-18.
doi: 10.1128/JVI.00404-18. Print 2018 Sep 1.

Axonal Transport Enables Neuron-to-Neuron Propagation of Human Coronavirus OC43

Affiliations

Axonal Transport Enables Neuron-to-Neuron Propagation of Human Coronavirus OC43

Mathieu Dubé et al. J Virol. .

Abstract

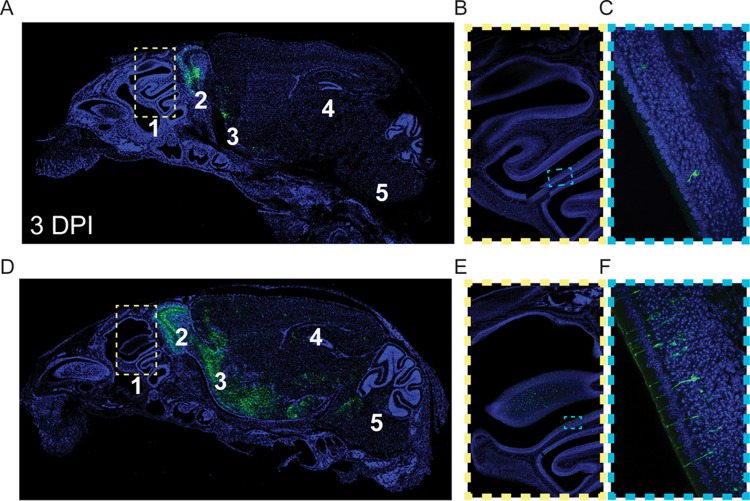
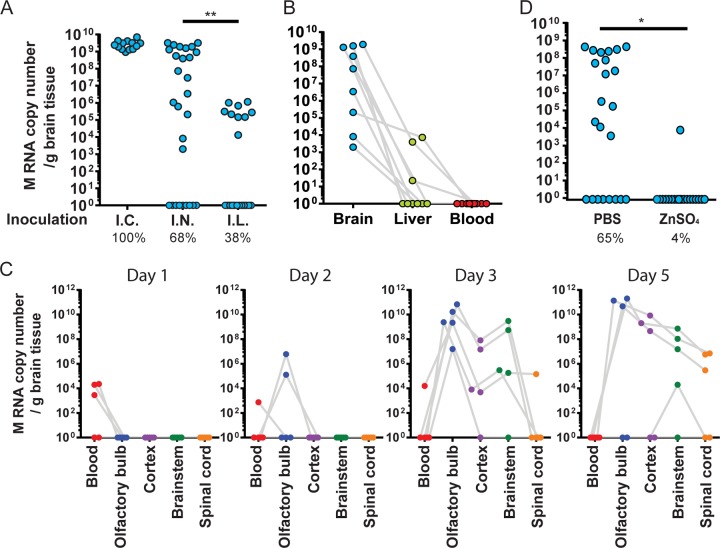
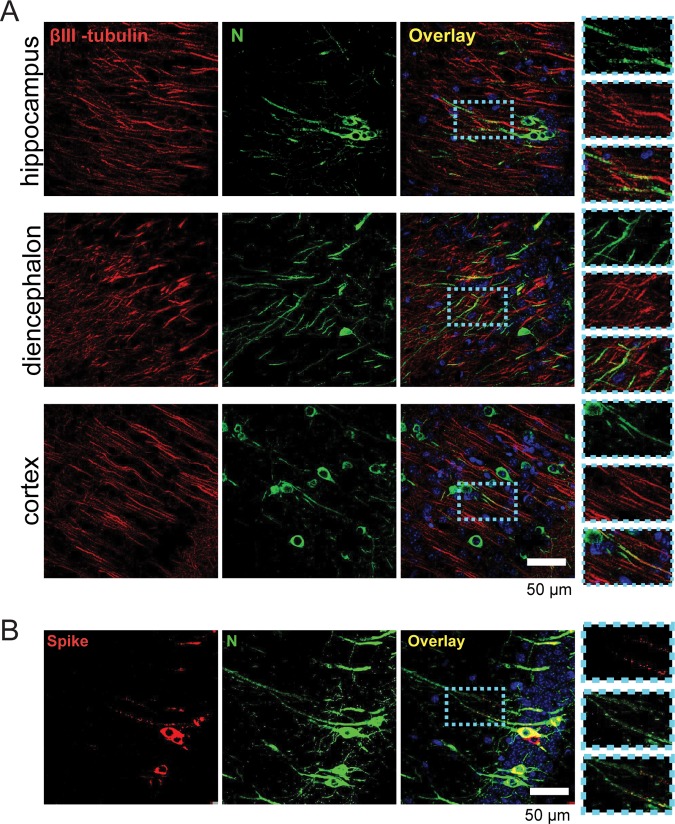
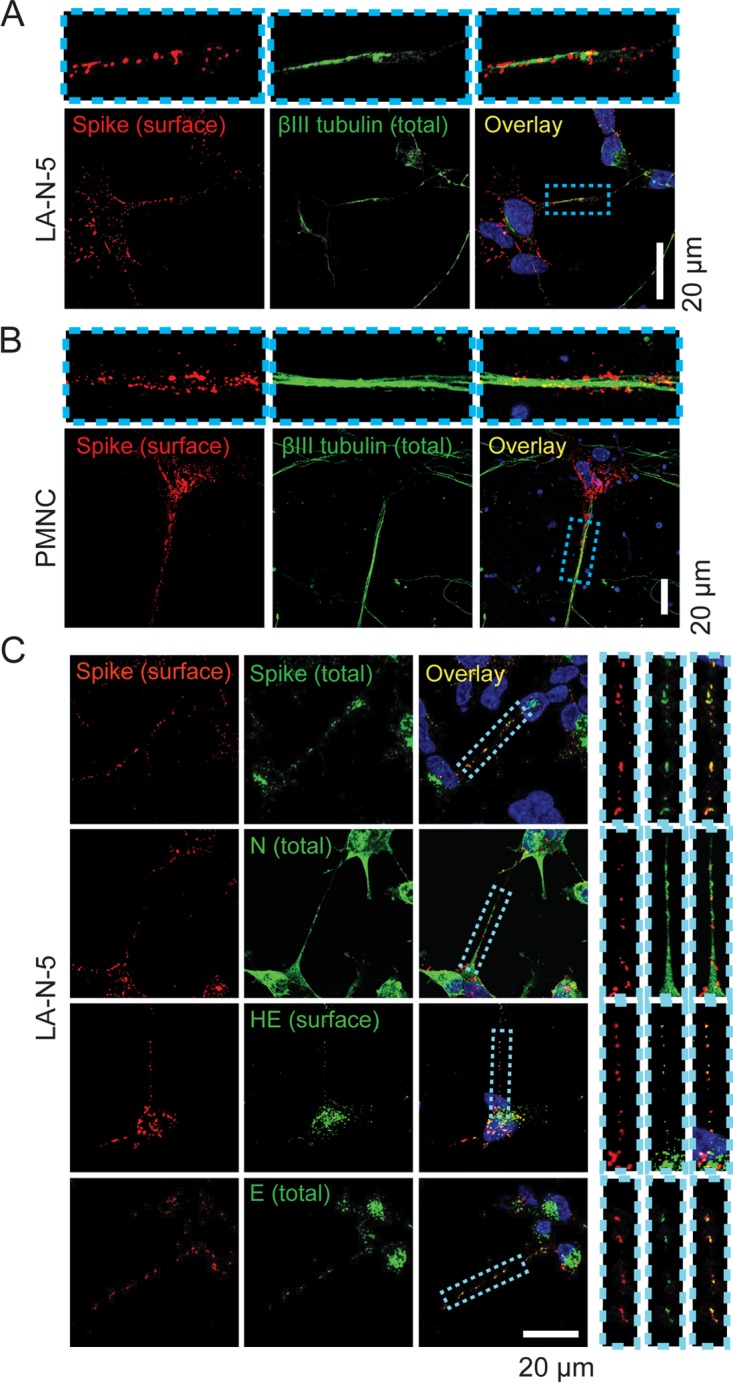
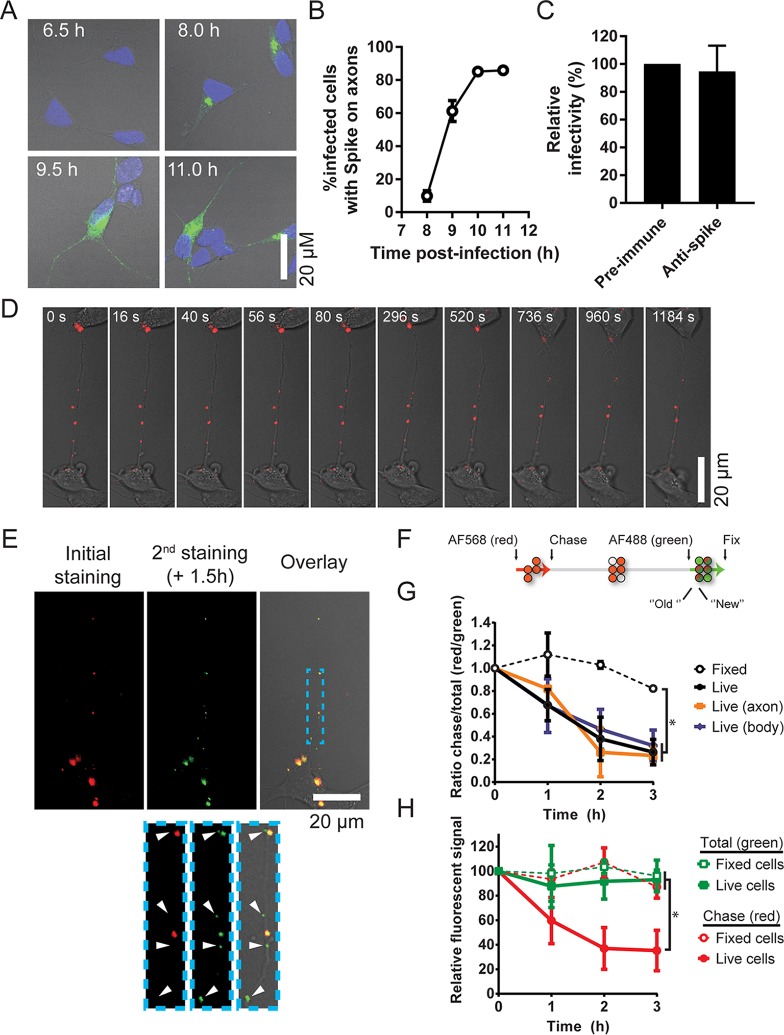
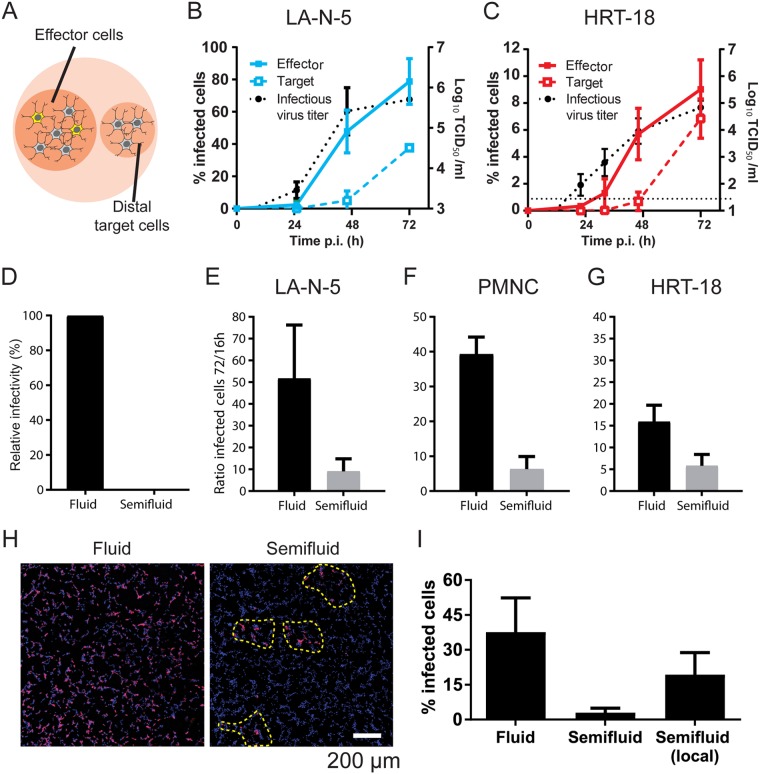
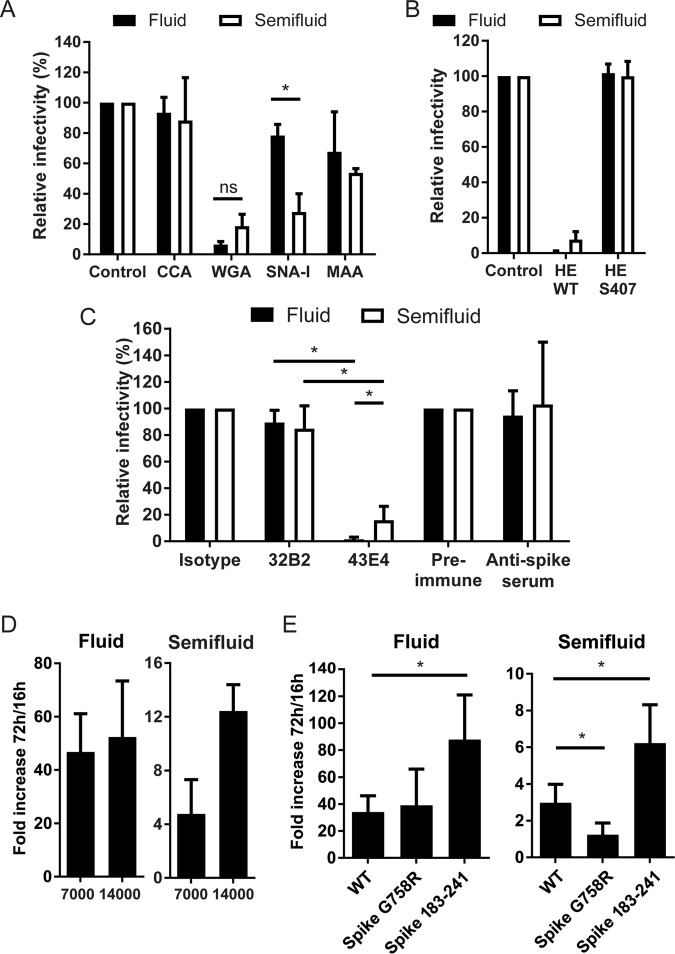
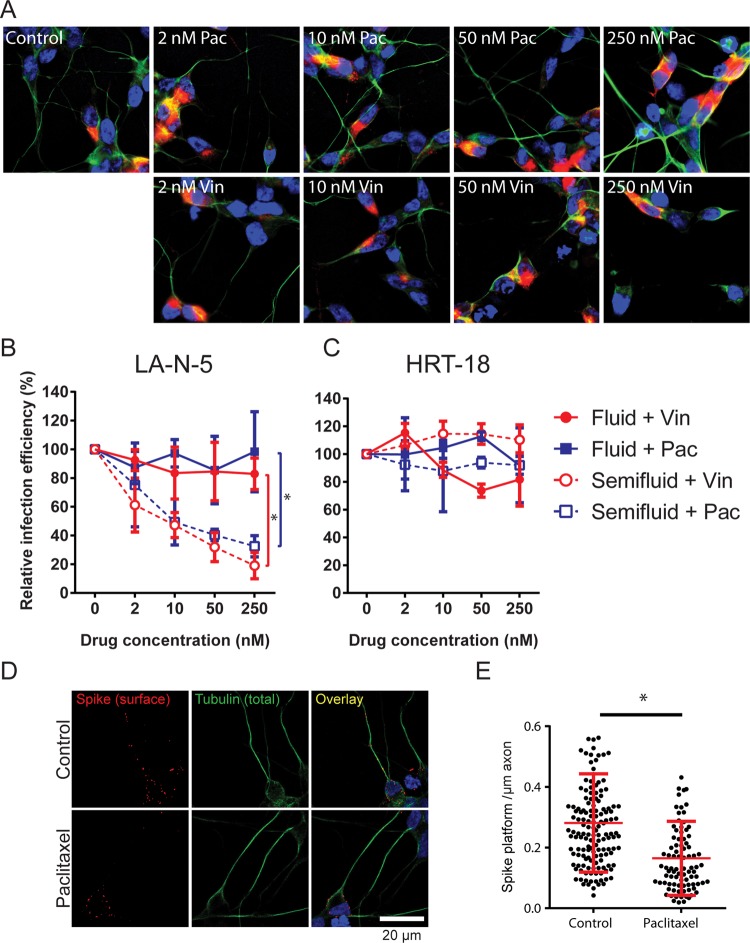
Human coronaviruses (HCoVs) are recognized respiratory pathogens for which accumulating evidence indicates that in vulnerable patients the infection can cause more severe pathologies. HCoVs are not always confined to the upper respiratory tract and can invade the central nervous system (CNS) under still unclear circumstances. HCoV-induced neuropathologies in humans are difficult to diagnose early enough to allow therapeutic interventions. Making use of our already described animal model of HCoV neuropathogenesis, we describe the route of neuropropagation from the nasal cavity to the olfactory bulb and piriform cortex and then the brain stem. We identified neuron-to-neuron propagation as one underlying mode of virus spreading in cell culture. Our data demonstrate that both passive diffusion of released viral particles and axonal transport are valid propagation strategies used by the virus. We describe for the first time the presence along axons of viral platforms whose static dynamism is reminiscent of viral assembly sites. We further reveal that HCoV OC43 modes of propagation can be modulated by selected HCoV OC43 proteins and axonal transport. Our work, therefore, identifies processes that may govern the severity and nature of HCoV OC43 neuropathogenesis and will make possible the development of therapeutic strategies to prevent occurrences.IMPORTANCE Coronaviruses may invade the CNS, disseminate, and participate in the induction of neurological diseases. Their neuropathogenicity is being increasingly recognized in humans, and the presence and persistence of human coronaviruses (HCoV) in human brains have been proposed to cause long-term sequelae. Using our mouse model relying on natural susceptibility to HCoV OC43 and neuronal cell cultures, we have defined the most relevant path taken by HCoV OC43 to access and spread to and within the CNS toward the brain stem and spinal cord and studied in cell culture the underlying modes of intercellular propagation to better understand its neuropathogenesis. Our data suggest that axonal transport governs HCoV OC43 egress in the CNS, leading to the exacerbation of neuropathogenesis. Exploiting knowledge on neuroinvasion and dissemination will enhance our ability to control viral infection within the CNS, as it will shed light on underlying mechanisms of neuropathogenesis and uncover potential druggable molecular virus-host interfaces.

Keywords: central nervous system; coronavirus; encephalitis; neuroinvasion; neuropathogenesis; neuropropagation.


Figures

FIG 1
FIG 1
HCoV OC43 neuroinvasion of the CNS initiates at the olfactory bulb. Representative histological examination (confocal imaging) of viral spreading after intranasal infection of PBS-PFA-perfused 15-day-old C57BL/6 mice with 104.25 TCID50 (10 μl) of the rOC/ATCC reference virus (6 mice were tested) was performed. Detection of viral N protein (green) at 3 (A to C) and 4 (D to F) days postinfection in the nasal cavity (region 1), the olfactory bulb (region 2), (the piriform cortex region 3), the hippocampus (region 4), and the brain stem (region 5) is shown. Blue represents cell nuclei detected with DAPI (4′,6-diamidino-2-phenylindole). Successive magnifications of the insets are shown to the right of the wide views in panels A (A → B → C) and D (D → E → F).
FIG 2
FIG 2
The olfactory bulb is the primary site of HCoV OC43 neuroinvasion. (A) Fifteen-day-old mice were inoculated with HCoV OC43 by the intracerebral (I.C.), intranasal (I.N.), or intralingual (I.L.) route. At 5 days postinoculation, the brains were harvested and the M RNA copy number was assessed by quantitative RT-PCR. Each circle represents a probed brain for a single mouse. The percentages of brains containing M RNA are shown underneath. (B) In addition to the brain, blood and livers were also collected from the same mice inoculated intranasally and probed for M RNA. (C) Mice inoculated intranasally were sacrificed after 1 to 5 days and probed for M RNA. (D) Zinc sulfate (ZnSO4) instillation 3 days before intranasal virus inoculation significantly abrogated neuroinvasion. Results are from two independent experiments. *, P < 0.05; **, P < 0.01.
FIG 3
FIG 3
HCoV OC43 spike and nucleocapsid proteins are associated with axons in vivo. Brains were collected from PFA-perfused mice 5 days after intracerebral inoculation, sagitally sectioned, and stained for either βIII-tubulin and nucleocapsid protein N (A) or spike glycoprotein and nucleocapsid (B) and then analyzed by confocal microscopy. Note that in panel B the image is a representative image taken in the hippocampal region of the brain. The insets on the right represent zoomed images of the areas delimited by the blue dotted boxes.
FIG 4
FIG 4
HCoV OC43 forms a viral platform at the surface of axons in neuronal cell culture. LA-N-5 cell (A) and murine primary mixed neuronal cell (B) cultures were infected at an MOI of 0.2 and 0.1, respectively. Fixed cells (on ice) were surface stained for spike glycoprotein using a specific polyclonal rabbit antibody, fixed again, permeabilized, stained for the axonal marker βIII-tubulin, and analyzed by confocal microscopy. (C) Surface spike was labeled on live LA-N-5 cells before fixation and then permeabilized (or not for E staining) and stained back for either total spike (using a monoclonal mouse antibody), total E, surface HE, or total N protein. The insets above or beside panels A to C represent zoomed images of the areas delimited by the blue dotted boxes.
FIG 5
FIG 5
Spike platforms on LA-N-5 axons are static along axons yet temporally dynamic. (A, B) Kinetics of spike association with axons. LA-N-5 axons were synchronously infected (MOI = 3) and then chased for the indicated time period before fixation, permeabilization, and staining for total spike using a specific monoclonal antibody. Samples were analyzed by confocal microscopy (A), and the percentage of infected cells harboring spike on their axons was then determined (B). The error bars represent the range from the means from two independent experiments. (C) Effect of the rabbit polyclonal antibody on virus propagation. LA-N-5 cells were infected at an MOI of 0.02 and cultured for 72 h in the presence of different dilutions of either a preimmune serum or the polyclonal antispike antibody. (D, E) Live cell imaging of viral platforms on axons. Infected (MOI = 0.25) LA-N-5 cells were incubated for 20 h, and then surface spike platforms (red) were immunolabeled using a polyclonal rabbit antibody followed by a red-emitting secondary antibody (Alexa Fluor 568 [AF568]). (D) Movement along the axon was assessed by live cell confocal microscopy. (E) After an hour of live cell imaging, surface spike platforms were reimmunolabeled using a specific mouse monoclonal antibody followed by a green-emitting secondary antibody (Alexa Fluor 488 [AF488]). (F) Schema representing the quantification of the fate of the platforms. (G) Ratiometric quantification of the phenomenon observed in panel E. As a control, cells were fixed immediately after the initial staining with the rabbit polyclonal antibody (red) and reimmunolabeled after the indicated time period. Red/green signal ratios were plotted from whole fields or only cell bodies or axons, as indicated. (H) Overall fluorescence decay, as observed in panel E. The absolute fluorescence signal per infected cell was plotted relative to that at time zero for each individual channel. In panels G and H, the error bars represent the standard deviation from the mean from 3 independent experiments.
FIG 6
FIG 6
HCoV OC43 sustains cell-to-cell propagation. (A) Schematic representation of the coculture system. (B, C) Propagation of HCoV OC43 in a coculture system in which two coverslips seeded with either infected cells (effector, MOI = 0.01) or naive target LA-N-5 cells (B) or HRT-18 cells (C) are placed side by side in a dish. Effector and target cells were cultured for up to 72 h postinfection. At the indicated time interval, supernatants were collected for titration of infectious virus (dotted black lines; refer to the y axis to the right) and cells were fixed and processed for immunofluorescence (colored lines; refer to the left y axis). The propagation of the infection, defined as the percentage of infected cells, was plotted separately for effector and target cells. (D to I) Cell-to-cell propagation assays. (D) HRT-18 cells were incubated with a fluid or semifluid inoculum (MOI = 1 for both) for 16 h, and infected cells were revealed by immunofluorescence. The resulting infectivity, defined as the percentage of infected cells, was normalized according to the fluid condition, which represented 100%. LA-N-5 cell cultures (E), primary mouse neuronal cell (PMNC) cultures (F), and HRT-18 cell cultures (G) were infected at an MOI of 0.01 and then overlaid with fluid or semifluid medium for 16 to 72 h. Cells were then fixed and immunostained. The propagation efficiency was plotted as the ratio between the percentage of infected cells at 72 h and the percentage of infected cells at 16 h. (H) A representative example of a wide field of infected LA-N-5 cells cultured in fluid and semifluid media. Colonies of infected cells are delimited by yellow dashed lines. (I) The percentages of infected cells in the whole field versus within colonies were compared. Error bars represent the standard deviation for the mean from 3 independent experiments (B, C, F) and 13 independent experiments (E), the range from the mean from 2 independent experiments (G), and the range from the mean for >12 fields or >40 colonies from 3 independent experiments (I).
FIG 7
FIG 7
Modulation of cell-to-cell and free virus infection. All experiments were performed using the same general procedures. LA-N-5 cells were infected, overlaid with semifluid or fluid medium with the indicated supplements, cultured for 72 h in fluid or semifluid medium, fixed, and immunostained to score the infection efficiency by immunofluorescence. Different cues were applied. (A, B) Various sialic acid-binding lectins (A) or recombinant WT HE or mutant HE S40T protein (devoid of acetylesterase function) (B) was added to the overlay medium. (C) The overlay media were supplemented with a nonneutralizing (3-2B.2) or a neutralizing (4-3E.4) monoclonal antibody, a control isotype, or preimmune rabbit serum, which served as a control for antispike serum. (D) LA-N-5 cells were seeded at 7,000 or 14,000 cells/cm2 before infection. (E) LA-N-5 cells were infected (MOI = 0.01) with various HCoV OC43 variants encoding the indicated spike mutants before the overlay medium was applied. Data were plotted as either the ratio between the infectivity for infected cells and the infectivity for the untreated controls (A to C) or between the percentage of infection at 72 h and the percentage of infection at 16 h (D and E). The error bars represent the range from the mean from two experiments (D) or the standard deviation from 3 (A to C) or 3 or 4 (E) experiments. *, P < 0.05; ns, not significant.
FIG 8
FIG 8
Axons allow neuron-to-neuron propagation. (A) LA-N-5 cells were treated with the indicated concentration of vinblastine (Vin) or paclitaxel (Pac) in fluid medium for 72 h and then stained for spike glycoprotein (red), βIII-tubulin (green), and nuclei (blue). Representative pictures taken by confocal microscopy are shown. (B, C) LA-N-5 cells (B) and HRT-18 cells were infected at an MOI of 0.01 and cultured for 72 h in fluid or semifluid medium containing the specified concentration of vinblastine or paclitaxel. Infected cells were then fixed and immunostained to determine the percentage of infection. (D, E) Effect of paclitaxel on the axonal association of spike platforms. (D) Infected LA-N-5 cells (MOI = 0.2) were treated with 250 nM paclitaxel for 20 h, fixed, and immunostained. (E) Data plotted in the graph are the amount of spike platforms per micrometer of infected axons. The error bars represent the standard deviation from the mean from 3 independent experiments (B, C) or the standard deviation for >200 individual axonal structures (E). *, P < 0.05.

References

    1. Talbot P, Jacomy H, Desforges M. 2008. Pathogenesis of human coronaviruses other than severe acute respiratory syndrome coronavirus, p 313–324. In Perlman S, Gallagher T, Snijder EJ (ed.), Nidoviruses. ASM Press, Washington, DC.
    1. Forgie S, Marrie TJ. 2009. Healthcare-associated atypical pneumonia. Semin Respir Crit Care Med 30:67–85. doi:10.1055/s-0028-1119811. - DOI - PubMed
    1. Freymuth F, Vabret A, Dina J, Cuvillon-Nimal D, Lubin C, Vaudecrane A, Guillois B, Gouarin S, Petitjean J, Lafaix-Delaire F, Brouard J. 2010. Bronchiolitis viruses. Arch Pediatr 17:1192–1201. doi:10.1016/j.arcped.2010.05.006. - DOI - PMC - PubMed
    1. Vabret A, Dina J, Brison E, Brouard J, Freymuth F. 2009. Human coronaviruses. Pathol Biol (Paris) 57:149–160. (In French.) doi:10.1016/j.patbio.2008.02.018. - DOI - PMC - PubMed
    1. Drosten C, Gunther S, Preiser W, van der Werf S, Brodt HR, Becker S, Rabenau H, Panning M, Kolesnikova L, Fouchier RA, Berger A, Burguiere AM, Cinatl J, Eickmann M, Escriou N, Grywna K, Kramme S, Manuguerra JC, Muller S, Rickerts V, Sturmer M, Vieth S, Klenk HD, Osterhaus AD, Schmitz H, Doerr HW. 2003. Identification of a novel coronavirus in patients with severe acute respiratory syndrome. N Engl J Med 348:1967–1976. doi:10.1056/NEJMoa030747. - DOI - PubMed

Publication types

LinkOut - more resources