. 2018 Jun 21;3(12):e99941.
doi: 10.1172/jci.insight.99941.

Deep phenotyping of human induced pluripotent stem cell-derived atrial and ventricular cardiomyocytes

Affiliations

Deep phenotyping of human induced pluripotent stem cell-derived atrial and ventricular cardiomyocytes

Lukas Cyganek et al. JCI Insight. .

Abstract

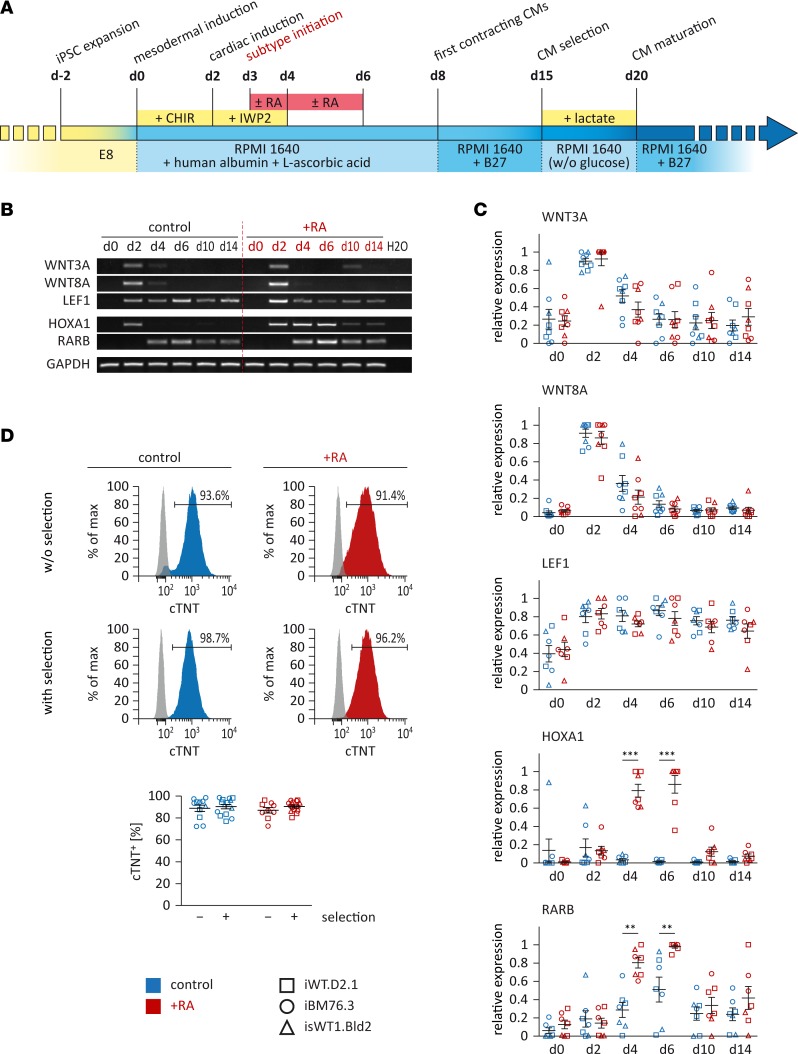
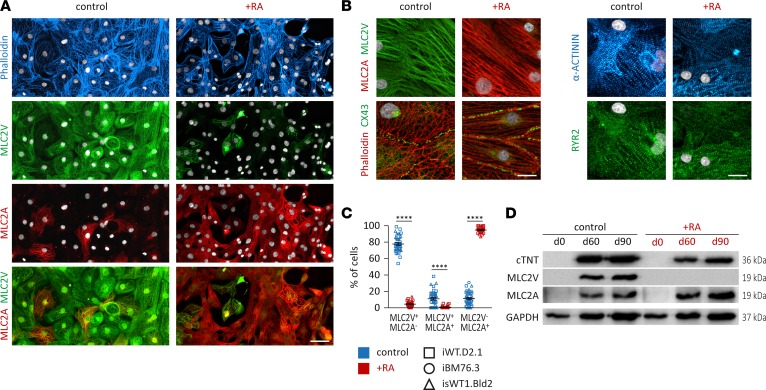
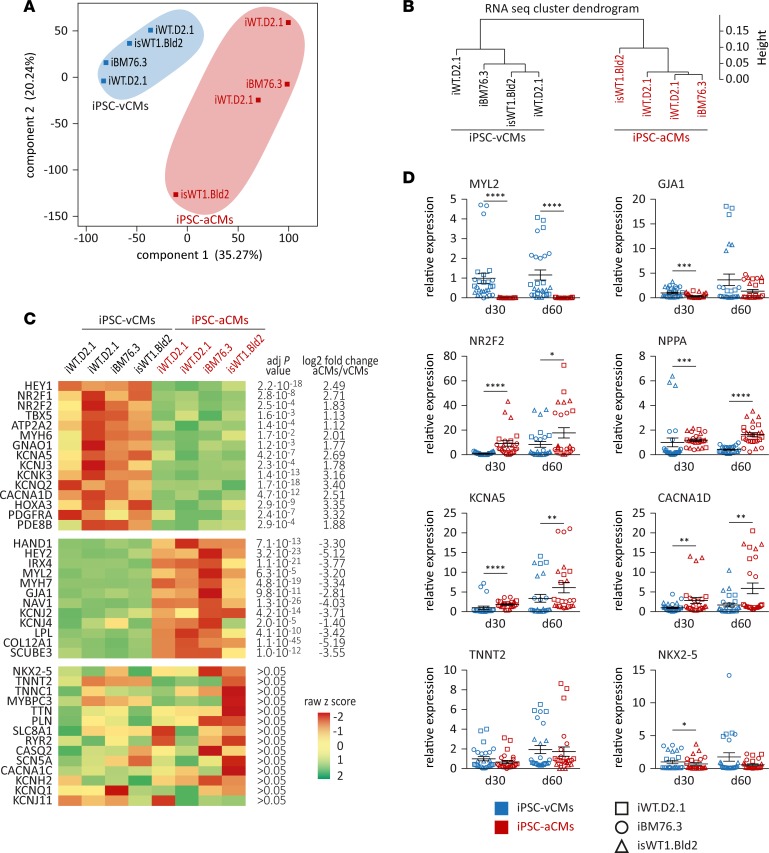
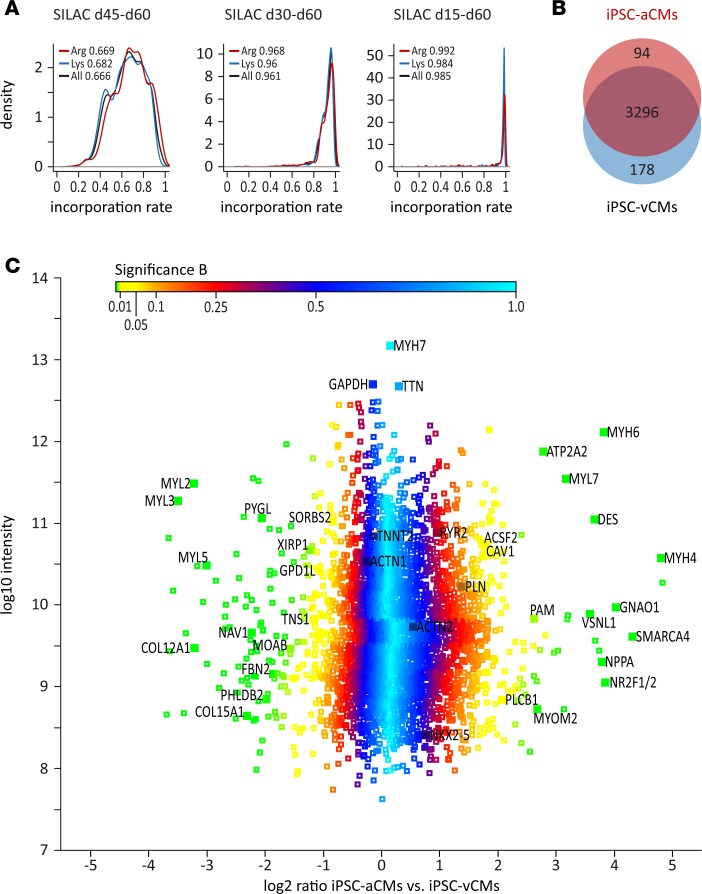
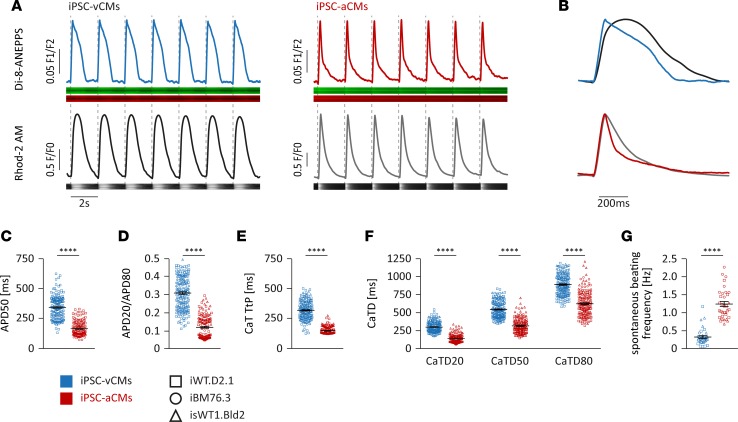
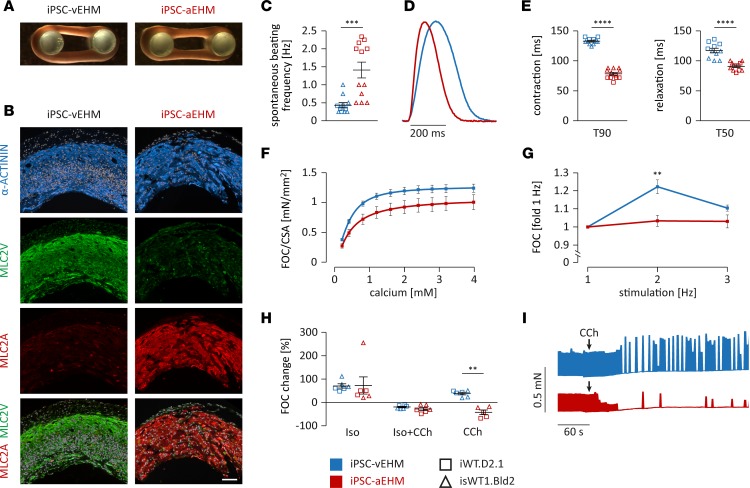
Generation of homogeneous populations of subtype-specific cardiomyocytes (CMs) derived from human induced pluripotent stem cells (iPSCs) and their comprehensive phenotyping is crucial for a better understanding of the subtype-related disease mechanisms and as tools for the development of chamber-specific drugs. The goals of this study were to apply a simple and efficient method for differentiation of iPSCs into defined functional CM subtypes in feeder-free conditions and to obtain a comprehensive understanding of the molecular, cell biological, and functional properties of atrial and ventricular iPSC-CMs on both the single-cell and engineered heart muscle (EHM) level. By a stage-specific activation of retinoic acid signaling in monolayer-based and well-defined culture, we showed that cardiac progenitors can be directed towards a highly homogeneous population of atrial CMs. By combining the transcriptome and proteome profiling of the iPSC-CM subtypes with functional characterizations via optical action potential and calcium imaging, and with contractile analyses in EHM, we demonstrated that atrial and ventricular iPSC-CMs and -EHM highly correspond to the atrial and ventricular heart muscle, respectively. This study provides a comprehensive understanding of the molecular and functional identities characteristic of atrial and ventricular iPSC-CMs and -EHM and supports their suitability in disease modeling and chamber-specific drug screening.

Keywords: Expression profiling; Muscle Biology; Proteomics; Stem cells; iPS cells.


Conflict of interest statement

Conflict of interest: WHZ is a cofounder and, together with MT, scientific advisor of Myriamed and Repairon.

Figures

Figure 1
Figure 1. Directed differentiation of iPSCs into atrial or ventricular cardiomyocytes (CMs).
(A) Schematic of the defined differentiation protocols. Small molecules CHIR and IWP2, which modulate canonical WNT signaling, were applied for the induction of iPSCs into CMs. Retinoic acid (RA) was used to induce the atrial subtype specification. Metabolic selection with lactate was applied to achieve a higher purity of iPSC-CMs. (B and C) Expression of genes involved in WNT and RA signaling was assessed by reverse transcriptase PCR analysis in control and RA-treated cells. Shown are representative images (B, iPSC line iBM76.3) and semiquantitative analysis of gene expression (C, n = 2–3 independent differentiation experiments performed for each iPSC line; 3 iPSC lines were used). Results were quantified according to intensity and normalized to GAPDH expression. (D) Flow cytometry analysis of iPSC-CMs with or without lactate selection for cardiac troponin T (cTNT). Top: Representative measurements (iPSC line iBM76.3); gray peaks represent the isotype control. Bottom: Quantitative analysis (n = 11–14 control and n = 9–15 RA-treated independent differentiation experiments from 3 iPSC lines). Data are presented as mean ± SEM. **P < 0.01, ***P < 0.001 by nonparametric Mann-Whitney U test.
Figure 2
Figure 2. Structural characterization of iPSC-derived atrial or ventricular cardiomyocytes.
(A) Immunofluorescence staining data of retinoic acid–treated (RA-treated) and untreated iPSC-derived cardiomyocyte (iPSC-CMs) cultures for F-actin (phalloidin), MLC2V, and MLC2A (iPSC line iWT.D2.1, day 86); nuclei were stained with DAPI (white). Scale bar: 50 μm. (B) Structural characterization via immunofluorescence staining for F-actin, α-actinin, MLC2V, MLC2A, gap junction protein CX43, and sarcoplasmic reticulum calcium channel RYR2 (iPSC lines iWT.D2.1 and isWT1.Bld2); nuclei were stained with DAPI (white). Scale bar: 20 μm. (C) Quantification of MLC2V+ and MLC2A+ cells in immunofluorescently stained cultures (n = 15 control and n = 11 RA-treated independent differentiation experiments from 3 iPSC lines, days 80–120). Data are presented as mean ± SEM. ****P < 0.0001 by nonparametric Mann-Whitney U test. (D) Western blot analysis for general cardiac marker cardiac troponin T (cTNT) and subtype markers MLC2V and MLC2A at days 60 and 90 (iPSC line iWT.D2.1).
Figure 3
Figure 3. Transcriptome analysis of iPSC-derived atrial or ventricular cardiomyocytes.
(A and B) Principal component analysis of component 1 versus component 2 (A) and cluster dendrogram (B) of the global gene expression data of iPSC-derived of atrial (iPSC-aCMs) and ventricular cardiomyocytes (iPSC-vCMs) at day 90 illustrate separation of the samples based on different atrial and ventricular differentiation protocols (n = 4 iPSC-vCM and n = 4 iPSC-aCM independent differentiation experiments from 3 iPSC lines). (C) Heatmap of gene expression of upregulated (upper panel) and downregulated (middle panel) genes as well as general cardiac genes (lower panel) in iPSC-aCMs compared with iPSC-vCMs. Adjusted P value and log2 fold change of the 2 groups are indicated; color code according to z raw score. (D) Real-time PCR of selected ventricular (MYL2 and GJA1) and atrial markers (NR2F2, NPPA, KCNA5, and CACNA1D) and general cardiac genes (TNNT2 and NKX2-5) at days 30 and 60 (n = 3 independent differentiation experiments with triplicates each for each iPSC line; 3 iPSC lines were used); normalized to GAPDH expression and to controls at day 30. Data are presented as mean ± SEM. *P < 0.05, **P < 0.01, ***P < 0.001, ****P < 0.0001 by nonparametric Mann-Whitney U test.
Figure 4
Figure 4. Stable-isotope labeling by amino acids in cell culture–based (SILAC-based) proteomics of iPSC-derived atrial or ventricular cardiomyocytes via quantitative mass spectrometry.
(A) Analysis of labeling efficiency of iPSC-derived atrial and ventricular cardiomyocytes (iPSC-aCMs and iPSC-vCMs) after exposure in SILAC medium for 15 days (d45–d60), 30 days (d30–d60), and 45 days (d15–d60) prior to analysis (iPSC line isWT1.Bld2); incorporation rates of heavy-labeled lysine, arginine, and mean are indicated. (B) A total of 3,568 proteins were identified in SILAC-based proteomic analysis of iPSC-CMs after exposure in SILAC medium from days 15 to 68, with 94 upregulated and 178 downregulated proteins in iPSC-aCMs compared with iPSC-vCMs (n = 4 iPSC-vCM and n = 4 iPSC-aCM independent differentiation experiments from iPSC line isWT1.Bld2, day 68). (C) Distribution of log2 protein ratios between iPSC-aCMs and iPSC-vCMs versus log10 protein intensity. Selected markers are indicated; color code according to Significance B.
Figure 5
Figure 5. Functional analysis of iPSC-derived atrial or ventricular cardiomyocytes by optical voltage and calcium recordings.
(AF) Optical voltage (di-8-ANEPPS) and calcium (Rhod-2 AM) confocal imaging of iPSC-derived atrial and ventricular cardiomyocytes (iPSC-aCMs, iPSC-vCMs) (n = 6 iPSC-vCM and n = 4 iPSC-aCM independent differentiation experiments from 3 iPSC lines, days 94–141); paced at 0.5 Hz. (A) Representative plots of action potentials (APs) (upper panel) and calcium transients (CaTs) (lower panel) of a single cell with original voltage-sensitive dye and calcium dye recordings below (iPSC line iWT.D2.1, days 94 and 115). (B) Overlap of normalized APs (blue, red) and CaTs (black, gray) of a single cell displays typical subtype-specific AP and CaT morphology. (C and D) AP duration at 50% repolarization (APD50) and ratio of APD20 to APD80 (n = 184 iPSC-vCMs and n = 148 iPSC-aCMs). (E and F) CaT rise time (time to peak, TtP) and CaT duration at 20% (CaTD20), 50% (CaTD50), and 80% (CaTD80) decay (n = 183 iPSC-vCMs and n = 170 iPSC-aCMs). (G) Analysis of spontaneous beating frequency of iPSC-CM cultures (n = 16 iPSC-vCM and n = 14 iPSC-aCM independent differentiation experiments from 3 iPSC lines, days 60–97). Data are presented as mean ± SEM. ****P < 0.0001 by nonparametric Mann-Whitney U test (CG).
Figure 6
Figure 6. Morphological and functional analysis of iPSC-derived atrial or ventricular engineered heart muscle.
(A) Macroscopic appearance of iPSC-derived atrial and ventricular engineered heart muscle (iPSC-aEHM and iPSC-vEHM; iPSC line iWT.D2.1). (B) Immunofluorescence staining of iPSC-EHM cross sections for cardiac marker α-actinin, MLC2V, and MLC2A (iPSC line isWT1.Bld2); nuclei were stained with DAPI (white). Scale bar: 100 μm. (CG) Functional analysis of iPSC-EHM at half-maximal effective concentration (EC50) for calcium and paced at 2 Hz, if not indicated otherwise (n = 11 iPSC-vEHM and n = 12 iPSC-aEHM from iPSC lines iWT.D2.1 and isWT1.Bld2). (C) Analysis of spontaneous beating frequency of iPSC-EHM. (D and E) Representative normalized contraction curves of iPSC-EHM and analysis of time to 90% of contraction (T90) and time to 50% of relaxation (T50). (F) Analysis of force of contraction (FOC) in relation to cross-sectional area (CSA) of iPSC-EHM in response to increasing extracellular calcium from 0.2–4 mM. (G) Analysis of force-frequency response of iPSC-EHM to increasing stimulation frequencies normalized to individual EHM at 1 Hz. (H and I) Pharmacological treatment of iPSC-EHM at EC50 calcium concentration and paced at 2 Hz, if not indicated otherwise (n = 6 iPSC-vEHM and n = 6 iPSC-aEHM from iPSC lines iWT.D2.1 and isWT1.Bld2). (H) Change of FOC in iPSC-EHM in response to acute stimulation with 1 μM isoprenaline (Iso), 1 μM Iso and 10 μM carbachol (CCh), or 10 μM CCh only. (I) Representative recordings from spontaneous iPSC-EHM contractions over time before and after stimulation with 10 μM CCh (indicated by arrow at 60 seconds). Data are presented as mean ± SEM. **P < 0.01, ***P < 0.001, ****P < 0.0001 by nonparametric Mann-Whitney U test (C, E, and H) or by 2-way ANOVA with Sidak’s correction (F and G).

References

    1. Savla JJ, Nelson BC, Perry CN, Adler ED. Induced pluripotent stem cells for the study of cardiovascular disease. J Am Coll Cardiol. 2014;64(5):512–519. doi: 10.1016/j.jacc.2014.05.038. - DOI - PubMed
    1. Sayed N, Liu C, Wu JC. Translation of human-induced pluripotent stem cells: from clinical trial in a dish to precision medicine. J Am Coll Cardiol. 2016;67(18):2161–2176. doi: 10.1016/j.jacc.2016.01.083. - DOI - PMC - PubMed
    1. Cyganek L, Chen S, Borchert T, Guan K. Cardiac progenitor cells and their therapeutic application for cardiac repair. J Clin Exp Cardiolog. 2013;S11:008
    1. Kolanowski TJ, Antos CL, Guan K. Making human cardiomyocytes up to date: Derivation, maturation state and perspectives. Int J Cardiol. 2017;241:379–386. doi: 10.1016/j.ijcard.2017.03.099. - DOI - PubMed
    1. Harvey RP. Patterning the vertebrate heart. Nat Rev Genet. 2002;3(7):544–556. doi: 10.1038/nrg843. - DOI - PubMed

Publication types

MeSH terms