. 2018 Jun 20;9(1):2416.
doi: 10.1038/s41467-018-04717-4.

C-terminal truncation of IFN-γ inhibits proinflammatory macrophage responses and is deficient in autoimmune disease

Affiliations

C-terminal truncation of IFN-γ inhibits proinflammatory macrophage responses and is deficient in autoimmune disease

Antoine Dufour et al. Nat Commun. .

Abstract

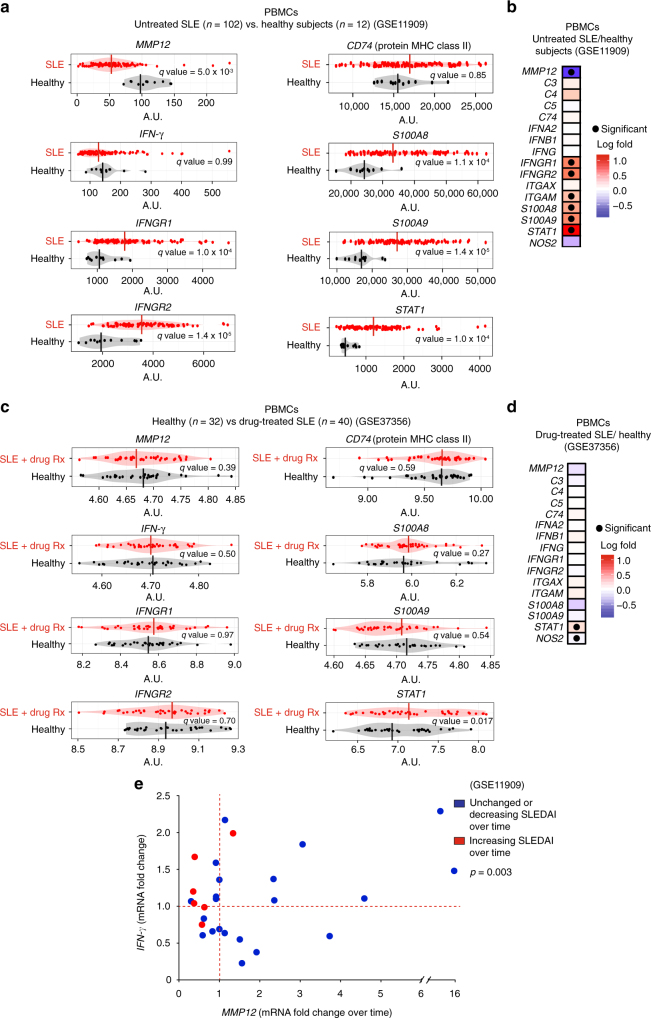
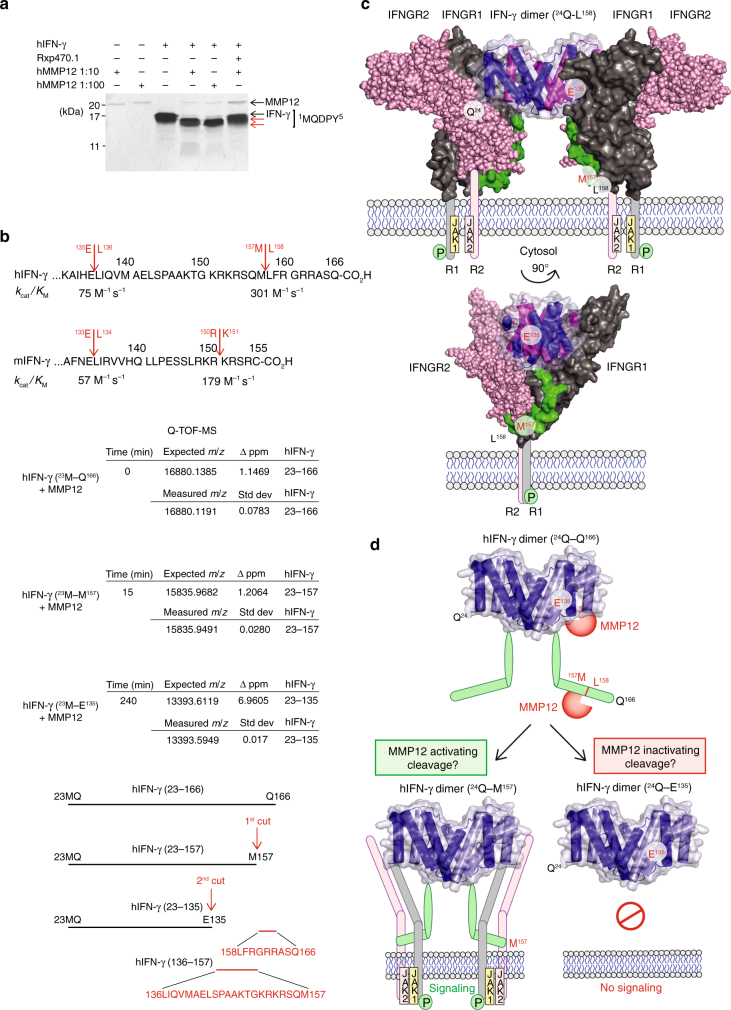
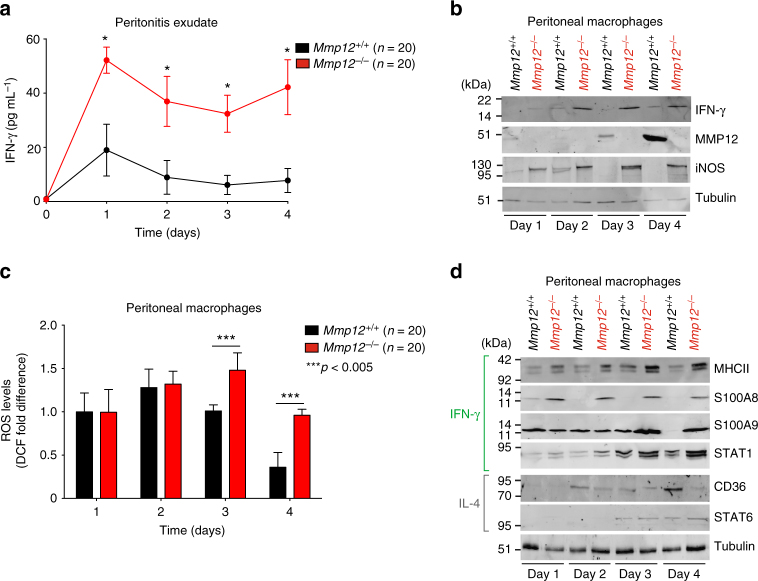
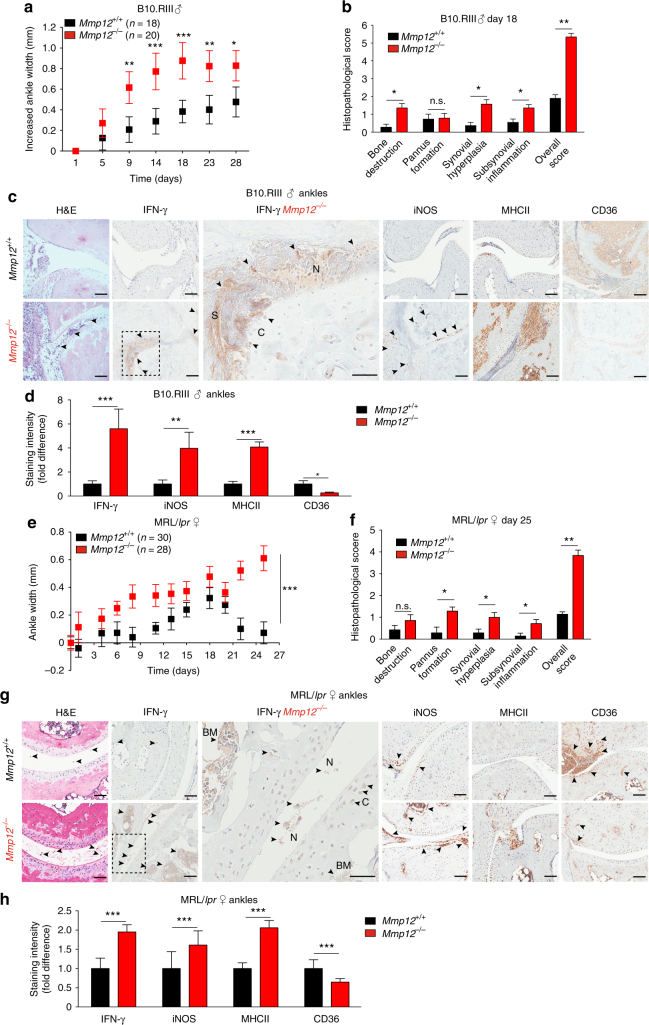
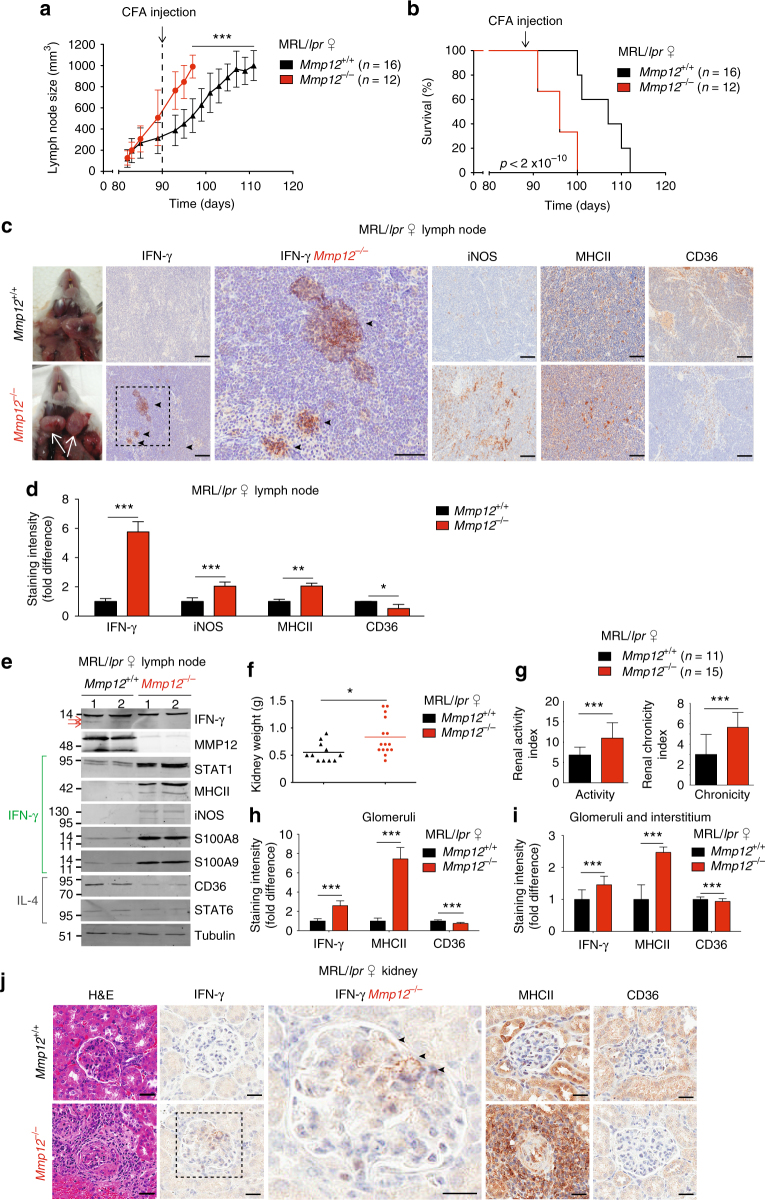
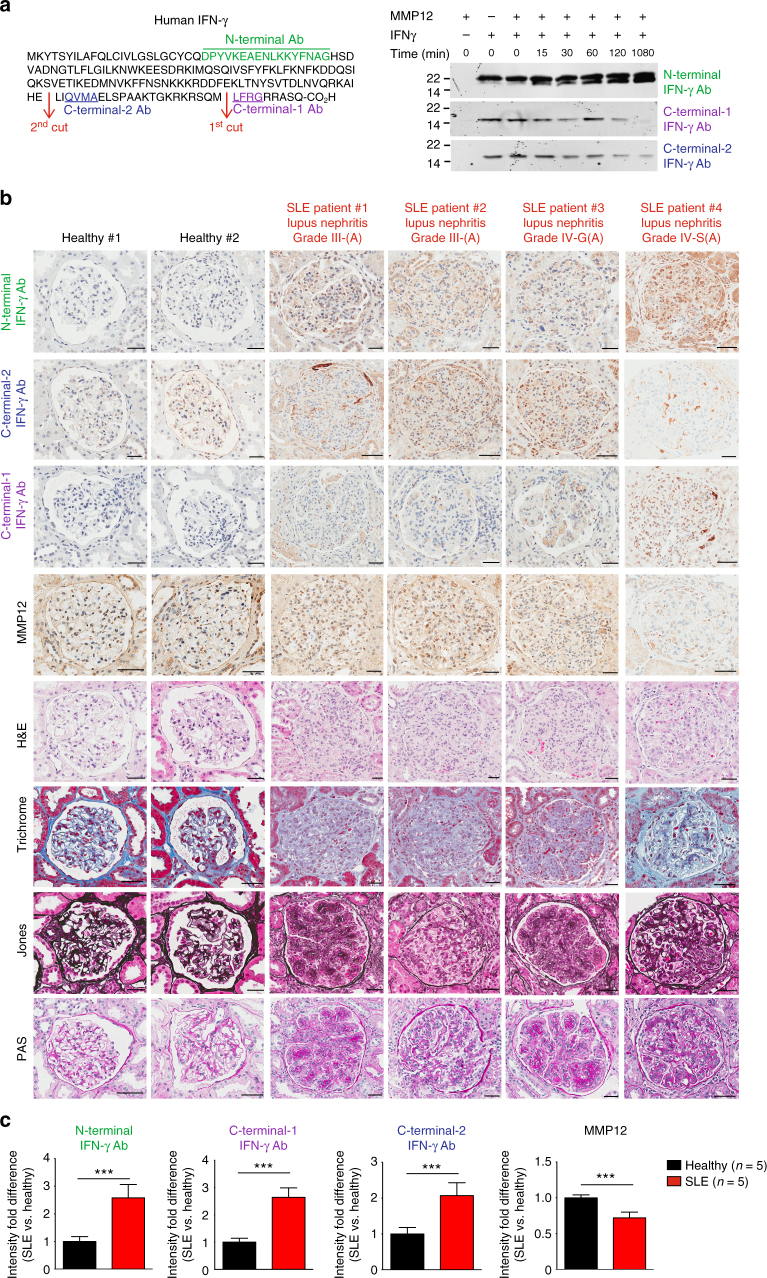
Controlled macrophage differentiation and activation in the initiation and resolution of inflammation is crucial for averting progression to chronic inflammatory and autoimmune diseases. Here we show a negative feedback mechanism for proinflammatory IFN-γ activation of macrophages driven by macrophage-associated matrix metalloproteinase 12 (MMP12). Through C-terminal truncation of IFN-γ at 135Glu↓Leu136 the IFN-γ receptor-binding site was efficiently removed thereby reducing JAK-STAT1 signaling and IFN-γ activation of proinflammatory macrophages. In acute peritonitis this signature was absent in Mmp12 -/- mice and recapitulated in Mmp12 +/+ mice treated with a MMP12-specific inhibitor. Similarly, loss-of-MMP12 increases IFN-γ-dependent proinflammatory markers and iNOS+/MHC class II+ macrophage accumulation with worse lymphadenopathy, arthritic synovitis and lupus glomerulonephritis. In active human systemic lupus erythematosus, MMP12 levels were lower and IFN-γ higher compared to treated patients or healthy individuals. Hence, macrophage proteolytic truncation of IFN-γ attenuates classical activation of macrophages as a prelude for resolving inflammation.


Conflict of interest statement

The authors declare no competing interests.

Figures

Fig. 1
Fig. 1
Human PBMC MMP12 and IFN-γ response gene mRNAs in SLE. a PMBC mRNA levels and b quantification of MMP12, C3, C4, C5, CD74, IFNA2, IFNB1, IFNG, IFNGR1, IFNGR2, ITGAM, ITGAX S100A8, S100A9, STAT1, and NOS2 mRNAs in SLE patients (n = 102) or healthy control subjects (n = 12) in the GSE11909 transcript dataset. Vertical bars are the mean values in all bean plots. c Comparison of these mRNA levels in PBMCs of drug-treated SLE patients (n = 40) or healthy control subjects (n = 32) in the GSE37356 mRNA dataset. Statistical significance in b and d was determined by calculating the q-values in a and in c. e Longitudinal comparison (31 time points) in 20 individual subjects of the fold changes of MMP12 and IFNG PBMC mRNA levels upon clinical deterioration (increasing SLEDAI in individual patients over time, n = 7 time points), or upon clinical improvement (unchanged or decreasing SLEDAI in individual patients over time, n = 24 time points). Patient information (ethnicity, gender, age, SLEDAI and drug treatment or not) from GSE11909 is in Supplementary Tables S4-S5. Statistical significance was determined by a two-tailed paired Student’s t-test: p = 3 × 10−3
Fig. 2
Fig. 2
MMP12 cleaves IFN-γ removing the IFN-γ receptor-binding site. a Silver stained 15% SDS-PAGE analysis of in vitro cleavage of human (h) IFN-γ by 10 or 100 ng hMMP12 catalytic domain at 1:10 and 1:100 enzyme to substrate ratios, incubated over 18 h at 37 °C. Revealing C-terminal cleavage, N-terminal sequencing identified an intact N-terminus commencing at 1MQDPY both in IFN-γ and in the two cleavage products (red arrows). The MMP12-specific inhibitor, Rxp470.1, blocked IFN-γ cleavage and autocatalytic cleavage of MMP12 resulting in stabilized MMP12 protein levels over 18 h. Molecular weight marker positions are shown. b Q-TOF-MS analysis of IFN-γ cleavage reaction products revealed C-terminal cleavage first between 157Met↓Leu158 and then at 135Glu↓Leu136 (see Supplementary Fig. 4). The kcat/KM values calculated for each cleavage event in human and mouse (m) IFN-γ are shown. c Based on the crystal structures of the IFN-γ homodimer (pdb entry: 1HIG), , a secondary complex consisting of the IFN-γ dimer, two high-affinity IFN-γ receptor 1 molecules (IFNGR1(pdb entry: 1FG9); 29Val-Ser241; dark gray), and two low affinity IFN-γ receptor 2 chains (IFNGR2 (pdb entry: 1FYH); 30Leu-Thr237; light pink) were modeled. The IFN-γ C-terminal peptide (135Glu–158Leu) responsible for IFN-γ receptor interaction and signaling was modeled (green). The transmembrane peptide and JAK1/2 are shown in cartoon form. d Frontal view of the structured region of the IFN-γ homodimer with the C-terminal non-structured flexible region (from 146Ala to Gln166) cartooned in green. The two MMP12 cleavage sites are shown: 157Met↓Leu158 and 135Glu↓Leu136
Fig. 3
Fig. 3
MMP12 decreases IFN-γ-activated macrophage markers in acute peritonitis. a ELISA of IFN-γ protein levels in peritoneal exudate of male Mmp12+/+ B10.RIII (n = 20) and Mmp12–/– B10.RIII (n = 20) mice at days 0–4 after induction of peritonitis (n = 4 for each genotype for each time point, N = 2) expressed as the mean ± s.d. There was no IFN-γ quantified in healthy peritoneum in the absence of inflammation on day 0. Statistical significance was determined by two-tailed unpaired Student’s t-test: *p < 0.05. b 10% SDS-PAGE western blot analysis of IFN-γ, MMP12, and iNOS proteins in primary peritoneal macrophages harvested daily from Mmp12+/+ (n = 20) and Mmp12–/– (n = 20) B10.RIII mice (N = 2). Tubulin, loading control. c Cellular ROS levels in primary peritoneal macrophages were quantified by calculating the mean fluorescence intensity after treatment with 2,-7-dichlorofluorescein diacetate (DCF) (n = 20 for each genotype, n = 4 for each time point, N = 2). Data were normalized to day 1 Mmp12+/+ B10.RIII macrophages and expressed as fold differences. Error bars, s.d. Statistical significance was determined by a two-tailed unpaired Student’s t-test: ***p < 0.005. d 10% SDS-PAGE western blot analysis of markers characteristic for macrophage activation by IFN-γ (MHCII, S100A8, and S100A9) and STAT1, or by IL-4 (CD36) and STAT6 in Mmp12+/+ and Mmp12–/– B10.RIII mouse macrophages harvested daily (n = 20 for each genotype, n = 4 for each time point, N = 2). Tubulin, loading control. Molecular weight marker positions in all blots are as shown
Fig. 4
Fig. 4
MMP12 reduces IFN-γ signaling and responses in macrophages. a Mouse RAW264.7 cells were treated for 15 min or 24 h with PBS, 20 ng/mL mouse IFN-γ, 20 ng/mL mouse IFN-γ pre-incubated with 2 ng/mL mouse MMP12 (37 °C, 18 h), 2 ng/mL mouse MMP12 alone, or 30 ng/mL mouse IL-4 (n = 4, N = 2). After 10% SDS-PAGE, cell lysates were western blotted for pSTAT1-Y701 and STAT1 proteins (Supplementary Fig. 7b). b Western blot of iNOS protein in RAW264.7 cells treated as above for 24 h (n = 4, N = 2). ROS levels were quantified by calculating the mean fluorescence intensity after treatment with 2-,7-dichlorofluorescein diacetate (DCF)(n = 4, N = 2). Data were normalized to PBS-treated cells and expressed as fold differences. Error bars denote s.d. Statistical significance was determined by a two-tailed unpaired Student’s t-test: *p < 0.05; **p < 0.01; ***p < 0.005. c, d Western blotting, quantification, and statistical analyses of pSTAT1-Y701, STAT1, and iNOS protein in human THP-1 cells as described for a and b (n = 4, N = 2) (see also Supplementary Fig. 7a). Tubulin and molecular weight marker positions are shown. e Representative images and f phagocytic index of THP-1 macrophages incubated for 24 h with PBS, 30 ng/mL IL-4, 20 ng/mL IFN-γ, or 20 ng/mL IFN-γ pretreated with 2 ng/mL human MMP12 (37 °C, 18 h), or 2 ng/mL MMP12 alone, and then incubated with serum-coated fluorescent 2-μm microparticles. Scale bars, 20 μm. The phagocytic index was quantified from the number of beads per cell (5–30 cells per field) in each of 20 fields (n = 3, N = 2). Data were normalized to PBS-treated THP-1 macrophages and the means expressed as fold differences. Error bars, s.d. Statistical significance was determined by a two-tailed unpaired Student’s t-test: ***p < 0.005. g MMP12 mRNA analysis of PMA-matured THP-1 cells treated with PBS, IFN-γ, or IL-4 (n = 3, N =2). A-values were normalized to IFN-γ-induced THP-1 cell mean values and expressed as fold differences. Error bars, s.d. Statistical significance was determined by a two-tailed unpaired Student’s t-test: NS not significant difference; ***p = 1 × 10−5
Fig. 5
Fig. 5
Altered macrophage markers in rheumatoid arthritis in Mmp12–/– mice. a Hind ankle widths of Mmp12+/+ and Mmp12–/– male B10.RIII mice (n = 18 and 20, respectively, for each time point) after onset of collagen-induced arthritis (day 0), means ± s.e.m. Mann–Whitney t-test: *p < 0.05, **p < 0.01, ***p < 0.005. b Histopathology of hind ankles after H&E staining (day 18) Mmp12+/+ (n = 3) and Mmp12–/– (n = 3). Bone destruction (p < 6 × 10−5), pannus formation (NS not significant), synovial hyperplasia (p < 3 × 10−5), and subsynovial inflammation (p < 7 × 10−4) were quantified as a histopathological score (p < 9 × 10−4, means ± s.d.), two-tailed unpaired Student’s t-test: *p < 0.05, **p < 0.01. c Representative images of H&E, IFN-γ, iNOS, MHCII, and CD36 immunostaining of hind ankle joints of Mmp12+/+ (n = 3) and Mmp12–/– (n = 3) mice. Here and in g: N NETs; C cartilage; S synovial space; arrowheads, high antibody or H&E staining; scale bars, 100 μm. d Immunostaining quantification of Mmp12+/+ versus Mmp12–/– male B10.RIII mice hind ankle joints for IFN-γ (p < 2 × 10−5), iNOS (p < 1 × 10−3), MHCII (p < 2 × 10−5), and CD36 (p < 2 × 10−2) (means ± s.d.), two-tailed unpaired Student’s t-test: *p < 0.05, **p < 0.01, ***p < 0.005. e Ninety-day-female MRL/lpr mice were injected with CFA (day 0). Hind ankle size was measured in Mmp12+/+and Mmp12–/– MRL/lpr mice (n = 30 and 28, respectively, for each time point) (means ± s.d.), two-tailed unpaired Student’s t-test: ***p < 0.005. f Histopathology of H&E stained-hind ankle joints of Mmp12+/+ (n = 3) and Mmp12–/– (n = 3) MRL/lpr (day 25). Bone destruction (n.s.), pannus formation (p < 0.01), synovial hyperplasia (p < 3 × 10−2), and subsynovial inflammation (p < 3 × 10−2) were quantified as the histopathological score (p < 6 × 10−3) (means ± s.d.), two-tailed unpaired Student’s t-test: *p < 0.05, **p < 0.01. g Representative images of H&E, IFN-γ, iNOS, MHCII, and CD36 immunostaining of hind ankle joints of Mmp12+/+ and Mmp12–/– MRL/lpr female mice. BM bone marrow. h Immunostaining intensities of Mmp12+/+ and Mmp12–/– mouse hind ankle joints for IFN-γ (p < 2 × 10−5), iNOS (p < 1 × 10−3), MHCII (p < 4 × 10−4), and CD36 (p < 4 × 10−4) (means ± s.d.), two-tailed unpaired Student’s t-test: ***p < 0.005
Fig. 6
Fig. 6
Mmp12–/– mouse mortality and IFN-γ macrophages numbers in SLE. a Following CFA injection, the size of the superficial cervical lymph nodes of Mmp12+/+ and Mmp12–/– MRL/lpr (n = 16 and 12, respectively, for each time point) female mice were measured and expressed as means ± s.d. Two-tailed unpaired Student’s t-test: ***p < 0.005. b Kaplan–Meier curves showing mortality rates of female Mmp12+/+ MRL/lpr (n = 16) and Mmp12–/– (n = 12) mice. Two-tailed unpaired Student’s t-test: p < 2 × 10−10, (see Supplementary Fig. 9c, d for survival data). c Representative images of superficial cervical lymph nodes (white arrows) immunostained for IFN-γ, iNOS, MHCII, and CD36 from Mmp12+/+ (n = 3) and Mmp12–/– (n = 3) female MRL/lpr mice at their humane end points (Mmp12+/+ (day 112) and Mmp12–/– (day 98)). Scale bars, 100 μm. d Quantification of immunostaining intensities of Mmp12+/+ (n = 3) versus Mmp12–/– (n = 3) MRL/lpr mice superficial cervical lymph nodes for IFN-γ (p < 9 × 10−6), iNOS (p < 2 × 10−7), MHCII (p < 1 × 10−2), and CD36 (p < 2 × 10−2) expressed as the mean ± s.d. Two-tailed unpaired Student’s t-test: *p < 0.05, **p < 0.01, ***p < 0.005. e Superficial cervical lymph nodes were analyzed by western blotting for macrophages markers of IFN-γ activation (iNOS, MHCII, S100A8, and S100A9) and STAT1, as well as for IL-4 induced CD36 and STAT6. Two biological replicates analyses from Mmp12+/+ (n = 8) and Mmp12–/– (n = 8) MRL/lpr mice, are shown. Red arrows indicate lower molecular forms of IFN-γ. f Mean kidney weights and g mean histological scores of activity and chronicity indexes from Mmp12+/+ (n = 11) and Mmp12–/– MRL/lpr (n = 15) mice were measured at their humane end points. Error bars, s.d. Two-tailed unpaired Student’s t-test: *p < 0.05, ***p < 0.005. Quantification of immunostaining in h glomeruli and i in glomeruli and interstitium of Mmp12+/+ (n = 3) and Mmp12–/– MRL/lpr (n = 3) mice at their humane end points for IFN-γ (p < 2 × 10−12), MHCII (p < 7 × 10−17), and CD36 (p < 2 × 10−6). Quantification is expressed as means ± s.d. Two-tailed unpaired Student’s t-test: ***p < 0.005. j Representative images of H&E, IFN-γ, MHCII, and CD36 immunostaining of the renal glomeruli sections of Mmp12+/+ and Mmp12–/– female MRL/lpr mice; arrowheads, strong IFN-γ staining. Scale bars, 100 μm
Fig. 7
Fig. 7
IFN-γ epitope antibody staining of human lupus nephritis biopsies. a Left, amino acid sequences (underlined) of human IFN-γ peptides used to raise and affinity-purify rabbit anti–N-terminal, C-terminal-1, and C-terminal-2 IFN-γ epitope antibodies. Right, western blot analysis of human IFN-γ after time-dependent cleavage to 1080 min by human MMP12. Note: disappearance of the C-terminal epitopes as MMP12 cleavage proceeds. Molecular weight marker positions in all blots are as shown. b Immunostaining of human kidney biopsies using anti–N-terminal, C-terminal-2, C-terminal-1, and MMP12 antibodies; and staining with hematoxylin and eosin (H&E), Trichrome, Jones, and PAS of kidney biopsies of healthy (n = 5), lupus nephritis at Grades III-(A) (n = 3) and IV-(A) (n = 2) as diagnosed in Supplementary Fig. 11. Scale bar, 100 μm. Original magnification, ×400. c Quantification of immunostaining intensities in healthy (n = 5) and lupus nephritis (n = 5) kidney biopsies (additional data are included in Supplementary Fig. 11) and expressed as means ± s.d. Statistical significance was determined by a two-tailed unpaired Student’s t-test: ***p < 0.005
Fig. 8
Fig. 8
Prolonged IFN-γ signaling in Mmp12–/– primary peritoneal macrophages. Western blot analysis for pSTAT1-Y701 and STAT1 in primary peritoneal macrophages harvested from individual (a, e) Mmp12+/+ B10.RIII (n = 5 for each time point) and (b, d) Mmp12–/– B10.RIII (n = 4 for each time point) mice 4 days after induction of peritonitis. Cells were treated with 20 ng/mL of IFN-γ for 0–1080 min. c Ratios of pSTAT1-Y701 to STAT1 protein levels were determined after densitometry quantification of the western blots. The data are expressed as fold differences in the ratio of the means for Mmp12+/+ (n = 5 for each time point) and Mmp12–/– (n = 4 for each time point) B10.RIII mice. d Rescue of Mmp12–/– peritoneal macrophages with recombinant mouse MMP12 protein (1:100) incubated for the times shown (n = 4 for each time point). e Mmp12+/+ B10.RIII macrophages were incubated for 30 min with 100 nm specific MMP12 inhibitor Rxp470.1 before addition of 20 ng/mL IFN-γ (n = 4 for each time point). f Western blot analysis of IFN-γ, MMP12, iNOS, MHCII, S100A8, S100A9, STAT1, CD36, and STAT6 proteins in primary peritoneal macrophages harvested from Mmp12+/+ (n = 4) and Mmp12–/– (n = 4) B10.RIII mice at day 4 post-intraperitoneal injection with vehicle; and Mmp12+/+ B10.RIII mice treated daily with 5 mg/kg Rxp470.1 (n = 4) for 4 days during the induction of peritonitis. Actin or tubulin loading controls and molecular weight marker positions in all blots are as shown

Comment in

  • MMP12 makes the cut.
    Collison J. Collison J. Nat Rev Rheumatol. 2018 Sep;14(9):501. doi: 10.1038/s41584-018-0056-y. Nat Rev Rheumatol. 2018. PMID: 30022107 No abstract available.

References

    1. Wynn TA, Chawla A, Pollard JW. Macrophage biology in development, homeostasis and disease. Nature. 2013;496:445–455. doi: 10.1038/nature12034. - DOI - PMC - PubMed
    1. Mosser DM, Edwards JP. Exploring the full spectrum of macrophage activation. Nat. Rev. Immunol. 2008;8:958–969. doi: 10.1038/nri2448. - DOI - PMC - PubMed
    1. Schroder K, Hetzog JP, Ravasi T, Hume AD. Interferon-γ: an overview of signals, mechanisms and functions. J. Leukoc. Biol. 2004;75:163–189. doi: 10.1189/jlb.0603252. - DOI - PubMed
    1. Hu X, Ivashkiv LB. Cross-regulation of signaling pathways by interferon-gamma: implications for immune responses and autoimmune diseases. Immunity. 2009;31:539–550. doi: 10.1016/j.immuni.2009.09.002. - DOI - PMC - PubMed
    1. Murray PJ, et al. Macrophage activation and polarization: nomenclature and experimental guidelines. Immunity. 2014;41:14–20. doi: 10.1016/j.immuni.2014.06.008. - DOI - PMC - PubMed

Publication types

MeSH terms