. 2018 Jun 20;8(1):9399.
doi: 10.1038/s41598-018-27589-6.

Genome-Wide Survey and Comparative Analysis of Long Terminal Repeat (LTR) Retrotransposon Families in Four Gossypium Species

Affiliations

Genome-Wide Survey and Comparative Analysis of Long Terminal Repeat (LTR) Retrotransposon Families in Four Gossypium Species

Zhen Liu et al. Sci Rep. .

Abstract

Long terminal repeat (LTR) retrotransposon is the most abundant DNA component and is largely responsible for plant genome size variation. Although it has been studied in plant species, very limited data is available for cotton, the most important fiber and texture crop. In this study, we performed a comprehensive analysis of LTR retrotransposon families across four cotton species. In tetraploid Gossypium species, LTR retrotransposon families from the progenitor D genome had more copies in D-subgenome, and families from the progenitor A genome had more copies in A-subgenome. Some LTR retrotransposon families that insert after polyploid formation may still distribute the majority of its copies in one of the subgenomes. The data also shows that families of 10~200 copies are abundant and they have a great influence on the Gossypium genome size; on the contrary, a small number of high copy LTR retrotransposon families have less contribution to the genome size. Kimura distance distribution indicates that high copy number family is not a recent outbreak, and there is no obvious relationship between family copy number and the period of evolution. Further analysis reveals that each LTR retrotransposon family may have their own distribution characteristics in cotton.


Conflict of interest statement

The authors declare no competing interests.

Figures

Figure 1
Figure 1
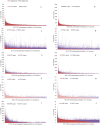
Comparison of LTR retrotransposon families between Gossypium genome.
Figure 2
Figure 2
Copy number differences of the same family in different species.
Figure 3
Figure 3
Copy number distribution in A- and D-subgenomes of the tetraploid genomes.
Figure 4
Figure 4
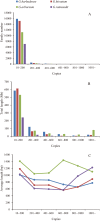
Family number, total length and average length of different copy number LTR retrotransposon families.
Figure 5
Figure 5
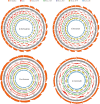
LTR retrotransposon family elements and gene density of Gossypium chromosomes in 2 Mb unit. The outermost ring is the density of all LTR retrotransposon families elements, after the chromosome ring, followed by RLGy_42738 family, RLCo_3154 family, RLCo_5655 family, RLGy_42774 family and RLCo_258 family.
Figure 6
Figure 6
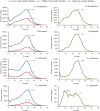
Kimura distance distribution of LTR retrotransposon. The graphs represent element number (y axis) for high copy number families (>800 copies), middle copy number families (201~800) and low copy number families (10~200) in Gossypium genomes (x axis, K-value from 0 to 60). Due to the large difference, high copy number families was separated from middle copy number families and low copy number families.

Similar articles

Cited by

References

    1. Oliver KR, McComb JA, Greene WK. Transposable elements: powerful contributors to angiosperm evolution and diversity. Genome Biol Evol. 2013;5:1886–1901. doi: 10.1093/gbe/evt141. - DOI - PMC - PubMed
    1. Wicker T, et al. A unified classification system for eukaryotic transposable elements. Nat Rev Genet. 2007;8:973–982. doi: 10.1038/nrg2165. - DOI - PubMed
    1. Elliott TA, Gregory TR. What’s in a genome? The C-value enigma and the evolution of eukaryotic genome content. Philos Trans R Soc Lond B Biol Sci. 2015;370:20140331. doi: 10.1098/rstb.2014.0331. - DOI - PMC - PubMed
    1. Vitte C, Panaud O. LTR retrotransposons and flowering plant genome size: emergence of the increase/decrease model. Cytogenet Genome Res. 2005;110:91–107. doi: 10.1159/000084941. - DOI - PubMed
    1. Schnable PS, et al. The B73 maize genome: complexity, diversity, and dynamics. Science. 2009;326:1112–1115. doi: 10.1126/science.1178534. - DOI - PubMed

Publication types

LinkOut - more resources