. 2018 Jun 20;9(1):2419.
doi: 10.1038/s41467-018-04724-5.

Spatial maps of prostate cancer transcriptomes reveal an unexplored landscape of heterogeneity

Affiliations

Spatial maps of prostate cancer transcriptomes reveal an unexplored landscape of heterogeneity

Emelie Berglund et al. Nat Commun. .

Abstract

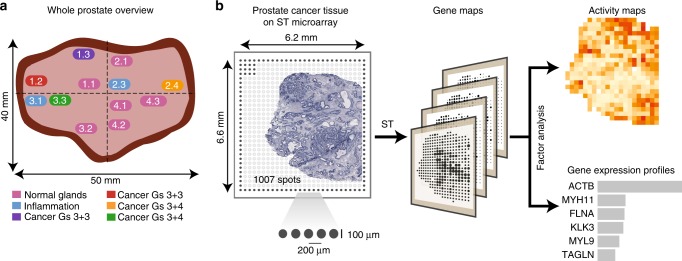
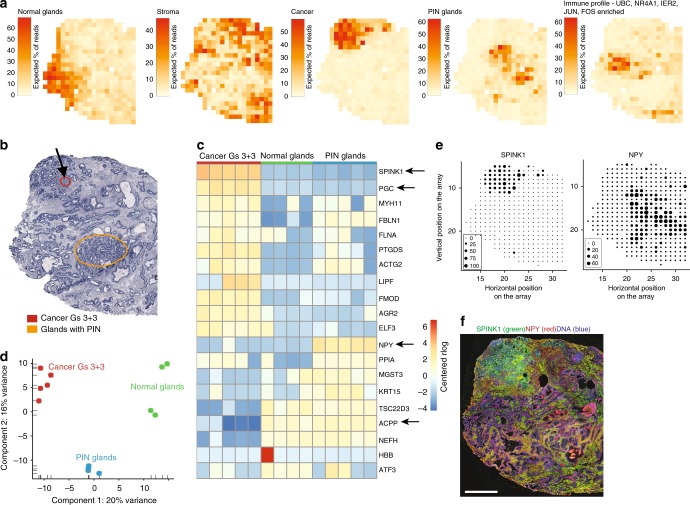
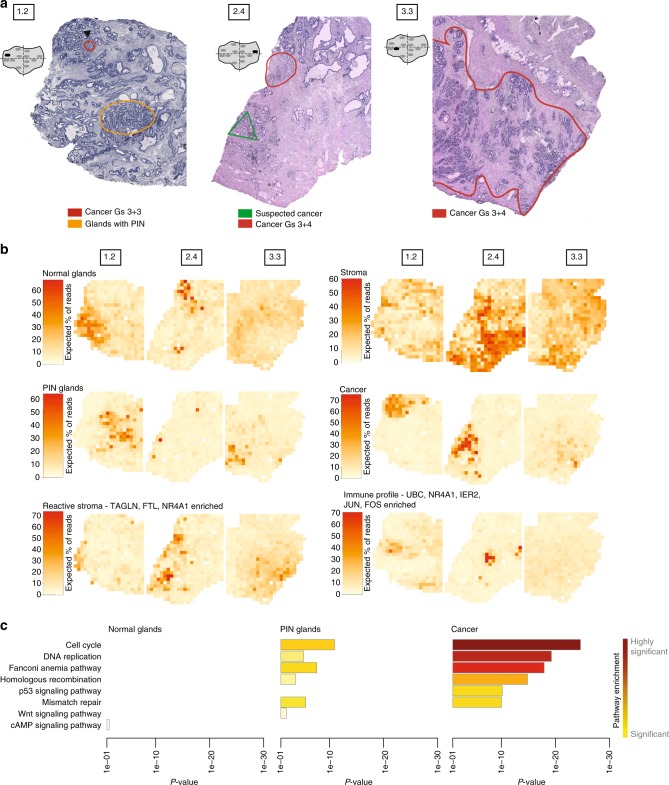
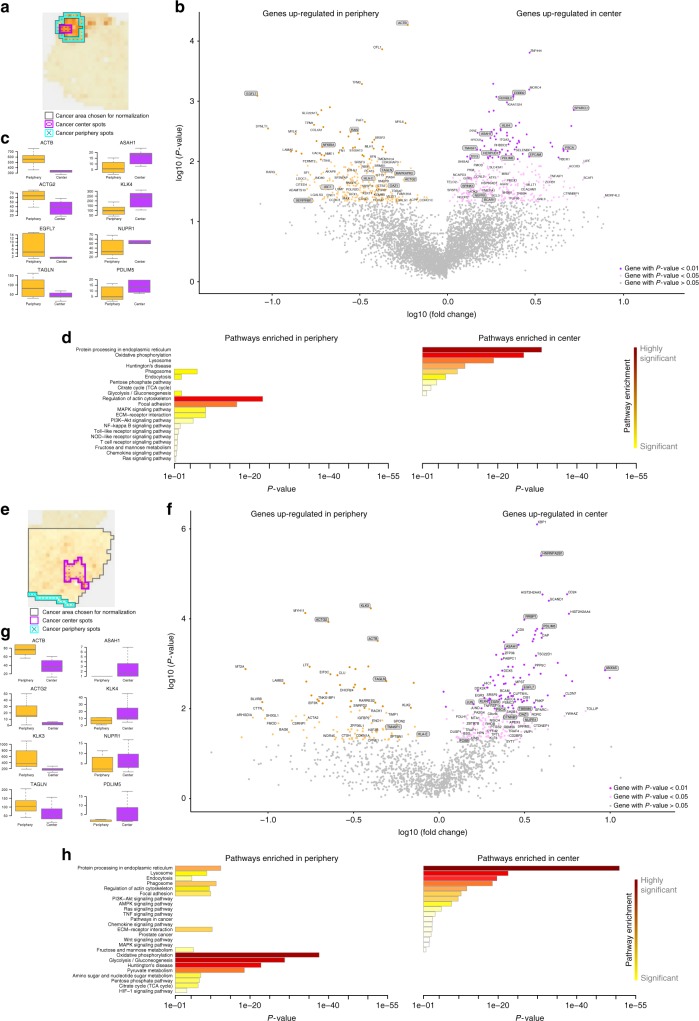
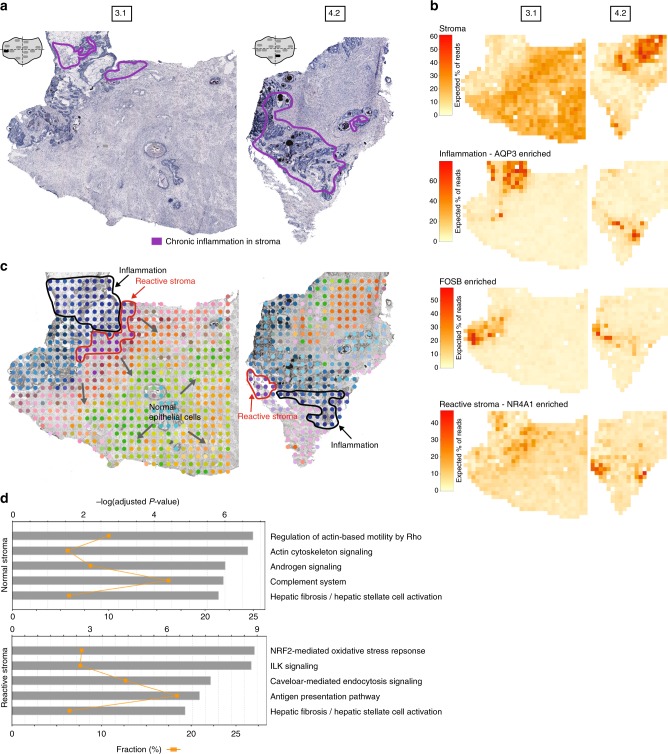
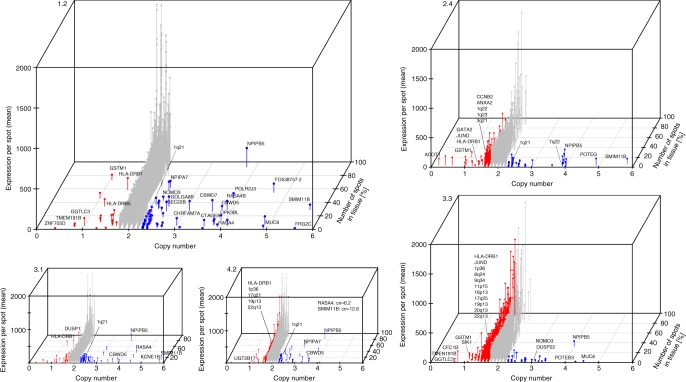
Intra-tumor heterogeneity is one of the biggest challenges in cancer treatment today. Here we investigate tissue-wide gene expression heterogeneity throughout a multifocal prostate cancer using the spatial transcriptomics (ST) technology. Utilizing a novel approach for deconvolution, we analyze the transcriptomes of nearly 6750 tissue regions and extract distinct expression profiles for the different tissue components, such as stroma, normal and PIN glands, immune cells and cancer. We distinguish healthy and diseased areas and thereby provide insight into gene expression changes during the progression of prostate cancer. Compared to pathologist annotations, we delineate the extent of cancer foci more accurately, interestingly without link to histological changes. We identify gene expression gradients in stroma adjacent to tumor regions that allow for re-stratification of the tumor microenvironment. The establishment of these profiles is the first step towards an unbiased view of prostate cancer and can serve as a dictionary for future studies.


Conflict of interest statement

P.L.S., F.S., and J.L. are authors on patents applied for by Spatial Transcriptomics AB covering the technology. The remaining authors declare no competing interests.

Figures

Fig. 1
Fig. 1
Study design for spatial transcriptomics (ST) in prostate cancer. a Location of sections used in this study and annotations made by a pathologist. The sections are colored according to annotation. Scale bars indicate size of the prostate. b Spatial microarrays have 1007 spatially barcoded spots of 100 μm diameter and 200 μm center-to-center distance. Spots denoted by filled circles are used for orientation, and lack spatial barcodes. The ST procedure yields matrices with read counts for every gene in every spot, which are then decomposed by factor analysis resulting in a set of factors (“cell types”), each comprising one activity map and one expression profile
Fig. 2
Fig. 2
Spatial gene expression heterogeneity within the 1.2 cancer tissue sample. a Factor activity maps for selected factors corresponding to epithelial, stromal, cancerous, PIN, or inflamed regions. Remaining factors’ activity maps in Supplementary Figure 2 and Supplementary Data 1. b Annotated brightfield image of H&E-stained tissue section. c Heatmap of the 20 most variable genes between cancer, PIN and normal gland regions, using spot sets from Supplementary Fig. 4b. Centered rlog: difference of rlog (variance-stabilized transform of ST expression data) and gene-wise mean rlog. Arrows highlight genes of interest validated by immunohistochemistry (IHC). d First two principal components of spot sets from c separate cancer, PIN and normal regions. e Array dot plots for SPINK1 and NPY. Circle size in array dot plots indicates normalized ST counts. f IHC staining for SPINK1 and NPY of an adjacent section on the ST array. Nuclei are stained with DAPI (blue). Scale bar indicates 1 mm
Fig. 3
Fig. 3
Histology and shared gene expression factors in three cancer tissue sections. a Annotated brightfield images of H&E-stained tissue sections. b Factor activity maps for selected factors corresponding to normal glands, stromal, PIN, cancerous, or inflamed regions based on a joint factor analysis of the three sections. Remaining factors’ activity maps in Supplementary Figure 6 and Supplementary Data 3. c Pathways enriched in normal, cancer and PIN epithelium clearly differentiate healthy from diseased tissue. Signficant pathways were calculated using the Komolgorov–Smirnov normality test at the 0.05 alpha level
Fig. 4
Fig. 4
Spatial comparison of periphery and center of tumor transcriptomes. ad Tissue sample 1.2 eh Tissue sample 3.3 a, e Area comprising spots taken for normalization of ST counts, within this area spots are chosen as periphery and center. Choice of spots is based on the pathologist’s annotation and the activity of the factors “cancer” and “reactive stroma” b, f Volcano plot of significantly differentially expressed genes between periphery and center c, g Box plots showing expression levels of noteworthy genes significantly upregulated in either periphery or the cancer center d, h Enriched pathways for significantly (p < 0.05) differentially expressed genes in center and periphery. P-values per gene were calculated with a two sample t-test
Fig. 5
Fig. 5
Stromal heterogeneity and reactive stroma in the microenvironment of inflammation. a Annotated brightfield images of H&E-stained tissue sections. b Selected factor activity maps of two inflammation-related factors and two stromal factors (normal and reactive) based on a joint factor analysis of tissue sections 3.1 and 4.2. Remaining factors’ activity maps in Supplementary Fig. 22 and Supplementary Data 7. c t-SNE summary of factor activities of all factors from the analysis in b; similar colors indicate similar factor activities. Arrows indicate some stromal expression gradients. d Top five enriched pathways in reactive and normal stroma. Bars give significance and orange squares the ratio. P-values were corrected for multiple testing by the Benjamini-Hochberg procedure
Fig. 6
Fig. 6
Relationship of copy number and gene expression. Expressed genes with a copy number between zero and six are shown. The majority of expressed genes have a copy number of two. Sample 1.2 is characterized rather by amplifications, sample 3.3 rather by deletions, whereas sample 2.4 displays a mixture of deletions and amplifications. Besides the deletions and amplifications that are unique for one or more samples, we identify several germline mutations. For example, we observe a heterozygous deletion of GSTM1 (CN = 1) which is linked to “an increased susceptibility to environmental toxins and carcinogens” and a germline deletion at 11q11 (CN = 0) which is linked to obesity. Somatic deletions were found among all 12 samples in USP17L8 (CN < 0.5)

Similar articles

Cited by

References

    1. Bray F, Ren JS, Masuyer E, Ferlay J. Global estimates of cancer prevalence for 27 sites in the adult population in 2008. Int. J. Cancer. 2013;132:1133–1145. doi: 10.1002/ijc.27711. - DOI - PubMed
    1. Gerlinger M, et al. Intratumor heterogeneity and branched evolution revealed by multiregion sequencing. N. Engl. J. Med. 2012;366:883–892. doi: 10.1056/NEJMoa1113205. - DOI - PMC - PubMed
    1. Lindberg J, et al. Exome sequencing of prostate cancer supports the hypothesis of independent tumour origins. Eur. Urol. 2013;63:347–353. doi: 10.1016/j.eururo.2012.03.050. - DOI - PubMed
    1. de Bruin EC, et al. Spatial and temporal diversity in genomic instability processes defines lung cancer evolution. Science. 2014;346:251–256. doi: 10.1126/science.1253462. - DOI - PMC - PubMed
    1. Cooper CS, et al. Analysis of the genetic phylogeny of multifocal prostate cancer identifies multiple independent clonal expansions in neoplastic and morphologically normal prostate tissue. Nat. Genet. 2015;47:367–372. doi: 10.1038/ng.3221. - DOI - PMC - PubMed

Publication types

MeSH terms