Randomized Controlled Trial
. 2018 Jun 20;9(1):2421.
doi: 10.1038/s41467-018-04673-z.

Brain-actuated functional electrical stimulation elicits lasting arm motor recovery after stroke

Affiliations
Randomized Controlled Trial

Brain-actuated functional electrical stimulation elicits lasting arm motor recovery after stroke

A Biasiucci et al. Nat Commun. .

Abstract

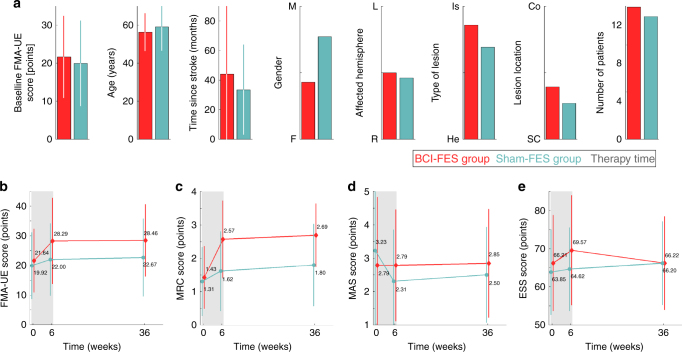
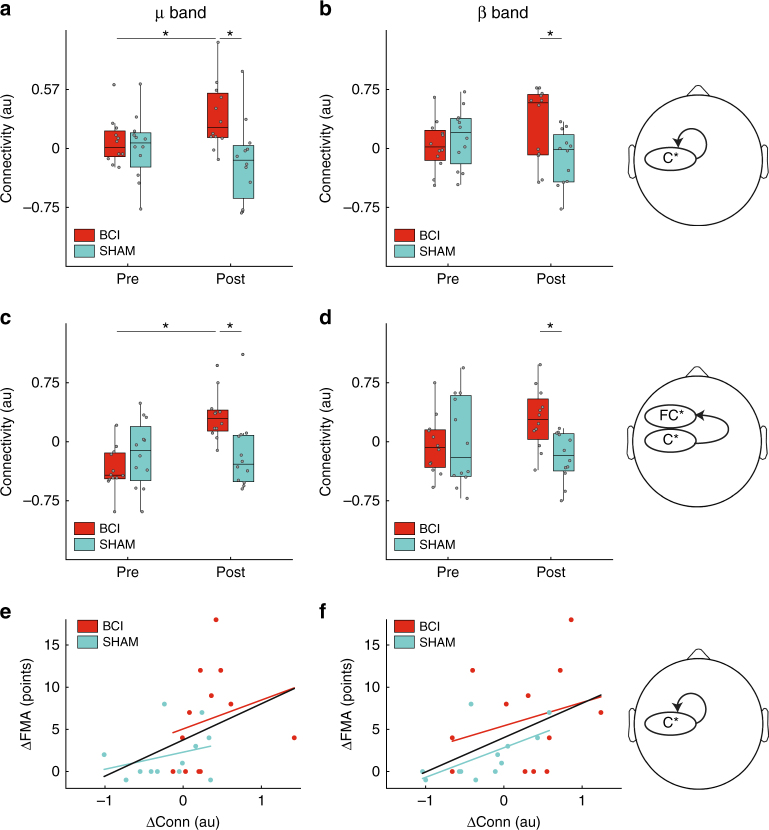
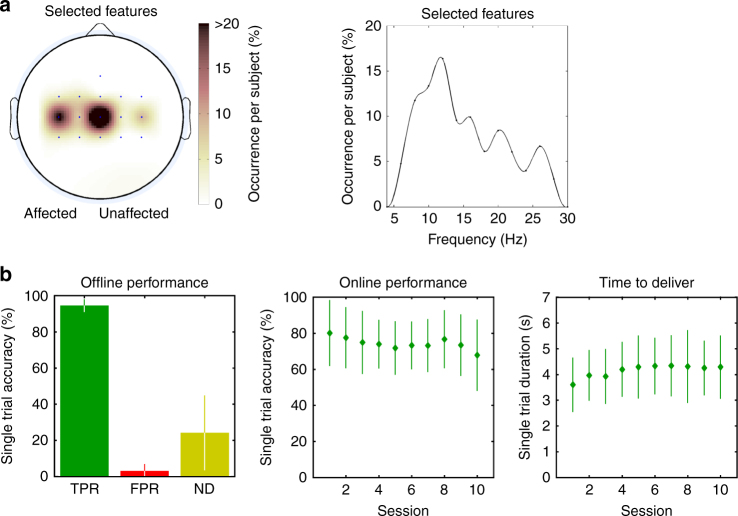
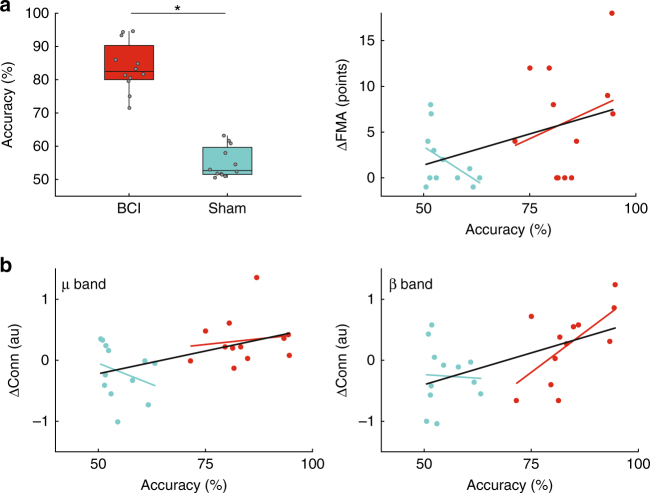
Brain-computer interfaces (BCI) are used in stroke rehabilitation to translate brain signals into intended movements of the paralyzed limb. However, the efficacy and mechanisms of BCI-based therapies remain unclear. Here we show that BCI coupled to functional electrical stimulation (FES) elicits significant, clinically relevant, and lasting motor recovery in chronic stroke survivors more effectively than sham FES. Such recovery is associated to quantitative signatures of functional neuroplasticity. BCI patients exhibit a significant functional recovery after the intervention, which remains 6-12 months after the end of therapy. Electroencephalography analysis pinpoints significant differences in favor of the BCI group, mainly consisting in an increase in functional connectivity between motor areas in the affected hemisphere. This increase is significantly correlated with functional improvement. Results illustrate how a BCI-FES therapy can drive significant functional recovery and purposeful plasticity thanks to contingent activation of body natural efferent and afferent pathways.


Conflict of interest statement

A.B. has formed a company that is developing a neuromuscular stimulation device and therapy for stroke patients. This device and therapy are not related to the work described in this paper. The remaining authors declare no competing interests.

Figures

Fig. 1
Fig. 1
Patient demographics and clinical scores. All plots report mean values ± standard deviation for BCI–FES group (N = 14, red) and sham-FES group (N = 13, light blue). a Patients’ main characteristics, including baseline Fugl-Meyer score (upper extremity), age, time since stroke, gender, affected hemisphere, type of lesion, lesion location, and number of patients per group. No statistical significant difference between groups was found for any of these factors before the intervention (p > 0.05 for all tests). b Primary outcome is the Fugl-Meyer assessment for the upper extremity (FMA-UE), measuring motor function. FMA-UE scores are reported immediately before patients received the intervention, immediately after it ended (6 weeks) and at a follow-up session done 6–12 months after the end of the intervention (average 36 weeks). The BCI group exhibited a significant (TIME x GROUP interaction, p = 0.04) and clinically relevant functional recovery after the intervention (6.6 ± 5.6 FMA-UE points, above the threshold of 5 points) that was retained 6–12 months after the end of the therapy (Bonferroni-corrected two-tailed paired t-test, p = 0.56). ce Secondary outcome scores: Medical Research Council Scale (MRC), measuring muscle strength, Modified Ashworth Scale (MAS), measuring spasticity, and European Stroke Scale (ESS), measuring the overall motor and cognitive state. As for the primary clinical outcome, target muscle strength recovery (1.1 ± 1.1 MRC points) was significant for the BCI–FES group (Bonferroni-corrected non-parametric signed-rank test, p = 0.02), but not for the sham-FES group (p = 0.11). BCI group also retained improvement in MRC scores at the follow-up clinical evaluation (p = 0.69). No significant differences were found for the ESS scores or the Ashworth wrist extension score (mixed ANOVA, p > 0.05 for all tests)
Fig. 2
Fig. 2
EEG effective connectivity within affected hemisphere during resting task. A mixed-design ANOVA revealed a significant increase of EEG effective connectivity after intervention in μ (10–12 Hz) (left column) and β (18–24 Hz) (right column) frequency bands for the BCI group (N = 14, red) as compared to the sham group (N = 13, light blue). Statistical differences are indicated (* p < 0.05, ** p < 0.001, post-hoc Bonferroni-corrected two-tailed paired/unpaired t-tests, see text for results on mixed ANOVA). a, b EEG effective connectivity changes within the affected sensorimotor cortex (channels C5*, C3*, and C1*), represented by boxplots (box: 25–75% percentiles, whiskers: 5–95% percentiles). Single values are also shown, jittered along the x-axis for a better visualization. c, d EEG effective connectivity changes from the affected C* to the FC* line. e, f Change of connectivity (post–pre intervention) within the affected sensorimotor cortex vs FMA post–pre intervention, together with the least-squares fit line for both groups pooled (N = 24, black line). Significant correlations were found in both μ and β frequency bands (Pearson’s correlation, μ: r = 0.41, p = 0.045; β: r = 0.48, p = 0.02). Least-square fits for each group separately are also shown for representation purposes (colored lines; N = 12 for BCI and sham groups)
Fig. 3
Fig. 3
BCI features and performance. For all subjects of the BCI–FES group (N = 14): a Selected discriminant EEG features used for closed-loop control by their electrode location (the affected hemisphere is on the left side) and frequency distribution. b Left. Average offline single-trial performance estimated in the calibration session (±standard deviation): true positive rate (TPR), false positive rate (FPR), and no-decision (ND). Center. Average online single-trial classification performance for each session (±standard deviation). Right. Average time required by the BCI to detect a movement attempt in each session (±standard deviation)
Fig. 4
Fig. 4
Accuracy of contingency between last PSD sample classification and FES. a Left. Values for the BCI (N = 14, red) and the sham (N = 13, light blue) groups (two-tailed unpaired t-test, p < 10−10). Right. Accuracy vs ΔFMA score (post–pre intervention), together with the least-square fit lines for both groups pooled (black line) and for each group separately (color lines). b Left. Accuracy vs ΔConnectivity in μ band (post–pre intervention), together with the least-square fit lines for both groups pooled (black line, N = 24) and for each group separately (color lines). Right. Accuracy vs ΔConnectivity in β band (post–pre intervention), together with the least-square fit lines for both groups pooled (black line). Correlations between these metrics were significant (Pearson’s correlation, μ: r = 0.49, p = 0.02; β: r = 0.55, p = 0.005). Fits for each group separately are shown for representation purposes (colored lines; N = 12 for BCI and sham groups)

References

    1. Pollock A, St George B, Fenton M, Firkins L. Top ten research priorities relating to life after stroke. Lancet Neurol. 2012;11:209. doi: 10.1016/S1474-4422(12)70029-7. - DOI - PubMed
    1. Moritz CT, Perlmutter SI, Fetz EE. Direct control of paralysed muscles by cortical neurons. Nature. 2008;4:639–642. doi: 10.1038/nature07418. - DOI - PMC - PubMed
    1. Hochberg LR, et al. Reach and grasp by people with tetraplegia using a neurally controlled robotic arm. Nature. 2012;485:372–375. doi: 10.1038/nature11076. - DOI - PMC - PubMed
    1. Borton D, Micera S, Millán JdR, Courtine G. Personalized neuroprosthetics. Sci. Transl. Med. 2013;5:210rv2. doi: 10.1126/scitranslmed.3005968. - DOI - PubMed
    1. Collinger JL, et al. High-performance neuroprosthetic control by an individual with tetraplegia. Lancet. 2013;381:557–564. doi: 10.1016/S0140-6736(12)61816-9. - DOI - PMC - PubMed

Publication types