. 2018 Jun 20;8(1):9388.
doi: 10.1038/s41598-018-27266-8.

Shift from stochastic to spatially-ordered expression of serine-glycine synthesis enzymes in 3D microtumors

Affiliations

Shift from stochastic to spatially-ordered expression of serine-glycine synthesis enzymes in 3D microtumors

Manjulata Singh et al. Sci Rep. .

Abstract

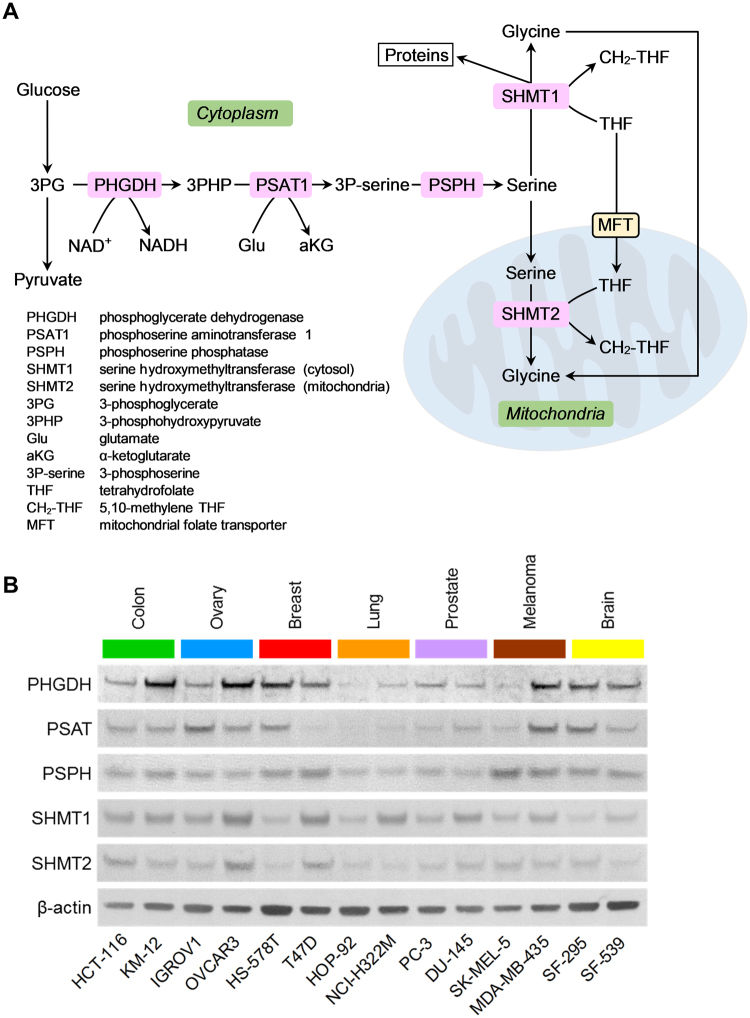
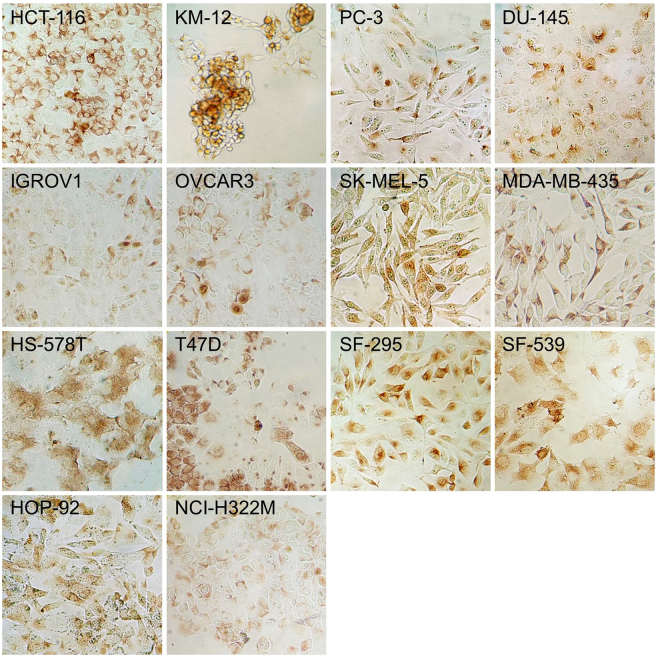
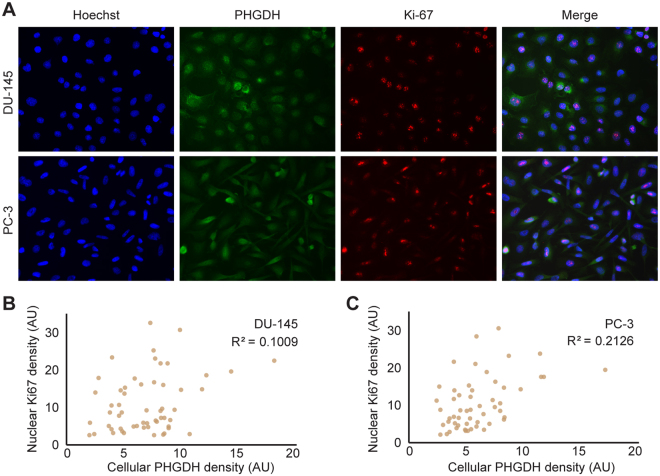
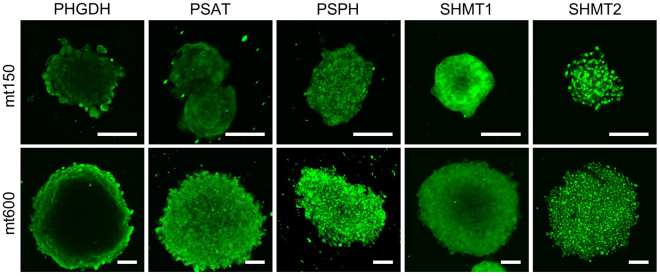
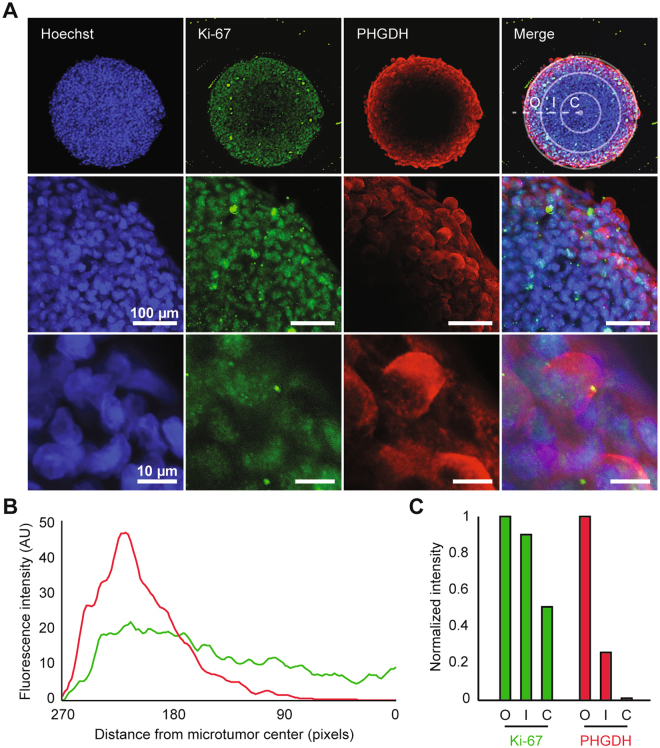
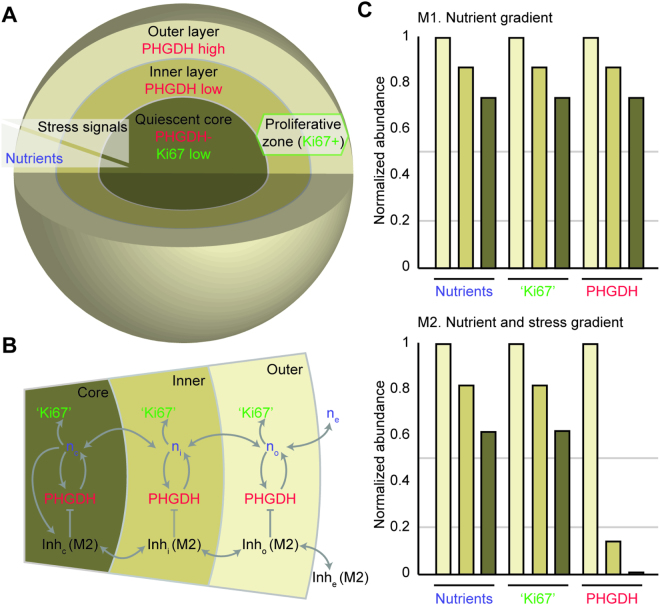
Cell-to-cell differences in protein expression in normal tissues and tumors are a common phenomenon, but the underlying principles that govern this heterogeneity are largely unknown. Here, we show that in monolayer cancer cell-line cultures, the expression of the five metabolic enzymes of serine-glycine synthesis (SGS), including its rate-limiting enzyme, phosphoglycerate dehydrogenase (PHGDH), displays stochastic cell-to-cell variation. By contrast, in cancer cell line-derived three-dimensional (3D) microtumors PHGDH expression is restricted to the outermost part of the microtumors' outer proliferative cell layer, while the four other SGS enzymes display near uniform expression throughout the microtumor. A mathematical model suggests that metabolic stress in the microtumor core activates factors that restrict PHGDH expression. Thus, intracellular enzyme expression in growing cell ecosystems can shift to spatially ordered patterns in 3D structured environments due to emergent cell-cell communication, with potential implications for the design of effective anti-metabolic cancer therapies.


Conflict of interest statement

The authors declare no competing interests.

Figures

Figure 1
Figure 1
Average expression levels of serine-glycine synthesis enzymes in cancer cell lines. (A) Schematic representation of pathways of serine-glycine synthesis and one-carbon metabolism. The enzymes examined in this study are highlighted with pink boxes, while cellular compartments are highlighted with green boxes. (B) Immunoblots of serine-glycine synthesis pathway enzymes in the indicated fourteen human cancer cell lines derived from seven human tissues are shown. Βeta-actin was used as loading control. The grouping of immunoblots were obtained from cropped blots obtained from different gels and are delineated by white space between them.
Figure 2
Figure 2
PHGDH expression in monolayer cultures of fourteen NCI-60 cell lines. PHGDH immunoreactivity of colon cancer (HCT-116 and KM-12), ovarian cancer (IGROV1 and OVCAR3), breast cancer (HS-578T and T47D), lung cancer (HOP-92 and NCI-H322M), prostate cancer (PC-3 and DU-145), melanoma (SK-MEL-5 and MDA-MB-435), and brain cancer (SF-295 and SF-539) derived cell lines from the NCI-60 collection is observed in tumor cell with various expression levels and immunoreactive areas. 3,3′-diaminobenzidine was used for visualization.
Figure 3
Figure 3
Expression of PHGDH and Ki-67 in DU-145 and PC-3 cell line monolayers. (A) Cytoplasmic PHGDH (green channel), and nuclear Ki-67 (red channel) immunoreactivity are shown in DU-145 and PC-3 prostate cancer cell lines. Hoechst counterstain (blue color) indicates cell nuclei. Scatter plots for fluorescence of nuclear Ki67 versus cellular PHGDH quantified from images of single cells shown in for (B) DU-145 and (C) PC-3 cells.
Figure 4
Figure 4
Spatial localization of serine-glycine synthesis enzymes expression in 3D microtumors. Spatial localization of the indicated enzymes in mt150 (top panels) and mt600 (bottom panels) DU-145-derived 3D-microtumors. Confocal images are centered on the middle plane of the microtumor. Bar = 100 μm.
Figure 5
Figure 5
PHGDH and Ki-67 expression in 3D microtumors. (A) Spatial localization of Ki-67 (green), PHGDH (red), and their overlap in mt600 microtumors at low- (top panel), intermediate (middle panel) and high magnification (bottom panel). Confocal images are centered on the middle plane of the microtumor. In the overlay panels Hoechst counterstain (blue color) indicates cell nuclei. PHGDH expression is restricted to the outer layer of Ki-67+ cells. Concentric circles in the top right panel depict the outer layer (O), inner layer (I), and core (C) regions of the microtumor. (B) Average of nine radial linescans for Ki-67 (green) and PHGDH (red) fluorescence intensity. (C) Average of Ki-67 and PHGDH fluorescence intensity in each of the microtumor compartments.
Figure 6
Figure 6
Spatial organization in a compartmental model of 3D microtumors. (A) Compartments of a 3D microtumor model include an outer layer that separates an inner layer and core of tumor cells from the extracellular compartment. A decreasing gradient of nutrients in models 1 and 2 (M1 and M2, respectively) is formed through nutrient consumption and diffusion between the outer layer, inner layer, and core of the microtumor. M2 also considers a gradient of stress signals that are strongest at the microtumor core. (B) Schematic diagram of the transport of nutrients (n) and their consumption for the expression of proliferative genes associated with Ki-67+ status (‘Ki67’), the rate-limiting enzyme for serine biosynthesis (PHGDH), and a molecule that inhibits expression of PHGDH (Inh). Expression of Inh is omitted in M1. Extracellular, outer layer, inner layer, and core compartments are noted in subscripts (e, i, o, and c respectively). (C) The abundance of nutrients, ‘Ki67′, and PHGDH in each of the microtumor compartments for M1 (top) and M2 (bottom). Each quantity is normalized to its abundance in the outer layer compartment.

References

    1. Cohen AA, et al. Dynamic proteomics of individual cancer cells in response to a drug. Science (New York, N.Y.) 2008;322:1511–1516. doi: 10.1126/science.1160165. - DOI - PubMed
    1. Loo LH, et al. Heterogeneity in the physiological states and pharmacological responses of differentiating 3T3-L1 preadipocytes. The Journal of cell biology. 2009;187:375–384. doi: 10.1083/jcb.200904140. - DOI - PMC - PubMed
    1. Singh DK, et al. Patterns of basal signaling heterogeneity can distinguish cellular populations with different drug sensitivities. Molecular systems biology. 2010;6:369. doi: 10.1038/msb.2010.22. - DOI - PMC - PubMed
    1. Raj A, van Oudenaarden A. Nature, nurture, or chance: stochastic gene expression and its consequences. Cell. 2008;135:216–226. doi: 10.1016/j.cell.2008.09.050. - DOI - PMC - PubMed
    1. Uhlen M, et al. Proteomics. Tissue-based map of the human proteome. Science (New York, N.Y.) 2015;347:1260419. doi: 10.1126/science.1260419. - DOI - PubMed

Publication types

LinkOut - more resources