Clinical Trial
. 2019 Apr;20(4):293-307.
doi: 10.1038/s41435-018-0032-1. Epub 2018 Jun 21.

Elevated T cell levels in peripheral blood predict poor clinical response following rituximab treatment in new-onset type 1 diabetes

Affiliations
Clinical Trial

Elevated T cell levels in peripheral blood predict poor clinical response following rituximab treatment in new-onset type 1 diabetes

Peter S Linsley et al. Genes Immun. 2019 Apr.

Abstract

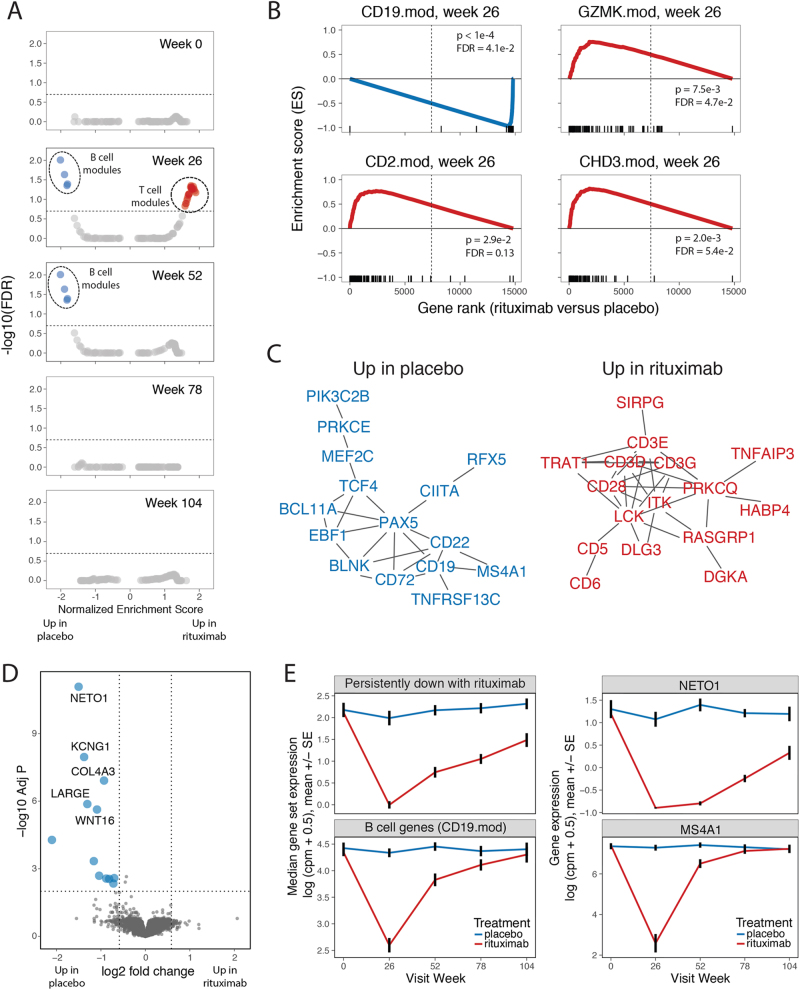
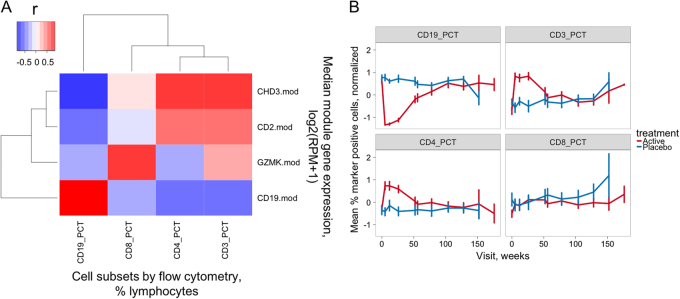
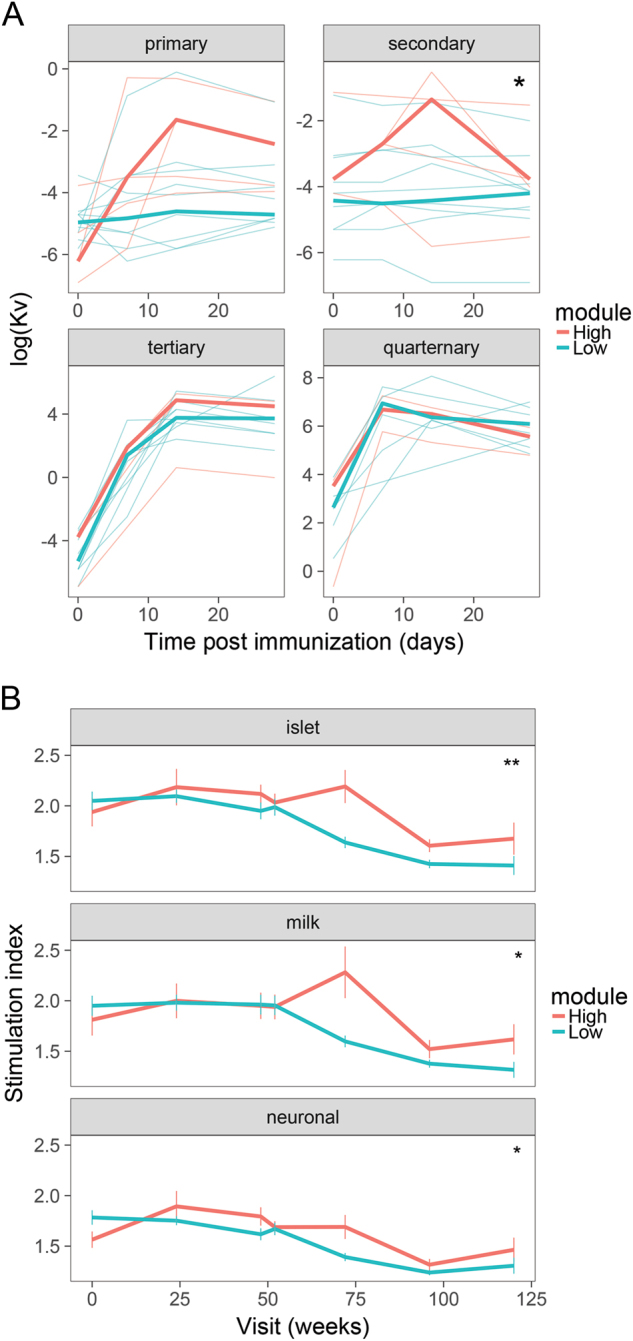
Biologic treatment of type 1 diabetes (T1D) with agents including anti-CD3 (otelixizumab and teplizumab), anti-CD20 (rituximab), LFA3Ig (alafacept), and CTLA4Ig (abatacept) results in transient stabilization of insulin C-peptide, a surrogate for endogenous insulin secretion. With the goal of inducing more robust immune tolerance, we used systems biology approaches to elucidate mechanisms associated with C-peptide stabilization in clinical trial blood samples from new-onset T1D subjects treated with the B cell-depleting drug, rituximab. RNA sequencing (RNA-seq) analysis of whole-blood samples from this trial revealed a transient increase in heterogeneous T cell populations, which were associated with decreased pharmacodynamic activity of rituximab, increased proliferative responses to islet antigens, and more rapid C-peptide loss. Our findings illustrate complexity in hematopoietic remodeling that accompanies B cell depletion by rituximab, which impacts and predicts therapeutic efficacy in T1D. Our data also suggest that a combination of rituximab with therapy targeting CD4 + T cells may be beneficial for T1D subjects.


Conflict of interest statement

The authors declare that they have no conflict of interest.

Figures

Fig. 1
Fig. 1
Rituximab treatment triggered transient changes in whole-blood gene module expression. a, b GSEA [12] comparing rituximab- to placebo-treated patients. a Under/over-representation of specific gene sets in whole-blood signatures from rituximab-treated individuals over the course of the study. Horizontal line indicates FDR of 0.20. Statistical tests were performed using the GSEA tool (http://software.broadinstitute.org/gsea/downloads.jsp). Blue, overexpressed in placebo-treated subjects; red, over-expression in rituximab-treated subjects. This analysis included 30, 28, 30, 27, and 20 rituximab-treated subjects at the 0, 26, 52, 78, and 104 week visits, respectively; and 13, 10, 12, 15, and 8 placebo-treated subjects at the same visits. b Selected gene sets (modules) significantly under/over-represented in rituximab-treated individuals at week 26. X axis, enrichment score; Y axis, gene rank in rituximab- vs. placebo-treated samples. Rug plots along the X-axes show differential expression ranks of module genes relative to all genes. c STRING network [14] of interactions among genes in the leading edge of gene sets significantly upregulated in rituximab-treated patients at week 26. Shown are network graphs representing the unions of genes found in multiple downregulated or upregulated modules (>1 or >4, respectively). To minimize the size of the graph, vertices (genes) were filtered to have degrees (number of adjacent connections or edges) > 1 and to represent vertices not farther than 3 connections from another fixed vertex (neighborhood). Vertices are colored as in Fig. 1a. d Differential expression of genes between the placebo- and rituximab-treated patients at the 78 week visit, performed using limma-voom [17]. Horizontal dotted line represents FDR = 0.01, vertical dotted lines represent fold change of ±1.5; center, expression of module gene sets. e Expression of representative individual genes over time in placebo-treated patients. Upper panels show genes persistently downregulated with rituximab treatment, lower panels show B cell-module genes (CD19.mod) and an established individual B cell marker gene, MS4A1 (CD20). There were N = 13 placebo and N = 30-rituximab-treated subjects tested at week 0, respectively; and N = 15 placebo and N = 27 rituximab-treated subjects at week 78. Values are means across patients; error bars show ± 1 standard error of the mean
Fig. 2
Fig. 2
Flow cytometry also demonstrates over-expression of T cell genes in rituximab-vs. placebo-treated subjects. a Correlation of modular gene expression with cell subset levels determined by flow cytometry. Shown is a heatmap representation of the correlation between modular gene expression measured by RNA-seq (Y axis) vs. the percentages of cell subsets determined by flow cytometry (X axis). Gene expression was calculated as median log2 expression values in reads per million (RPM) + 1 for all genes in the indicated module. Cell subsets were determined by antibody staining and were expressed as percentages of total lymphocytes [20]. The magnitude of Pearson’s correlation coefficients (r) are represented by color intensity; Red, positive correlation; Blue, negative correlation. This plot was derived from 27 rituximab-treated subjects tested at week 26. b CD3+ and CD4+, but not CD8+ T cell subsets were transiently overexpressed in rituximab-treated subjects. Percentages of the indicated cell subsets for all subjects at all visits were normalized by z-scores ((value-mean of values)/SD of values). Shown are the z-score normalized mean percentages of the indicated cell subsets (±SD, Y axis) determined by flow cytometry vs. time of visit (X axis). There were 30–35 rituximab- vs. 14–17 placebo-treated subjects tested at weeks 0–104 for each marker; and 25, 4, and 2 rituximab- vs. 12, 2, and 1 placebo-treated subjects at weeks 128–176
Fig. 3
Fig. 3
Expression of CD4+ T cell-, but not CD8+ T cell or B cell-module-associated genes at 26 weeks predicts C-peptide loss in rituximab-treated patients. a Rituximab-treated subjects were split into module high (top 25%) and module low (bottom 75%) groups based on log2 median module gene counts + 1 values from RNA-seq profiles collected at week 26. Shown are Kaplan–Meier plots for progression, measured as time to 50% of baseline C-peptide, vs. time. Survdiff [43] p-values were calculated and adjusted for multiple testing [40]. Rituximab-treated subjects were stratified by median gene expression in B cell-module, CD19.mod; CD8+ T cell-associated module, GZMK.mod; and CD4+ T cell-associated modules CD2.mod and CHD3.mod. Numbers at bottoms of panels are numbers of subjects at risk. Numbers of subjects tested are indicated at the bottom of each panel. b Expression of CD4+ T cell-, but not CD8+ or B cell-module-associated genes at 26 weeks predicts C-peptide AUC levels at 52 weeks in rituximab-treated subjects. Shown are C-peptide AUC levels (% of baseline), across all visits of rituximab-treated subjects. Subjects were stratified into module high and nodule low subsets based on the expression of the indicated module gene expression at week 26, as described in Fig. 3. Asterisks indicate level of significance of Wilcox on test p-values: *p-value < 0.05 and p-value ≥ 0.01. Numbers of subjects tested were the same as in a
Fig. 4
Fig. 4
Relationship of T cell-module gene expression to pharmacodynamic and mechanistic parameters. We stratified subjects into module high and module low subsets based on CHD3.mod gene expression at week 26 and compared subsets for pharmacodynamic and mechanistic markers. a Pharmacodynamic relationship of median CHD3.mod gene expression to phiX174 antibody responses following primary, secondary, tertiary and quaternary immunizations [22]. Thin lines, individual responses; thick lines, mean responses. Asterisks indicate level of significance for p-values calculated from repeated measures ANOVA tests for module set as a fixed effect: *p-value < 0.05 and p-value ≥ 0.01. This plot represents 14 rituximab-treated subjects (6 module high and 8 module low). b Relationship of median CHD3.mod module gene expression to T cell proliferative responses to different antigens. Responses to multiple individual antigenic peptides were grouped thematically into islet, milk, and neuronal antigens [20] and are presented as mean responses ± standard error (SE). There were N = 6, 5, 6, 6, 6, 6, 4 module high and N = 12, 18, 19, 19, 17, 19, 7 module low subjects tested at the 0, 42, 84, 91, 126, 168, and 210 week visits, for N = 4, 5, and 4 islet, milk, and neuronal peptides, respectively. Asterisks indicate level of significance for p-values calculated from repeated measures ANOVA tests for module set as a fixed effect: *p-value < 0.05 and **p-value < 0.01

References

    1. Rigby MR, Ehlers MR. Targeted immune interventions for type 1 diabetes: not as easy as it looks! Curr Opin Endocrinol Diabetes Obes. 2014;21:271–8. doi: 10.1097/MED.0000000000000075. - DOI - PMC - PubMed
    1. Greenbaum CJ, Schatz DA, Haller MJ, Sanda S. Through the fog: recent clinical trials to preserve beta-cell function in type 1 diabetes. Diabetes. 2012;61:1323–30. doi: 10.2337/db11-1452. - DOI - PMC - PubMed
    1. Orban T, Bundy B, Becker DJ, DiMeglio LA, Gitelman SE, Goland R, et al. Co-stimulation modulation with abatacept in patients with recent-onset type 1 diabetes: a randomised, double-blind, placebo-controlled trial. Lancet. 2011;378:412–9. doi: 10.1016/S0140-6736(11)60886-6. - DOI - PMC - PubMed
    1. Herold KC, Gitelman SE, Ehlers MR, Gottlieb PA, Greenbaum CJ, Hagopian W, et al. Teplizumab (anti-CD3 mAb) treatment preserves C-peptide responses in patients with new-onset type 1 diabetes in a randomized controlled trial: metabolic and immunologic features at baseline identify a subgroup of responders. Diabetes. 2013;62:3766–74. doi: 10.2337/db13-0345. - DOI - PMC - PubMed
    1. Pescovitz MD, Greenbaum CJ, Krause-Steinrauf H, Becker DJ, Gitelman SE, Goland R, et al. Rituximab, B-lymphocyte depletion, and preservation of beta-cell function. N Engl J Med. 2009;361:2143–52. doi: 10.1056/NEJMoa0904452. - DOI - PMC - PubMed

Publication types