Clinical Trial
. 2018 Jul;119(1):27-35.
doi: 10.1038/s41416-018-0132-8. Epub 2018 Jun 21.

Circulating biomarkers during treatment in patients with advanced biliary tract cancer receiving cediranib in the UK ABC-03 trial

Affiliations
Clinical Trial

Circulating biomarkers during treatment in patients with advanced biliary tract cancer receiving cediranib in the UK ABC-03 trial

Alison C Backen et al. Br J Cancer. 2018 Jul.

Abstract

Background: Advanced biliary tract cancer (ABC) has a poor prognosis. Cediranib, in addition to cisplatin/gemcitabine [CisGem], improved the response rate, but did not improve the progression-free survival (PFS) in the ABC-03 study. Minimally invasive biomarkers predictive of cediranib benefit may improve patient outcomes.

Methods: Changes in 15 circulating plasma angiogenesis or inflammatory-related proteins and cytokeratin-18 (CK18), measured at baseline and during therapy until disease progression, were correlated with overall survival (OS) using time-varying covariate Cox models (TVC).

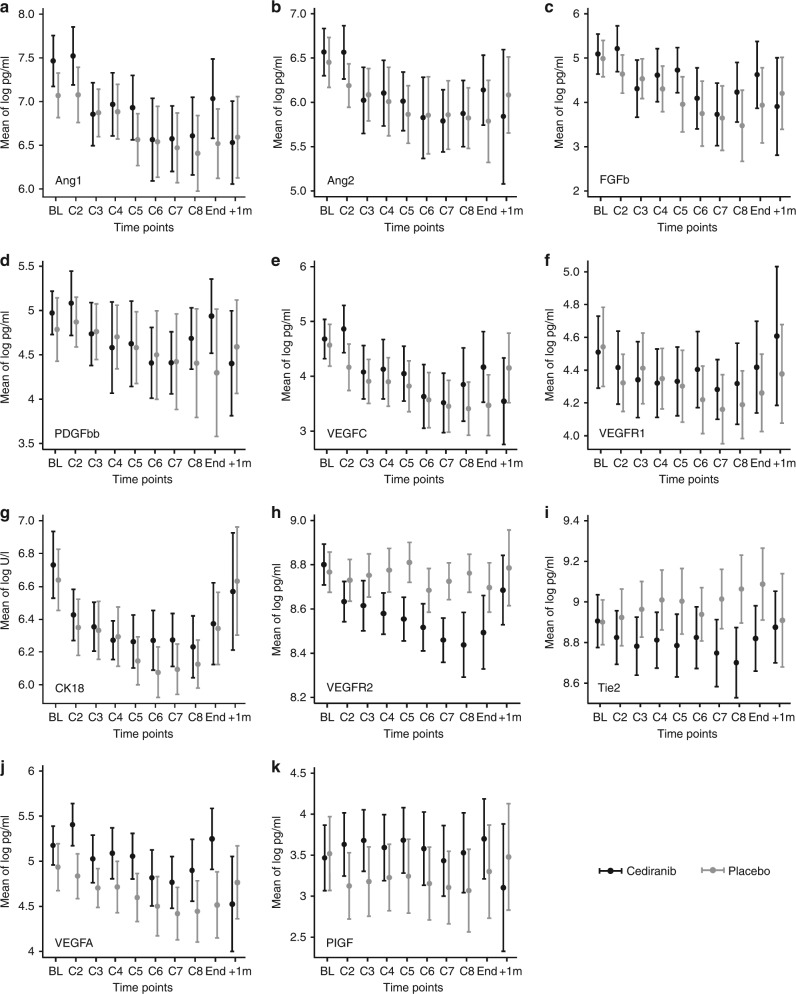
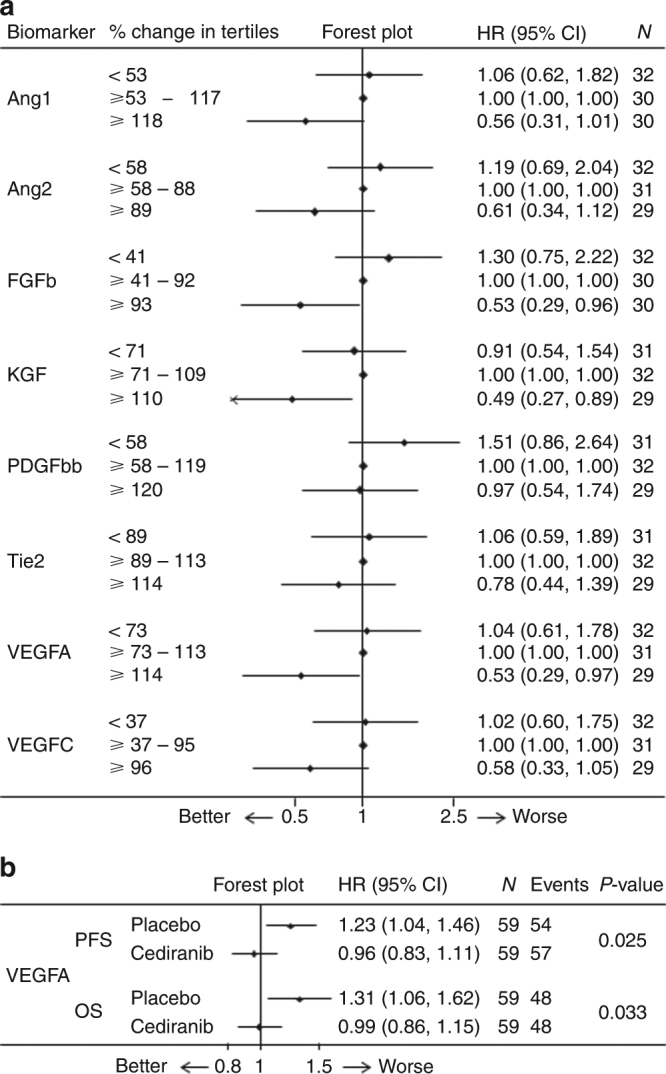
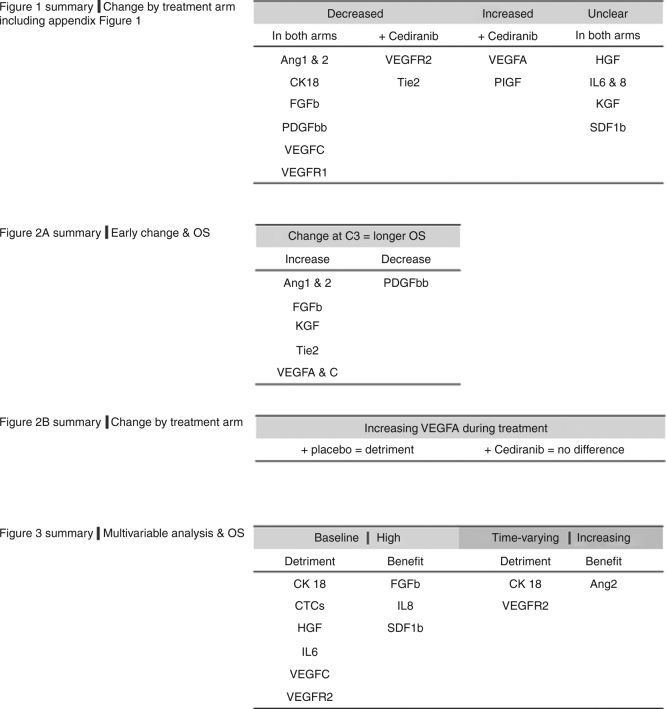
Results: Samples were available from n = 117/124 (94%) patients. Circulating Ang1&2, FGFb, PDGFbb, VEGFC, VEGFR1 and CK18 decreased as a result of the therapy, independent of treatment with cediranib. Circulating VEGFR2 and Tie2 were preferentially reduced by cediranib. Patients with increasing levels of VEGFA at any time had a worse PFS and OS; this detrimental effect was attenuated in patients receiving cediranib. TVC analysis revealed CK18 and VEGFR2 increases correlated with poorer OS in all patients (P < 0.001 and P = 0.02, respectively).

Conclusions: Rising circulating VEGFA levels in patients with ABC, treated with CisGem, are associated with worse PFS and OS, not seen in patients receiving cediranib. Rising levels of markers of tumour burden (CK18) and potential resistance (VEGFR2) are associated with worse outcomes and warrant validation.


Conflict of interest statement

S.B. has grants and non-financial support from AstraZeneca, outside this work. J.A.B. received personal fees from AstraZeneca during the conduct of the study. D.C. received grants from AstraZeneca, Amgen, Celgene, Merck Serono, Sanofi, Merrimack. and Medimmune, outside this work. H.W. participates in advisory boards for Lilly and AstraZeneca outside this work. J.S.W. has non-financial support from Novartis and Ipsen Pharma and personal fees from Roche outside this work. J.W.V. reports personal fees from Pfizer, grants, personal fees, and non-financial support from Novartis, personal fees from Abbott, personal fees and non-financial support from Celgene, personal fees from SIRTex, personal fees and non-financial support from Ipsen, grants, and personal fees from AstraZeneca Pharmaceuticals, outside the submitted work. D.A.A., A.C.B., P.C., C.D., M.D., A.L., S.M., A.M., M.M.N., K.M., D.H.P., C.R., P.J.R. and W.P.S. declare no competing interests.

Figures

Fig. 1
Fig. 1
Changes in key biomarkers during treatment, split by treatment arm. The mean log of pg/ml of each biomarker, by treatment arm, is shown at baseline (BL), during treatment cycles (C2-8), at the end of chemotherapy (End) and 1 month after the end of all treatment (+1m) which equates to 1 month after disease progression has been documented. Panels a-g indicate markers that change similarly in both arms; the cause may be CisGem chemotherapy or tumour burden (rather than Cediranib). Panels h and i show markers that occur at lower levels in the circulation as a result of treatment with Cediranib. Panels j and k show markers that appear to be shed into the circulation as a result of Cediranib. Error bars indicate 95% confidence intervals. Number of patients at each time-point; BL=114, C2=96, C3=92, C4=90, C5=79, C6=73, C7=71, C8=59, End=55, +1m=44
Fig. 2
Fig. 2
a Relationship between % change from baseline at Cycle 3 and overall survival. % change from baseline was calculated, the patients ranked in order and divided into three groups for comparison. The middle tertile was set to 0, as this represents the ‘least change’ group, so the two extremities can be compared with this. b Relationship between biomarker change during treatment and outcome. VEGFA change from baseline during treatment was evaluated using the time-varying covariate Cox model, which included VEGFA as a continuous variable and considered units of 100pg/ml change in levels of circulating VEGFA during treatment. At any given time-point, an increase in VEGFA in patients treated with placebo is associated with a shorter PFS and OS. However, an increase in VEGFA in patients treated with cediranib results in a slightly longer PFS and has no effect on OS. The interaction (treatment with biomarker) p-value is shown
Fig. 3
Fig. 3
Circulating tumour cells. Association between CTC count at baseline and Cycle 3 and PFS (a) and OS (b); patients who had CTCs enumerated using Cell Search both at baseline (BL) and at the start of Cycle 3 of treatment, were divided into two categories; Group 1 had no CTCs at BL and C3 (n=35) and Group 2 had at least 1 CTC at either BL or C3, or both time-points (n=22). The range of CTCs observed in this patient set was 0-44, with a median of 0 and a mean of 2 CTCs. *As both of these curves overlap, this p-value may not be reliable. c Shows change in CTC count (as absolute numbers at C3), shaded by best response. The hypothesis would be that the patients who had the biggest decrease in CTCs, would have better outcomes (which is not the case). d Using the data collected from the n=56 patients who had CTCs enumerated at both baseline and C3, this shows that combining baseline and C3 CTC counts appears less discriminatory than considering baseline CTC counts alone
Fig. 4
Fig. 4
Summary. Figure 1 shows markers which change with treatment, split by treatment arm; Ang1&2, FGFb, PDGFbb, VEGFC and VEGFR1 show patterns of change which are similar in both placebo and cediranib arms. Four proteins show different patterns of change between the two treatment arms; VEGFR2 and Tie2 decrease + Cediranib, VEGFA and PlGF increase + Cediranib. Appendix Figure 1 shows changes with treatment which occurred in HGF, IL6, IL8, KGF and SDF1b, which do not show obvious patterns of change. This information may be relevant when designing future trials. Figure 2 examines how change in biomarkers is related to length of OSIn all patients, increases in Ang1&2, FGFb, KGF, Tie2, VEGFA and VEGFC at C3 was associated with longer OS. Conversely, decrease s in PDGFbb were associated with longer OS. Change in VEGFA is the only marker which predicts outcome (PFS and OS) differently by treatment arm (increasing VEGFA in the placebo arm is associated with a worse outcome, but this not seen in patients in the Cediranib arm). Table 1 summarises univariate and multivariable Cox models using time-varying parameters for PFS and OS

References

    1. Bragazzi MC, et al. Cholangiocarcinoma: epidemiology and risk factors. Transl. Gastrointest. Cancer. 2012;1:21–32.
    1. Bertran E, Heise K, Andia ME, Ferreccio C. Gallbladder cancer: incidence and survival in a high-risk area of Chile. Int. J. Cancer. 2010;127:2446–2454. doi: 10.1002/ijc.25421. - DOI - PubMed
    1. Horgan AM, Amir E, Walter T, Knox JJ. Adjuvant therapy in the treatment of biliary tract cancer: a systematic review and meta-analysis. J. Clin. Oncol. 2012;30:1934–1940. doi: 10.1200/JCO.2011.40.5381. - DOI - PubMed
    1. Primrose JN, et al. Adjuvant capecitabine for biliary tract cancer: The BILCAP randomized study. J. Clin. Oncol. 2017;35(15_suppl):4006–4006. doi: 10.1200/JCO.2017.35.15_suppl.4006. - DOI
    1. Glimelius B, et al. Chemotherapy improves survival and quality of life in advanced pancreatic and biliary cancer. Ann. Oncol. 1996;7:593–600. doi: 10.1093/oxfordjournals.annonc.a010676. - DOI - PubMed

Publication types

MeSH terms