. 2018 Jul;559(7712):61-66.
doi: 10.1038/s41586-018-0237-5. Epub 2018 Jun 20.

Nuclear ARP2/3 drives DNA break clustering for homology-directed repair

Affiliations

Nuclear ARP2/3 drives DNA break clustering for homology-directed repair

Benjamin R Schrank et al. Nature. 2018 Jul.

Abstract

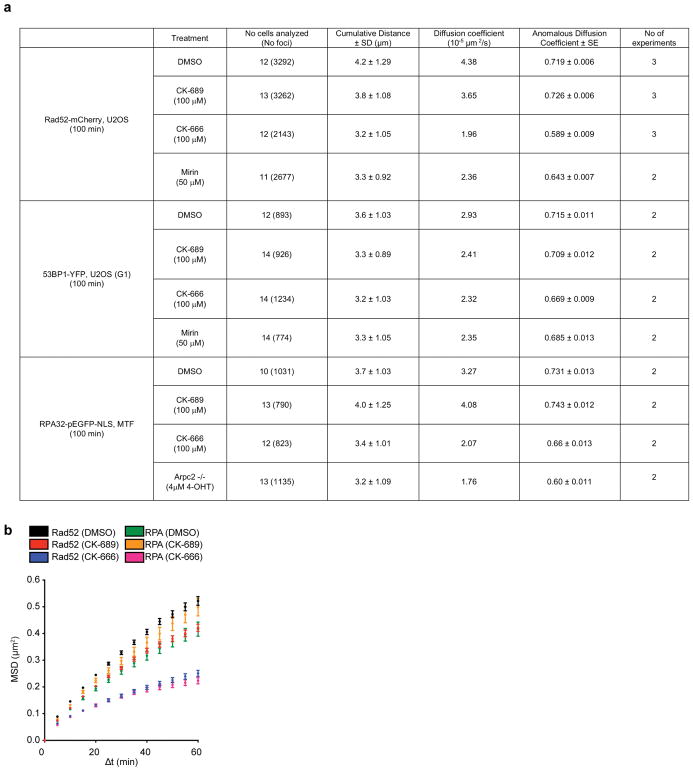
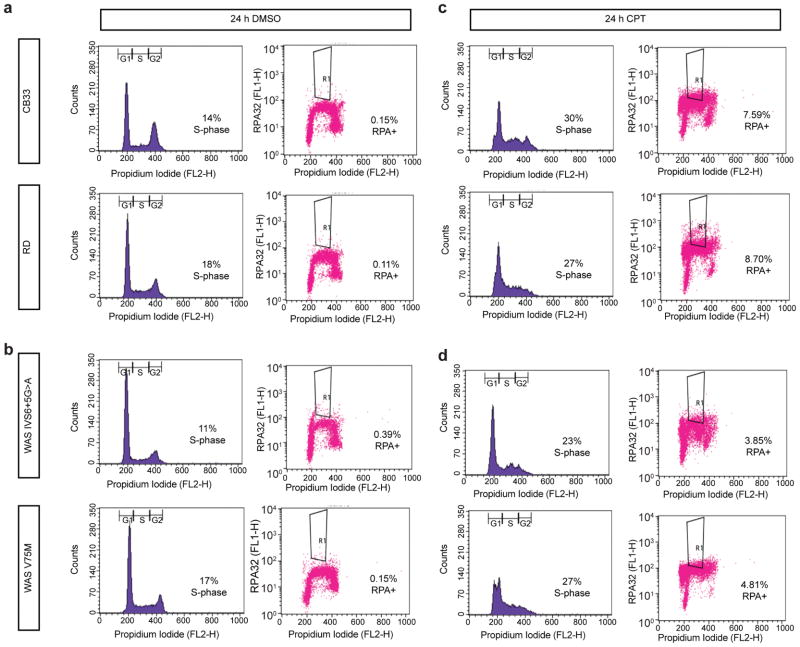
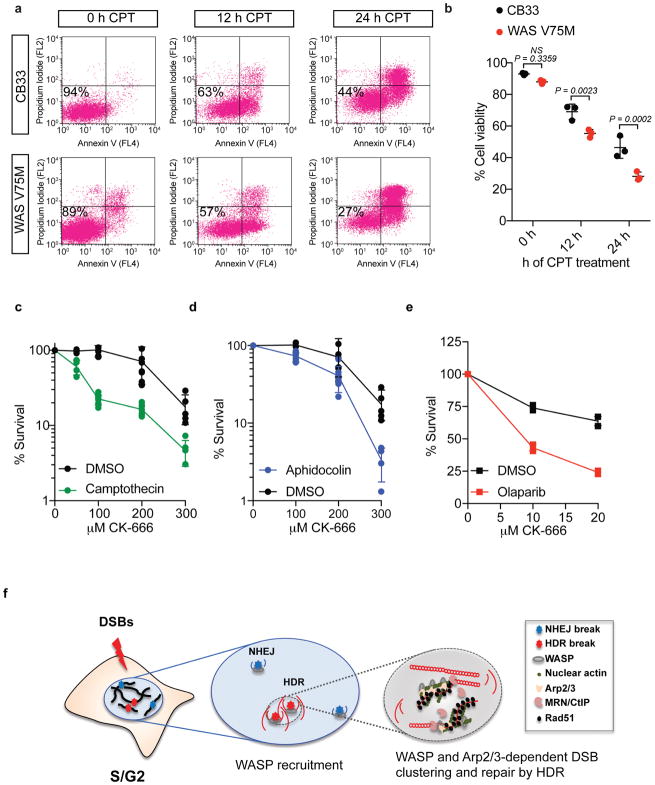
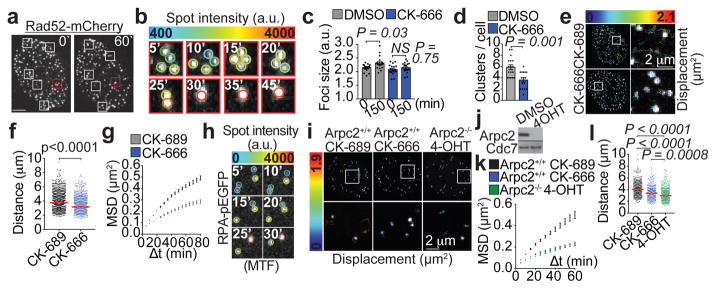
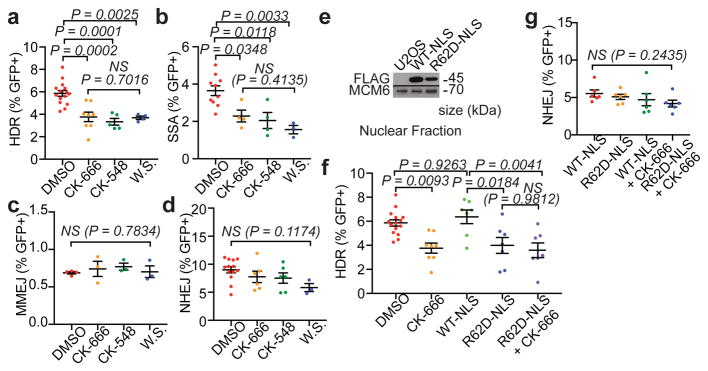
DNA double-strand breaks repaired by non-homologous end joining display limited DNA end-processing and chromosomal mobility. By contrast, double-strand breaks undergoing homology-directed repair exhibit extensive processing and enhanced motion. The molecular basis of this movement is unknown. Here, using Xenopus laevis cell-free extracts and mammalian cells, we establish that nuclear actin, WASP, and the actin-nucleating ARP2/3 complex are recruited to damaged chromatin undergoing homology-directed repair. We demonstrate that nuclear actin polymerization is required for the migration of a subset of double-strand breaks into discrete sub-nuclear clusters. Actin-driven movements specifically affect double-strand breaks repaired by homology-directed repair in G2 cell cycle phase; inhibition of actin nucleation impairs DNA end-processing and homology-directed repair. By contrast, ARP2/3 is not enriched at double-strand breaks repaired by non-homologous end joining and does not regulate non-homologous end joining. Our findings establish that nuclear actin-based mobility shapes chromatin organization by generating repair domains that are essential for homology-directed repair in eukaryotic cells.


Conflict of interest statement

The authors declare no competing financial interests

Figures

Extended Data Fig. 1
Extended Data Fig. 1. Actin filament nucleators localize to chromosomal DSBs in Xenopus extracts and mammalian cells
a, Enrichment ratios and spectral counts of actin complexes and repair proteins in DSB-containing chromatin by liquid chromatography-mass spectrometry are shown. b, DNA damage-dependent enrichment of actin complexes (+PflMI) following PIKK inhibition (KU55933: ATMi; VE821: ATRi). RPA shown as a marker of DNA damage. c, Quantification actin complexes in chromatin relative to + PflMI samples. (β-actin n=3 independent experiments, Arpc4 n=2 independent experiments, CapZβ n=3 independent experiments). Mean and s.e.m shown. d, Representative images of WASP foci post NCS treatment in MTFs. e, Quantification of WASP foci (P calculated by two-sided Mann-Whitney test; data shown as mean; DMSO n=578 nuclei, NCS n=556 nuclei). f, γH2AX co-localization with WASP foci in MTFs (n = 22 nuclei, r = 0.58 ± 0.021, Pearson). Scale bar is 5 μm or as shown.
Extended Data Fig. 2
Extended Data Fig. 2. CK-689 does not significantly impact foci movement
a, Summary of DSB movement analyses as related to Figures 3, 6, and Extended Data Figure 5. b, MSD of Rad52-mCherry foci and RPA-pEGFP-NLS foci treated with DMSO, CK-689 and CK-666. (Data shown as mean and weighted s.e.m.; Rad52: CK-689 n=3262 foci from 13 nuclei, CK-666 n=2143 foci from 12 nuclei, DMSO n=3292 foci from 12 nuclei. RPA32: CK-689 n=790 foci from 13 nuclei, CK-666 n=823 foci from 12 nuclei, DMSO n=1031 foci from 10 nuclei). MSD of Rad52 DMSO also shown in Fig. 6i. MSD of Rad52 CK-689 and CK-666 also shown in Fig. 3g. MSD of RPA CK-689 and CK-666 also shown in Fig. 3l.
Extended Data Fig. 3
Extended Data Fig. 3. Arp2/3 clusters Rad51 foci
a, Schematic of clustering events. b, Representative cell cycle distribution of U2OS cells following double-thymidine block (out of five independent experiments). c, Representative images of U2OS-AsiSI nuclei showing Rad51 foci. d, Rad51 foci clustering in G2 cells (P calculated by Spatial analysis plug-in; data shown as mean and s.e.m. of Ripley function; DMSO n=95 nuclei, CK-666 n=80 nuclei).
Extended Data Fig. 4
Extended Data Fig. 4. WASP and Arp2/3 inactivation do not impair U2OS cell viability, nuclear area, nuclear sphericity or protein expression
a, Cell survival after 8 hours of 100 μM CK-666, 50 μM CK-548, or 3 μM Wiskostatin treatment. Data shown as mean and s.e.m. n=4 independent experiments. b, Cell survival after 48 hours of increasing concentrations of CK-666. n=3 independent experiments. Data shown as mean and s.e.m. c, Cell survival after 48 hours of increasing concentrations of CK-548. n=3 independent experiments. Data shown as mean and s.e.m. d, Representative cell-cycle distribution of cells treated with DMSO, 50 μM CK-666, or 25 μM CK-548 for 48 hours (out of three independent experiments). e, Analysis of nuclear sphericity (P calculated by Student’s two-tailed t-test; data shown as mean and s.d.; DMSO n=117 nuclei, CK-666 n=117 nuclei). ns, not significant. f, Analysis of nuclear area (P calculated by one-way ANOVA with multiple comparisons; data shown as mean and s.d.; DMSO n=210 nuclei, CK-548 n=189 nuclei, CK-666 n=92 nuclei). g, Expression of Rad51, DNA-PK(cs), WASP, and Arpc2 validating antibodies employed in Fig. 2e–i (single experiment). Mek2 is a loading control. RPA expression levels also shown.
Extended Data Fig. 5
Extended Data Fig. 5. Arp2/3 enhances movement of 53BP1 foci in G2
a, Representative U2OS nuclei showing 53BP1-YFP foci traces over 100 min in G1 cells b, Median cumulative distance traveled by 53BP1-YFP foci in G1 cells (P calculated by two-tailed Mann-Whitney test; CK-689 n=462 foci from 14 nuclei, CK-666 n=647 foci from 14 nuclei). ns, not significant. c, MSD of 53BP1-YFP foci in G1 cells (Data shown as mean and weighted s.e.m.; CK-689 n=926 foci from 14 nuclei, CK-666 n=1234 foci from 14 nuclei). Δt = time interval. d, A representative G1 cell is shown with 53BP1-YFP foci (left). A representative G2 cell is shown with 53BP1-YFP and Rad52-mCherry foci (right). 53BP1 foci colocalize with Rad52 foci (r = 0.41 ± 0.17, Pearson, n=5 independent experiments). e, Representative U2OS nuclei showing 53BP1-YFP foci traces over 100 min in G2 cells. f, MSD of 53BP1-YFP foci (Data shown as mean and weighted s.e.m.; G1 CK-689 n=926 foci from 14 nuclei, G2 CK-689 n=1403 from 12 nuclei). G1 CK-689 curve also shown in (c). g, MSD of 53BP1-YFP foci in G2 cells (Data shown as mean and weighted s.e.m.; CK-689 n=1403 foci from 12 nuclei, CK-666 n=1038 foci from 10 nuclei). G2 CK-689 curve also shown in (f).
Extended Data Fig. 6
Extended Data Fig. 6. Arp2/3 promotes actin foci assembly following DNA damage
a, Representative U2OS nuclei showing classes of nuclear actin structures following transient transfection of nuclear actin-chromobody-tag-GFP. b, Percentage of cells with diffuse signal, nuclear actin-cb foci, or rods with or without NCS (DMSO n=473 cells, NCS n=473 cells). c, MSD of actin-cb foci and actin-cb rods (Data shown as mean and weighted s.e.m.; actin-cb foci n=662 foci from 11 nuclei, actin-cb rods n=161 rods from 5 nuclei). d, Representative images of U2OS nuclei with actin rods or actin-cb foci following CK-666 treatment (n=5 independent experiments). e, Representative image of a U2OS nucleus with RPA-mCherry and actin-cb foci (of n=3 independent experiments). Arrowheads indicate sites of RPA-mCherry and actin-cb co-localization. f, Expanded image of RPA-mCherry and actin-cb co-localization from e, red box. Traces of RPA and actin-cb foci are shown in red. Yellow and purple circles encompass RPA and actin-cb foci, respectively. (n=3 independent experiments).
Extended Data Fig. 7
Extended Data Fig. 7. WASP and Arp2/3 mediate DSB repair by homology-directed mechanisms
a, Representative FACS plots of GFP+ cells in the HDR (DR-GFP) assay. b, Western blot shows expression of WASP and N-WASP following siRNA knockdown in whole cell lysates (single experiment). WASP siRNA 1: 5′-GAGUGGCUGAGUUACUUGC-3′. c, Representative FACS plots of GFP+ cells in the HDR (DR-GFP) assay in WASP and mock-depleted cells. d, Summary of DR-GFP assay with WASP depletion (P calculated by one-way ANOVA with multiple comparisons; data shown as mean and s.e.m; n=3 independent experiments). HDR efficiency in the presence of DMSO or Wiskostatin (Fig. 5a) shown for comparison. e, Representative FACS plots of GFP+ cells in the SSA (SA-GFP) assay. f, Representative FACS plots of GFP+ cells in the MMEJ (EJ2-GFP) assay. g, Representative FACS plots of GFP+ cells in the NHEJ (EJ5-GFP) assay. h, Summary of DR-GFP, SA-GFP, and EJ5-GFP assays with CK-689 (P calculated by two-way ANOVA with multiple comparisons; data shown as mean and s.d.; n=3 independent experiments). n.s = not significant.
Extended Data Fig. 8
Extended Data Fig. 8. Actin nucleation regulates HDR in the nucleus and does not require formin-2 activity
a, Western blot shows expression of mCherry-tagged actin constructs in U2OS whole cell lysates (single experiment). b, Summary of DR-GFP (HDR) assay (P calculated by one-way ANOVA with multiple comparisons; data shown as mean and s.e.m; n=6 independent experiments). c, Western blot shows knockdown of formin-2 following 48 hr transfection of mock or sequence-specific siRNA oligos (single experiment). Formin-2 siRNA #2: 5′-CGUGUAAUCAGAAUGCCCA-3′. d, Summary of DR-GFP assay (P calculated by one-way ANOVA with multiple comparisons; data shown as mean and s.e.m; n=3 independent experiments). e, Mean cell survival after 48 hours of increasing concentrations of the formin inhibitor, SMIFH2 (n=3 independent experiments). f, Summary of DR-GFP assay (P calculated by student’s two-tailed t-test; data shown as mean and s.e.m; n=3 independent experiments).
Extended Data Fig. 9
Extended Data Fig. 9. B-lymphocytes derived from Wiskott-Aldrich Syndrome patients exhibit reduced DSB end-resection
a, Representative cell cycle distribution of CB33 and RD lymphocytes derived from healthy controls following DMSO treatment is shown (left). The percentage RPA positive S-phase cells following DMSO treatment was measured by flow cytometry (right). (n=4 independent experiments). b, Representative cell cycle distribution of lymphocytes bearing the V75M mutation in the WAS gene or a G>A transition at position 5 in intron 6 of the WAS gene (IVS6+5G>A) is shown following DMSO treatment (left). The percentage RPA positive S-phase cells following DMSO treatment was measured by flow cytometry (right). (n=4 independent experiments). c, Representative cell cycle distribution of CB33 and RD lymphocytes derived from healthy controls following CPT treatment (left). The percentage RPA positive S-phase cells following CPT treatment was measured by flow cytometry (right). (n=4 independent experiments). d, The cell cycle distribution of V75M or IVS6+5G>A lymphocytes following CPT treatment is shown (left). The percentage RPA positive S-phase cells following CPT treatment was measured by flow cytometry (right). (n=4 independent experiments).
Extended Data Fig. 10
Extended Data Fig. 10. Arp2/3 inactivation confers sensitivity to DSBs induced in S-phase as well as replication stress-inducing agents
a, Control CB33 lymphocytes or lymphocytes bearing a V75M mutation in the WAS gene were treated with camptothecin (CPT) for 0, 12, or 24 hours. Percent viability following CPT treatment was assessed by measuring the fraction of Annexin V and propidium iodide negative cells by flow cytometry. b, Summary of CB33 or WAS V75M lymphocyte survival following CPT treatment (P calculated by two-way ANOVA with multiple comparisons; data shown as mean and s.d.; n=3 independent experiments) c, Clonogenic U2OS cell survival after 12 hr of camptothecin treatment in the presence of DMSO or increasing concentrations of CK-666. (Triplicate experiments; data shown as mean and s.d.; n=2 independent experiments). d, Clonogenic U2OS cell survival after 12 hr of aphidicolin treatment in the presence of DMSO or increasing concentrations of CK-666. (Triplicate experiments; data shown as mean and s.d.; n=2 independent experiments). e, Clonogenic U2OS cell survival after olaparib treatment in the presence of DMSO or increasing concentrations of CK-666 for 14 days. (Triplicate experiments; data shown as mean and s.e.m.; n=2 independent experiments). f, DNA damage induces DSBs, which are repaired preferentially by NHEJ in mammalian cells (in blue). In S/G2, DSBs may be repaired by HDR (in red). All DSBs recruit WASP, but Arp2/3-dependent actin polymerization occurs only at HDR breaks, which become more mobile. Actin polymerization in the vicinity of DSBs generates forces resulting in DSB clustering, optimal DNA end resection, Rad51 foci formation, and HDR.
Figure 1
Figure 1. Actin complexes are recruited to damaged chromatin
a, Enrichment of actin complexes in damaged chromatin (+PflMI) by Western blot. Mre11 indicates DNA damage. b, Protein quantification in chromatin relative to +PflMI samples. (P calculated by one-way ANOVA with multiple comparisons; data shown as mean and s.d.; n=5, 3, and 4 independent experiments, left to right).
Figure 2
Figure 2. Arp2/3 and WASP co-localize at HDR breaks
a, Representative U2OS cells with WASP foci. b, Quantification of WASP foci (P calculated by two-sided Mann-Whitney test; data shown as mean and s.d.; n=1231 (DMSO), 1327 nuclei (NCS). c, γH2AX co-localization with WASP (n=30 nuclei; r=0.60±0.07, Pearson). d, Cell cycle distribution of synchronized ER-AsiSI-U2OS cells post thymidine release. DNA-PKcs (e,) Rad51 (f,) WASP (g,) and Arpc2 (h,) enrichment (ChIP) at DSBs I–IV in G1 and G2. Mean and s.d. (n=3 technical replicates) of a representative experiment (out of two independent experiments). i, Mean and s.d. of Arpc2 and WASP enrichment at an undamaged site in G2 cells (n=3 technical replicates) of a representative experiment (out of two independent experiments). Scale bar is 10 μm.
Figure 3
Figure 3. Arp2/3 drives DSB mobility during HDR
a, A representative U2OS nucleus with boxes indicating Rad52-mCherry foci clustering events. b, Expanded images of clustering from a, red box. Circles denote foci intensity. c, Rad52 foci size (P calculated by one-way ANOVA with multiple comparisons; data shown as mean and s.e.m.; n=19 (DMSO), 17 nuclei (CK-666). d, Rad52-mCherry clustering events (P calculated by two-tailed Mann-Whitney test; data shown as mean and s.e.m.; n=17 (DMSO), 16 nuclei (CK-666). e, Rad52-mCherry foci traces over 100 min. Expanded images of boxed tracks (right). f, Median cumulative distance traveled by Rad52-mCherry foci. P calculated by two-tailed Mann-Whitney test; n=1120 foci from 13 nuclei (CK-689), 720 foci from 12 nuclei (CK-666). g, Mean square displacement (MSD) of Rad52-mCherry foci. Data shown as mean and weighted s.e.m.; n=3262 foci from 13 nuclei (CK-689), 2143 foci from 12 nuclei (CK-666). Δt=time interval. h, pEGFP-RPA32-NLS foci clustering in MTFs. i, RPA32-pEGFP-NLS foci traces over 100 min. j, Arpc2 protein levels in whole-cell lysates from Arpc2-LoxP-CreER MTFs (single experiment). k, Median cumulative distance traveled by RPA32-pEGFP-NLS foci. P calculated by one-way ANOVA with multiple comparisons; n=381 foci from 13 nuclei (CK-689), 370 foci from 12 nuclei (CK-666), 425 from 13 nuclei (4-OHT). l, RPA32-pEGFP-NLS foci MSD (Data shown as mean and weighted s.e.m.; n=790 foci from 13 nuclei (CK-689), 823 foci from 12 nuclei (CK-666), 1135 foci from 13 nuclei (4-OHT). Scale bar is 5 μm or as indicated.
Figure 4
Figure 4. Nuclear actin foci cluster and localize to HDR sites
a, Representative images of U2OS nuclei transfected with nuclear actin-chromobody-tag-GFP (actin-cb). Boxes indicate clustering events. b, Percentage of actin-cb foci positive cells (P calculated by Student’s two-tailed t-test; data shown as mean and s.d.; n=473 nuclei (DMSO), 473 nuclei (NCS). c, Expanded images of a clustering event from (a, red box). Circles denote foci intensity. d, Representative traces of actin-cb foci (out of 3 independent experiments) over 10 min. e, MSD of actin-cb foci (Data shown as mean and weighted s.e.m.; DMSO n=662 foci from 11 nuclei). f, Representative images of a U2OS nucleus with actin-cb foci following CK-666 treatment. g, Quantification of actin-cb foci prior to and post CK-666 treatment (P calculated by paired two-tailed t-test; data shown as mean and s.e.m.; n=10 nuclei from 2 independent experiments). h, Representative images of a U2OS nucleus showing Rad51 co-localization with actin-cb foci. The percentage of Rad51 foci that overlap or touch actin-cb foci shown (n=12 nuclei). i, Representative images of a U2OS nucleus (from five independent experiments) showing traces of RPA32-mCherry-NLS foci (red) and actin-cb foci (green). Scale bar is 5 μm or as shown.
Figure 5
Figure 5. WASP and Arp2/3 mediate HDR
a, Summary of DR-GFP (HDR) assay (n=10, 6, 4, 4 left to right). ns, not significant. b, Summary of SA-GFP (SSA) assay (n=7, 4, 4, 3 left to right). c, Summary of EJ2-GFP (MMEJ) assay (n=4, 3, 3, 3, left to right). d, Summary of EJ5-GFP (NHEJ) assay (n=14, 6, 6, 3, left to right). e, Western blot shows FLAG-WT-NLS or FLAG-R62D-NLS overexpression in U2OS nuclear soluble fraction (single experiment). f, DR-GFP assay in cells transfected with FLAG-WT-NLS or FLAG-R62D-NLS. (n=7, 7, 7, left to right). HDR efficiency in the presence of DMSO or CK-666 (Fig. 5a) shown for comparison. g, EJ5-GFP assay in cells transfected with FLAG-WT-NLS or FLAG-R62D-NLS. (n=6, 6, 6, left to right). For 5a–g, P calculated by one-way ANOVA with multiple comparisons as indicated; data shown as mean and s.e.m. n represents independent experiments.
Figure 6
Figure 6. Arp2/3 facilitates resection and repair in G2
a, DSB repair at DSBs V-VI in G1-synchronized, ER-AsiSI-AID U2OS cells. Mean and s.d. (n=3 technical replicates) of a representative experiment shown. b, DSB repair at DSBs V-VI in G2-synchronized ER-AsiSI-AID U2OS cells. Mean and s.d. (n=3 technical replicates) of a representative experiment shown. c, Enrichment of single-stranded DNA (ssDNA) at DSBs V–VI following CK-548 treatment. (Data shown as mean and s.d., n=6 replicates from 2 independent experiments). d, Representative images of U2OS nuclei showing Rad51 foci. e, Quantification of Rad51 foci (P calculated by one-way ANOVA with multiple comparisons; smoothed traces show distribution of Rad51 foci. Arrow above respective curves indicates mean number of foci per cell; DMSO: 2 hours n=1830 cells, 8 hours n=2440 cells, 24 hours n=782 cells, CK-666: 2 hours n=2438 cells, 8 hours n=2189 cells, 24 hours n=912 cells). f, Representative images of Arpc2-LoxP-CreER MTF nuclei showing Rad51 foci. g, Quantification of Rad51 foci in MTFs (P calculated by two-tailed Mann-Whitney test; data shown as mean; n=571 nuclei (DMSO), 462 nuclei (4-OHT). h, Representative ssDNA enrichment at DSBs V–VI following mirin treatment. (Data shown as mean and s.d.; n=3 replicates of 2 independent experiments). ssDNA in DMSO-treated cells (Fig. 5c) shown for comparison. i, MSD of Rad52-mCherry foci (Data shown as mean and weighted s.e.m.; DMSO n=3292 foci from 12 cells, Mirin n=2677 foci from 11 cells). j, MSD of 53BP1-YFP foci in G1 cells (Data shown as mean and weighted s.e.m.; DMSO n=893 foci from 12 cells, Mirin n=744 foci from 14 cells). k, Quantification of chromatin-bound RPA in S-phase cells (P calculated by two-way ANOVA with multiple comparisons; data shown as mean and s.e.m.; n=4 independent experiments).

Comment in

  • Breakdancing on actin.
    Strzyz P. Strzyz P. Nat Rev Mol Cell Biol. 2018 Aug;19(8):485. doi: 10.1038/s41580-018-0036-8. Nat Rev Mol Cell Biol. 2018. PMID: 29967438 No abstract available.
  • Breakdancing on actin.
    Strzyz P. Strzyz P. Nat Rev Genet. 2018 Aug;19(8):469. doi: 10.1038/s41576-018-0033-y. Nat Rev Genet. 2018. PMID: 29967492 No abstract available.

References

    1. Dion V, Kalck V, Horigome C, Towbin BD, Gasser SM. Increased mobility of double-strand breaks requires Mec1, Rad9 and the homologous recombination machinery. Nat Cell Biol. 2012;14:502–509. doi: 10.1038/ncb2465. - DOI - PubMed
    1. Mine-Hattab J, Rothstein R. Increased chromosome mobility facilitates homology search during recombination. Nat Cell Biol. 2012;14:510–517. doi: 10.1038/ncb2472. - DOI - PubMed
    1. Lisby M, Mortensen UH, Rothstein R. Colocalization of multiple DNA double-strand breaks at a single Rad52 repair centre. Nat Cell Biol. 2003;5:572–577. doi: 10.1038/ncb997. - DOI - PubMed
    1. Aten JA, et al. Dynamics of DNA double-strand breaks revealed by clustering of damaged chromosome domains. Science. 2004;303:92–95. doi: 10.1126/science.1088845. - DOI - PubMed
    1. Aymard F, et al. Genome-wide mapping of long-range contacts unveils clustering of DNA double-strand breaks at damaged active genes. Nat Struct Mol Biol. 2017;24:353–361. doi: 10.1038/nsmb.3387. - DOI - PMC - PubMed

Publication types