. 2018 Jun;558(7711):620-623.
doi: 10.1038/s41586-018-0241-9. Epub 2018 Jun 20.

Cryo-EM structure of the serotonin 5-HT1B receptor coupled to heterotrimeric Go

Affiliations

Cryo-EM structure of the serotonin 5-HT1B receptor coupled to heterotrimeric Go

Javier García-Nafría et al. Nature. 2018 Jun.

Abstract

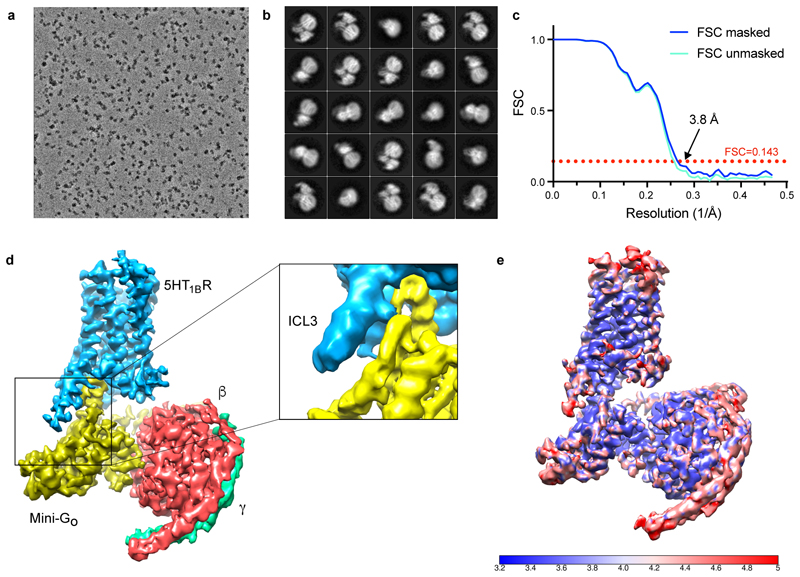
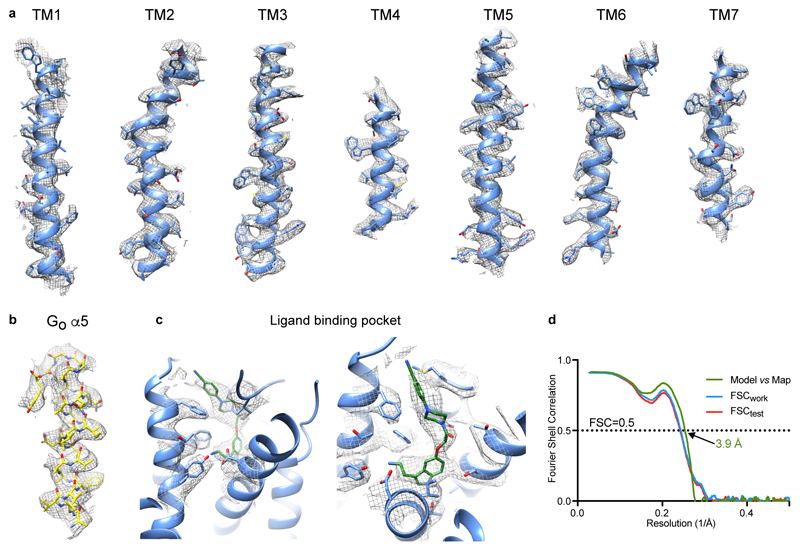
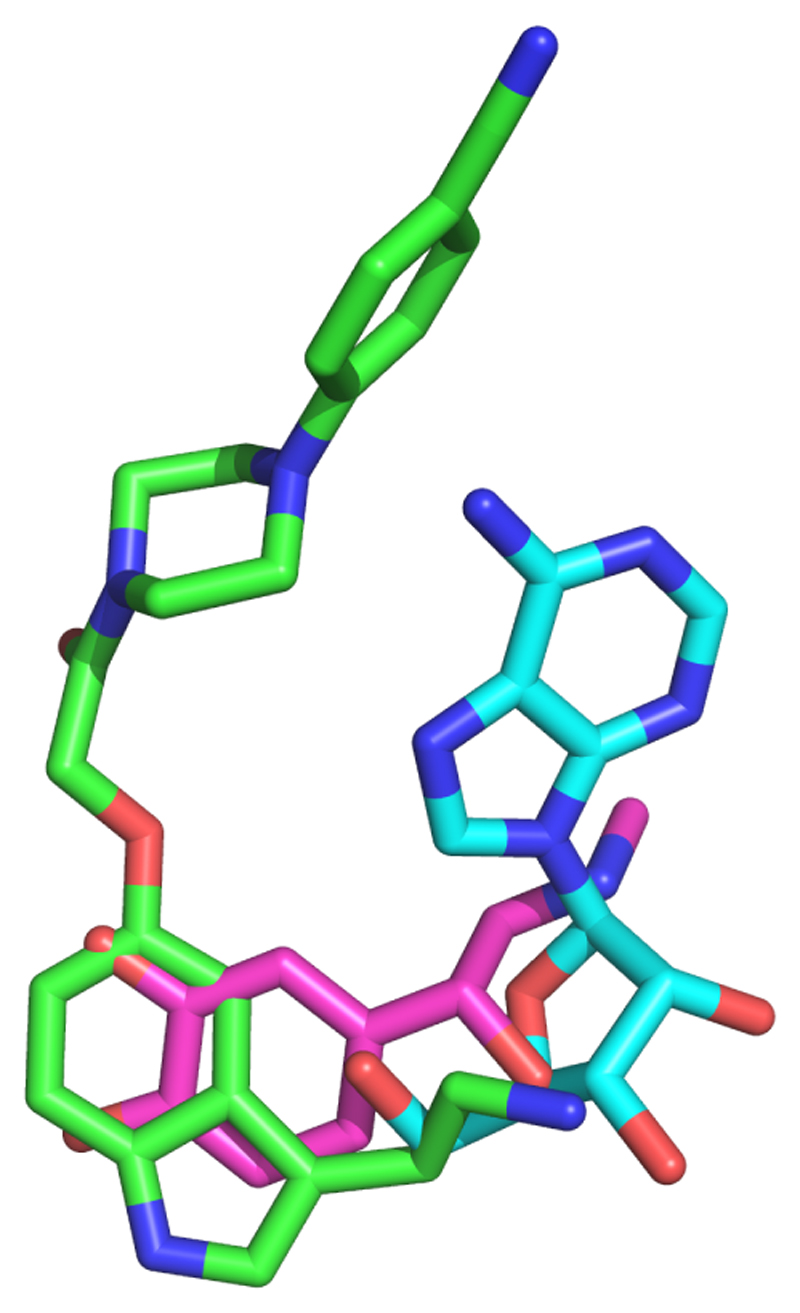
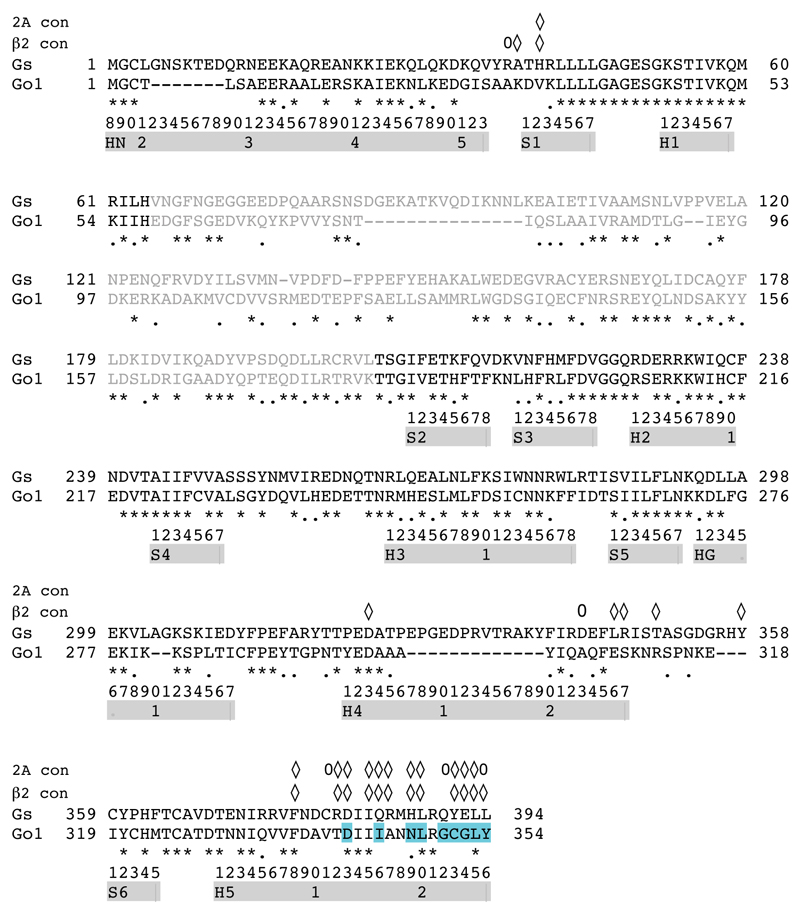
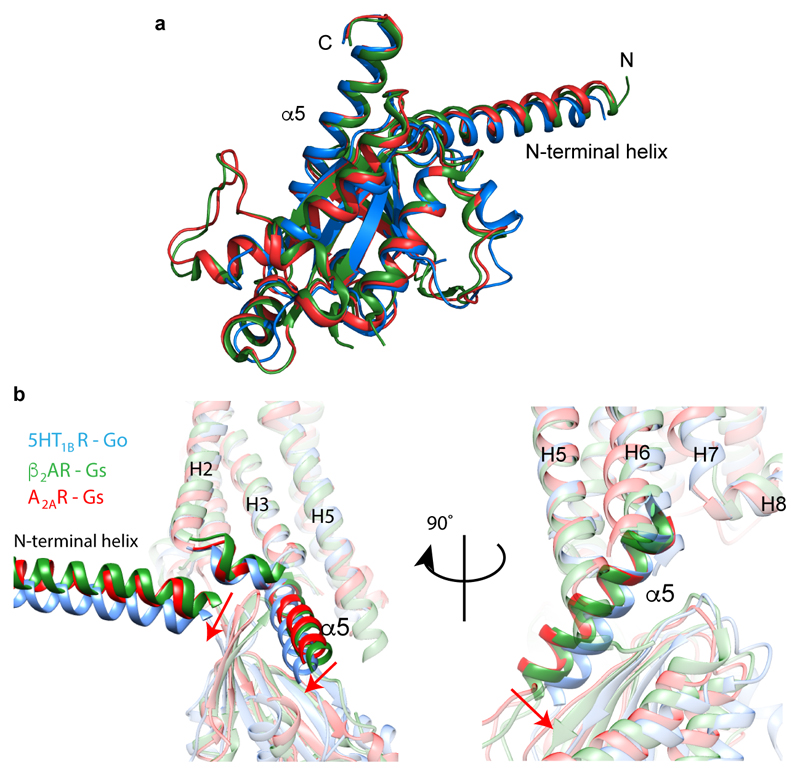
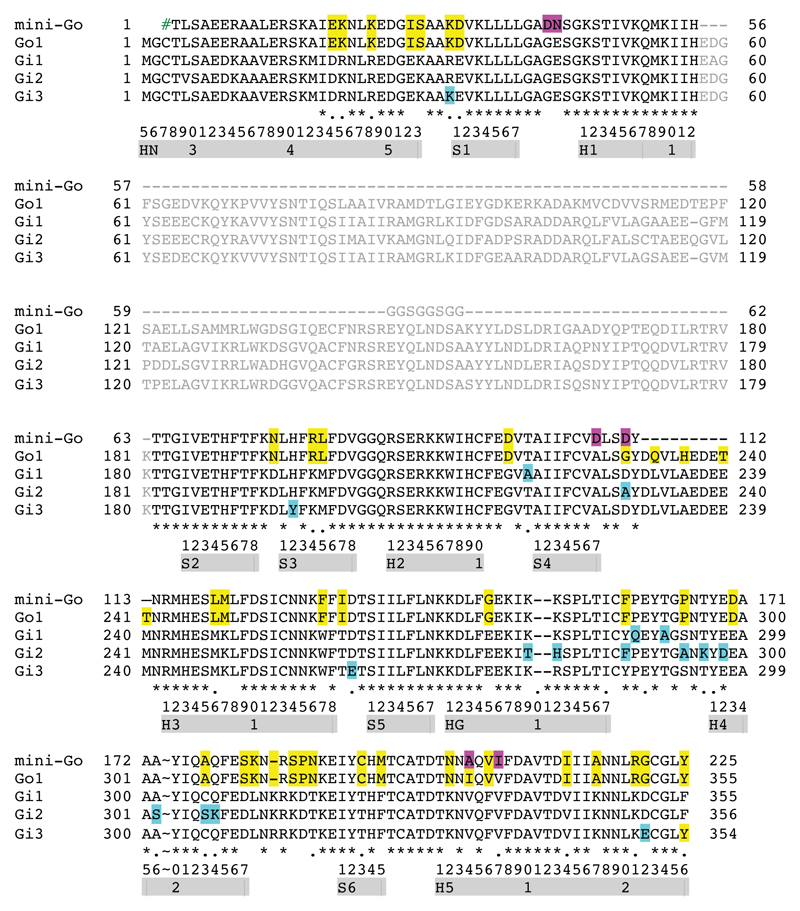
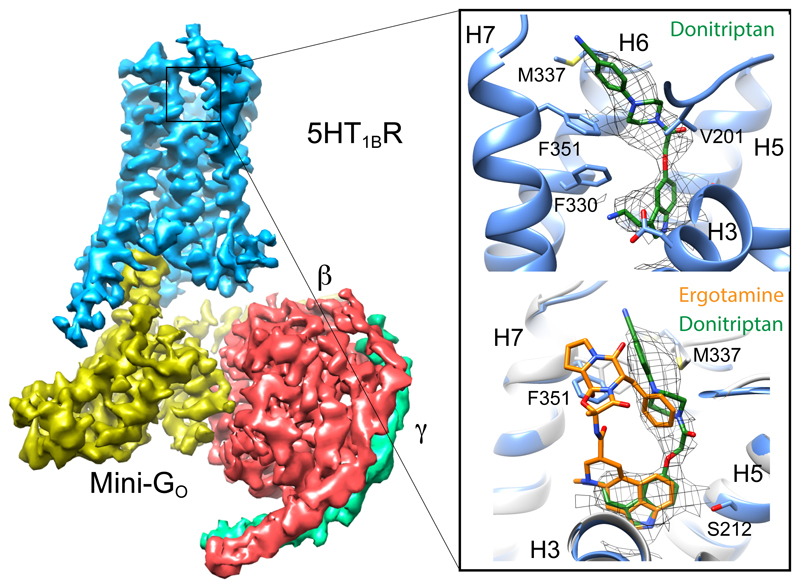
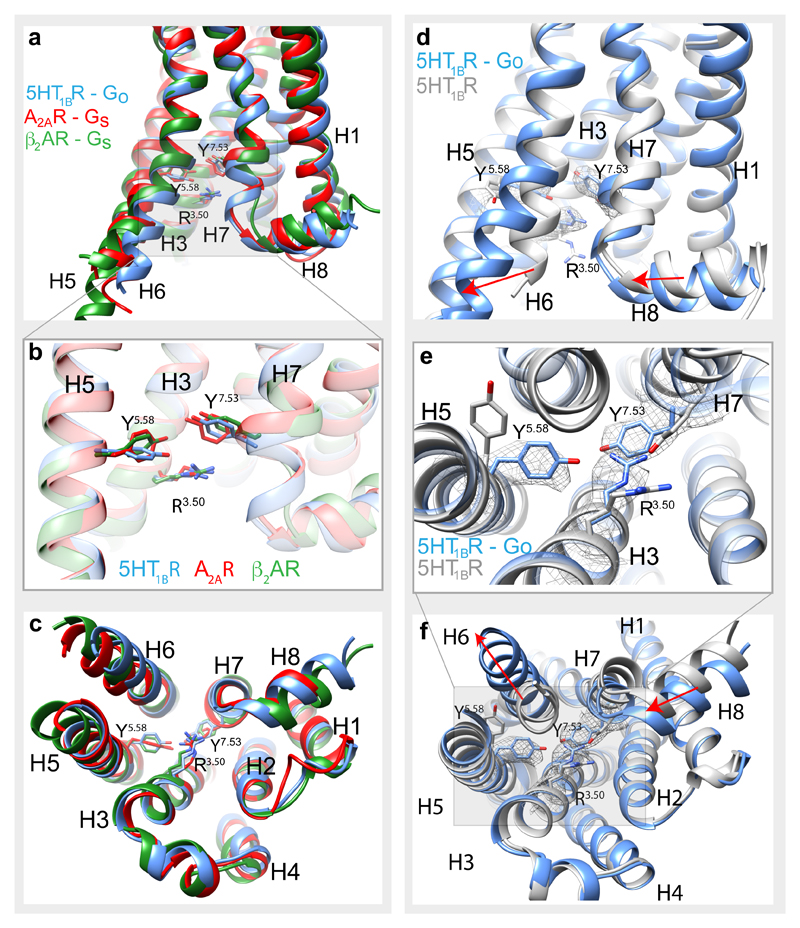
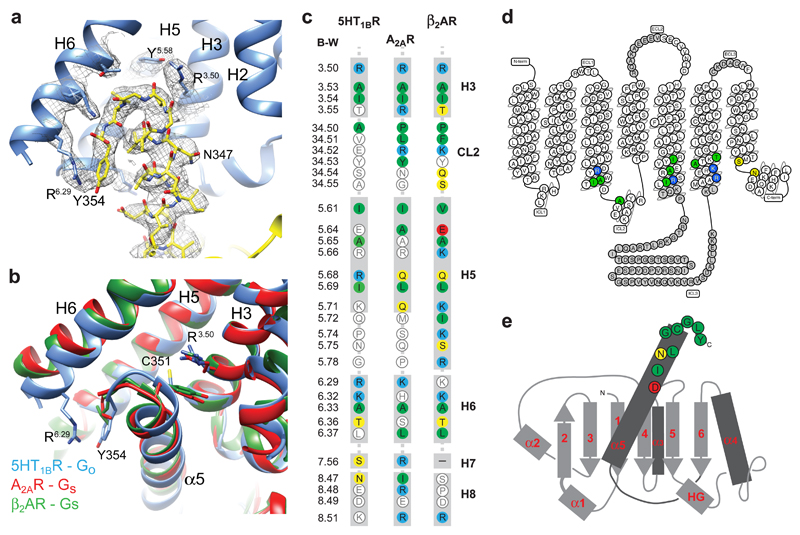
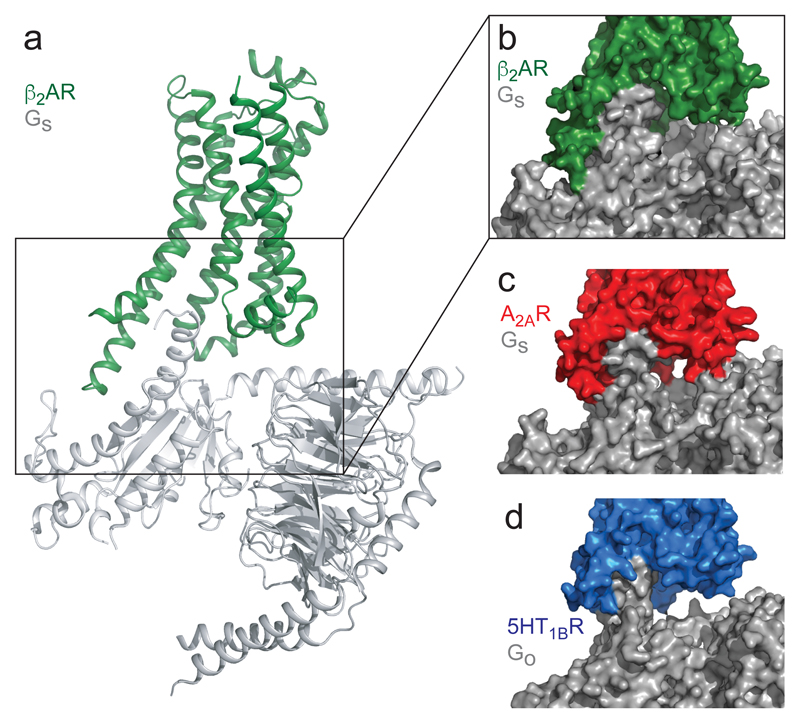
G-protein-coupled receptors (GPCRs) form the largest family of receptors encoded by the human genome (around 800 genes). They transduce signals by coupling to a small number of heterotrimeric G proteins (16 genes encoding different α-subunits). Each human cell contains several GPCRs and G proteins. The structural determinants of coupling of Gs to four different GPCRs have been elucidated1-4, but the molecular details of how the other G-protein classes couple to GPCRs are unknown. Here we present the cryo-electron microscopy structure of the serotonin 5-HT1B receptor (5-HT1BR) bound to the agonist donitriptan and coupled to an engineered Go heterotrimer. In this complex, 5-HT1BR is in an active state; the intracellular domain of the receptor is in a similar conformation to that observed for the β2-adrenoceptor (β2AR) 3 or the adenosine A2A receptor (A2AR) 1 in complex with Gs. In contrast to the complexes with Gs, the gap between the receptor and the Gβ-subunit in the Go-5-HT1BR complex precludes molecular contacts, and the interface between the Gα-subunit of Go and the receptor is considerably smaller. These differences are likely to be caused by the differences in the interactions with the C terminus of the Go α-subunit. The molecular variations between the interfaces of Go and Gs in complex with GPCRs may contribute substantially to both the specificity of coupling and the kinetics of signalling.


Conflict of interest statement

The authors declare the following competing interests: CGT is a shareholder, consultant and member of the Scientific Advisory Board of Heptares Therapeutics, who also partly funded this work.

Figures

Extended Data Figure 1
Extended Data Figure 1. Cryo-EM single particle reconstruction of the 5-HT1BR–GO complex structure.
a, Representative micrograph (magnification 75,000x, defocus -0.6 μm) of the 5-HT1BR–GO complex collected using a Titan Krios with the Falcon III detector and Volta phase plate. b, Representative 2D class averages of the 5-HT1BR–GO complex. c, FSC curve of the final reconstruction showing an overall resolution of 3.8 Å using the gold-standard FSC of 0.143. Both masked and unmasked FSC curves are shown to highlight the lack of masking artefacts. d, Final reconstruction coloured by subunit showing a zoom on the weak density for ICL3. The zoomed region corresponds to a map sharpened with B = -50 to remove noise from lower density levels. e, Local resolution estimation of the 5-HT1BR map as calculated by Resmap.
Extended Data Figure 2
Extended Data Figure 2. Cryo-EM map quality and model validation.
a, transmembrane helices of 5-HT1BR; b, the α5 helix of GO; c, donitriptan and the neighbouring side chains in the orthosteric binding site; d, Fourier shell correlation of the refined model versus the map (green curve) and FSCwork/FSCtest validation curves (blue and red curves, respectively).
Extended Data Figure 3
Extended Data Figure 3. Flow-chart of data processing.
Micrographs were collected during nine sessions on the Titan Krios (either 24 h or 48 h) and each session was processed independently. The number of images and particles for one 48 h session is indicated on the flowchart as a guide. At the bottom of the figure, the final number of particles is shown. Each dataset was corrected separately for drift, beam induced motion and radiation damage. After CTF estimation, particles were picked using a Gaussian blob and submitted to either one or two rounds of reference-free 2D classification (see Methods). A 3D classification was performed on the selected particles using an ab initio model generated from ten thousand particles. Classification was performed in parallel in three and four classes. The models with best features were refined on their own; if there were two classes of similar high quality, these were then re-refined together (the resolution of the models refers to that after refinement and calculation of gold-standard FSC=0.143). The set of particles that obtained the best map quality and resolution were saved and merged with the best particles from other datasets. A final model with 730,118 particles was refined and achieved a global resolution of 3.78 Å.
Extended Data Figure 4
Extended Data Figure 4. Modelling quality of the 5-HT1BR structure.
a, Amino acid sequence of 5-HT1BR construct used in the cryo-EM structure determination. Residues are colored according to how they have been modelled: black, good density allows the side chain to be modelled; red, limited density for the side chain present and therefore the side chain has been truncated to Cβ; blue, no density observed and therefore the residue was not modelled. Regions highlighted in grey represent the transmembrane α-helices and amphipathic helix 8 is highlighted in yellow. b, Model of 5-HT1BR showing the Cα positions of amino acid residues with poor density (spheres) and regions unmodelled (dotted lines).
Extended Data Figure 5
Extended Data Figure 5. Superposition of donitriptan, adrenaline and adenosine.
5-HT1BR, β2AR3 and A2AR1 were superimposed (Pymol) over the whole of the receptor and the ligands coloured accordingly: green, donitriptan; pink, adrenaline; blue, adenosine.
Extended Data Figure 6
Extended Data Figure 6. Comparison of the amino acid sequences of the α subunits of GO and GS.
Diamonds above the sequences identify the amino acid residues in Gαs where the side chains that make atomic contacts to residues in either β2AR (β2 con) or A2AR (2A con). Ovals above the sequences identify the amino acid residues in Gαs where only the main chain atoms make contacts to the receptor. Secondary structural elements are indicated as grey bars and the CGN system of numbering is shown.
Extended Data Figure 7
Extended Data Figure 7. Similarity of Gα structures and the difference poses of the α5 helices in GαO and GαS coupled to receptors.
a, The structures of the α subunits coupled to 5-HT1BR, β2AR3 and A2AR1 were superimposed over the whole of their sequence in Pymol; blue, GαO coupled to 5-HT1BR; green, GαS coupled to A2AR; GαS coupled to β2AR. b, 5-HT1BR (blue), β2AR3 (green) and A2AR1 (red) were superimposed based on H3, H5 and H6. Two different views are shown with the red arrows indicating differences in orientation of GαS and GαO.
Extended Data Figure 8
Extended Data Figure 8. Alignment of the amino acid sequences of GO and Gi α subunits.
Sequences in grey correspond to the α-helical region that do not make contact to GPCRs and was deleted during the construction of mini-GO. Secondary structural elements are depicted as grey bars with the CGN system shown to aid comparisons. Amino acids are highlighted as follows: pink, stabilizing residues required to generate mini-GO; yellow; residues in GαO that are different from residues conserved in all three Gαi sequences; blue, residues that are non-conserved in Gαi sequences. # represents the affinity tag on mini-Go used for purification (MGHHHHHHENLYFQG).
Extended Data Figure 9
Extended Data Figure 9. Comparison between the α5 helices of GS and GO.
The α5 helices in the cryo-EM structures of A2AR-GS (carbon, green) and 5-HT1BR-GO (carbon, light blue) were aligned (Pymol) along their whole sequence and displayed in different poses: a, cartoon depiction; b, GS (green spheres), GO, (blue sticks); c, GO (blue spheres), GS, (green sticks).
Figure 1
Figure 1. Overall cryo-EM reconstruction of the 5-HT1BR–GO heterotrimer complex.
The density for the cryo-EM map (sharpened with a B factor of -200) is coloured according to the subunit. The inset shows the orthosteric binding pocket in 5-HT1BR (light blue) with donitriptan depicted as sticks (green, carbon) and its density in the cryo-EM map. The lower panel shows a superposition of ergotamine-bound 5-HT1BR (pale grey, PDB ID 4IAR) and donitriptan-bound 5-HT1BR (pale blue). Donitriptan (green, carbon) and ergotamine (orange, carbon) are depicted as sticks.
Figure 2
Figure 2. GO-coupled 5-HT1BR is in an active conformation.
a-c, Superposition of G protein-bound receptors: 5-HT1BR (blue), A2AR (red)1 and β2AR (green)3 based on H3, H5 and H6. Key amino acid residues involved in receptor activation are displayed as sticks. d-f, Superposition of GO-coupled 5-HT1BR (blue) and the active-intermediate state of 5-HT1BR bound to ergotamine (pale grey), based on alignment of the whole receptor. Conformational changes involved in receptor activation are highlighted (red arrows) and key residues are shown as sticks with the density from the cryo-EM map (mesh). a and d, view parallel to the membrane plane; b and e, enlarged view of the conserved core of the receptors; c and f, view from the cytoplasmic face of the membrane.
Figure 3
Figure 3. GO coupling to the 5-HT1BR.
a, C-terminal end of GαO (yellow sticks) inserted into the cytoplasmic cleft of 5-HT1BR (blue cartoon). Cryo-EM density is depicted as a mesh. b, Superposition of 5-HT1BR (blue), A2AR (red)1 and β2AR (green)3 based on alignment of H3, H5 and H6. The different poses of the C-termini of GS and GO coupled to the respective receptors are shown. c, Amino acid residues in 5-HT1BR, A2AR and β2AR that make contact to the respective Gα subunits they are coupled to are shown in colours that reflect biophysical properties of the residues; green, hydrophobic; yellow, hydrophilic, red, acidic; blue, basic. Residues coloured in white do not make contact to the relevant Gα. The amino acid alignment was created in GPCRdb and secondary structural elements and the Ballesteros-Weinstein numbers are depicted. d, Snake plot of 5-HT1BR created in GPCRdb with residues making contact to GαO coloured according to their biophysical properties. Regions in grey were disordered in the cryo-EM map. e, Cartoon of secondary structural elements in GαO and amino acid residues that make contact to 5-HT1BR are depicted and coloured according to their biophysical properties.
Figure 4
Figure 4. Comparison of GS coupling vs GO coupling.
a, Cartoon of β2AR (green) coupled to GS (PDB ID 3SN6). The α-helical domain of the Gα has been removed for clarity. b-d, surface rendered views of the interface between a receptor and G protein: b, β2AR (green) and GS; c, A2AR1 (red) and GS; d, 5-HT1BR (blue) and GO.

Comment in

References

    1. García-Nafría J, Lee Y, Bai X, Carpenter B, Tate CG. Cryo-EM structure of the adenosine A2A receptor coupled to an engineered heterotrimeric G protein. eLife. 2018;7:e35946. - PMC - PubMed
    1. Liang YL, et al. Phase-plate cryo-EM structure of a class B GPCR-G-protein complex. Nature. 2017;546:118–123. - PMC - PubMed
    1. Rasmussen SG, et al. Crystal structure of the beta2 adrenergic receptor-Gs protein complex. Nature. 2011;477:549–555. - PMC - PubMed
    1. Zhang Y, et al. Cryo-EM structure of the activated GLP-1 receptor in complex with a G protein. Nature. 2017;546:248–253. - PMC - PubMed
    1. Syrovatkina V, Alegre KO, Dey R, Huang XY. Regulation, Signaling, and Physiological Functions of G-Proteins. Journal of molecular biology. 2016;428:3850–3868. - PMC - PubMed

Publication types

MeSH terms