. 2018 Jun;558(7711):610-614.
doi: 10.1038/s41586-018-0238-4. Epub 2018 Jun 20.

A naturally occurring antiviral ribonucleotide encoded by the human genome

Affiliations

A naturally occurring antiviral ribonucleotide encoded by the human genome

Anthony S Gizzi et al. Nature. 2018 Jun.

Erratum in

Abstract

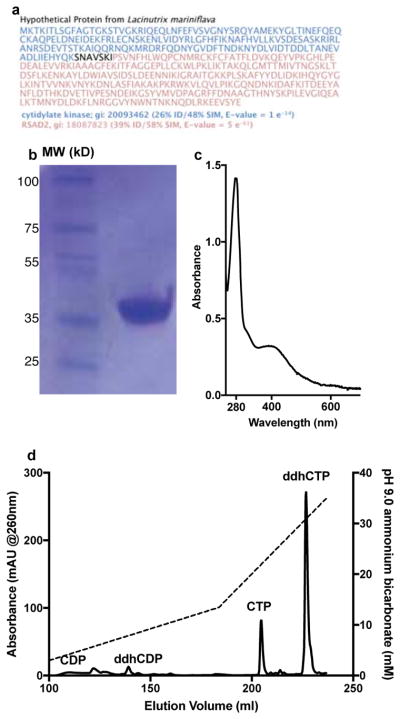
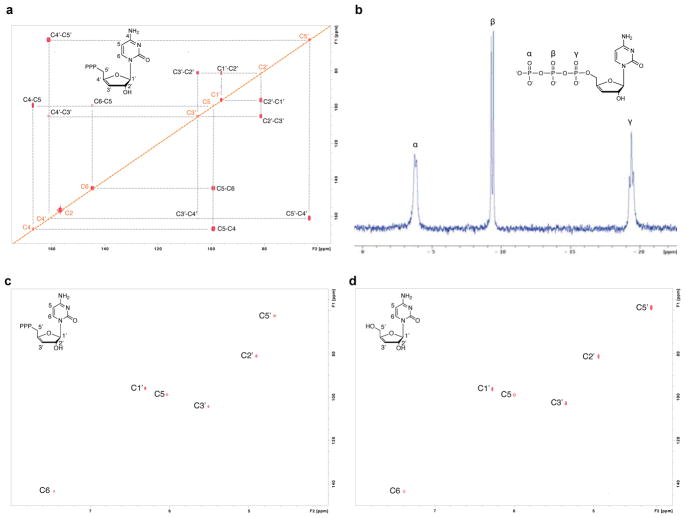
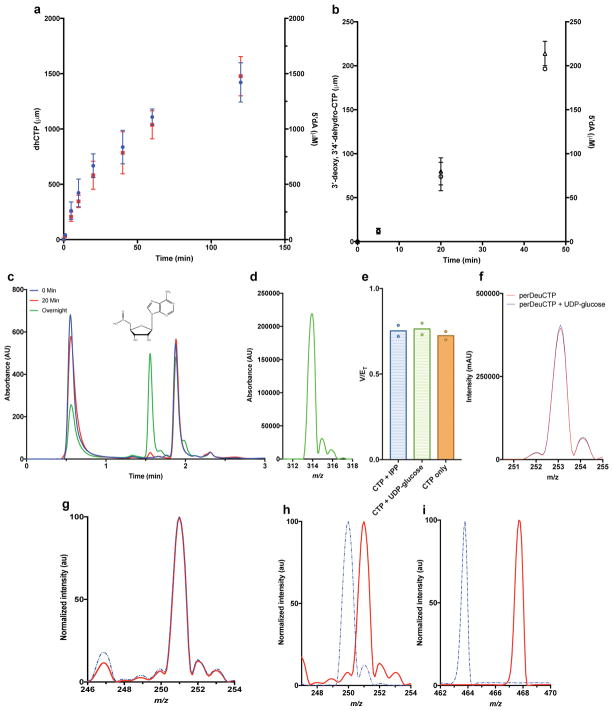
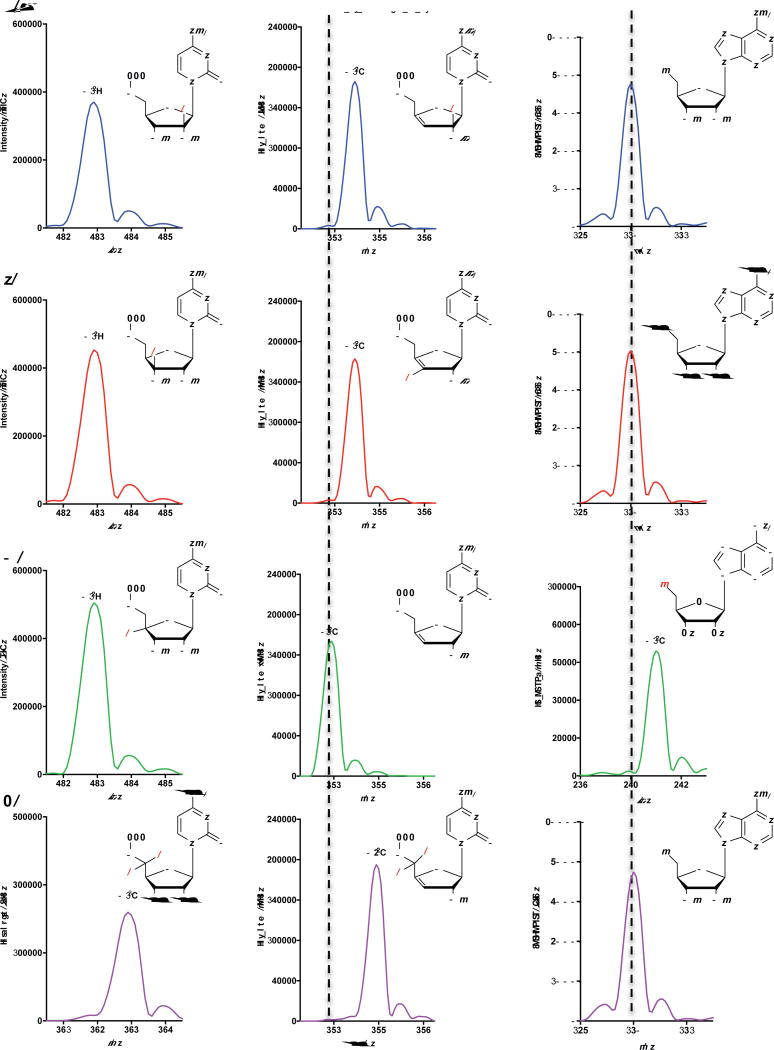
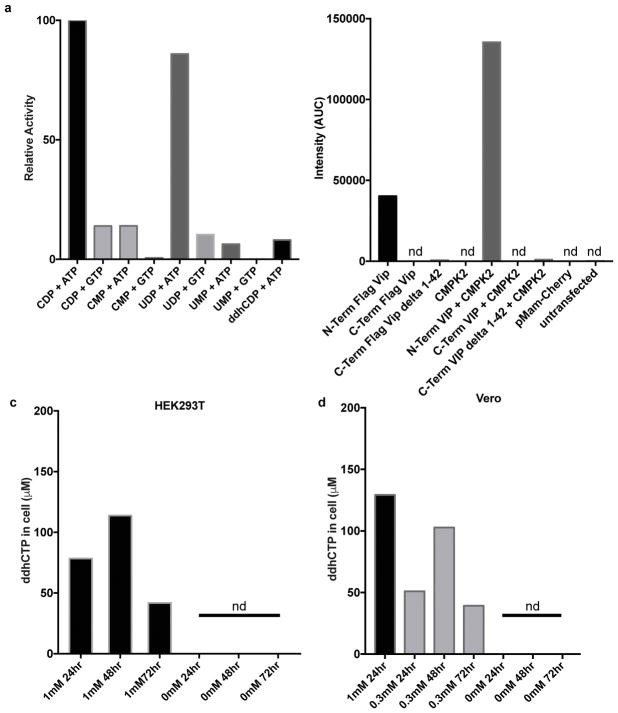
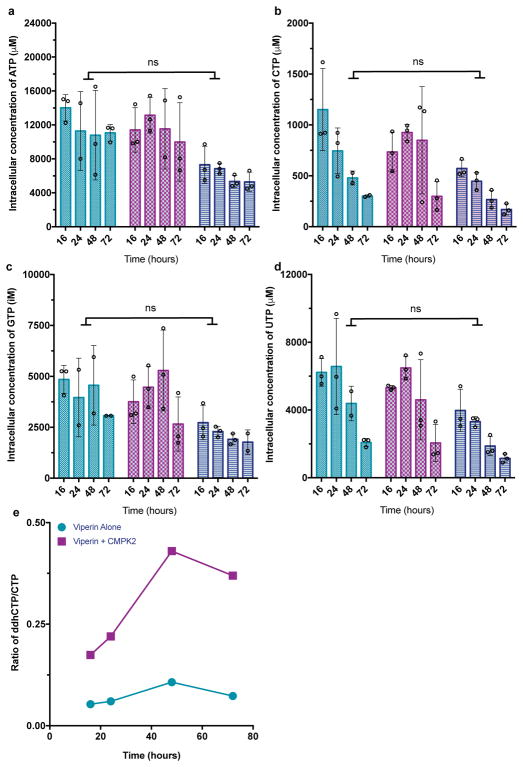
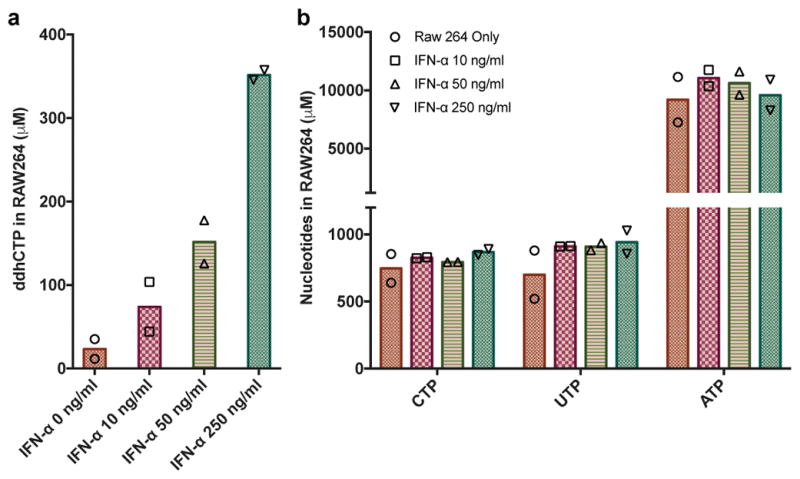
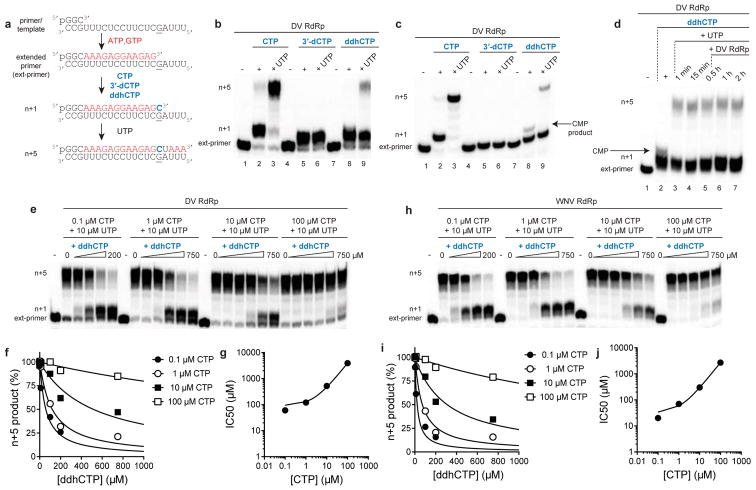
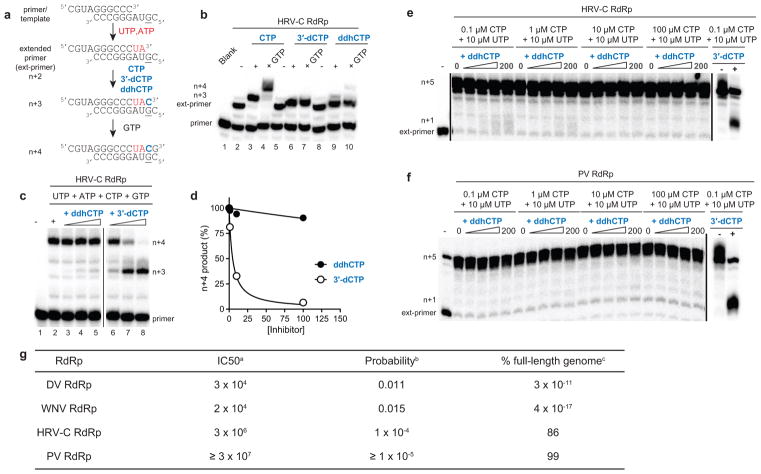
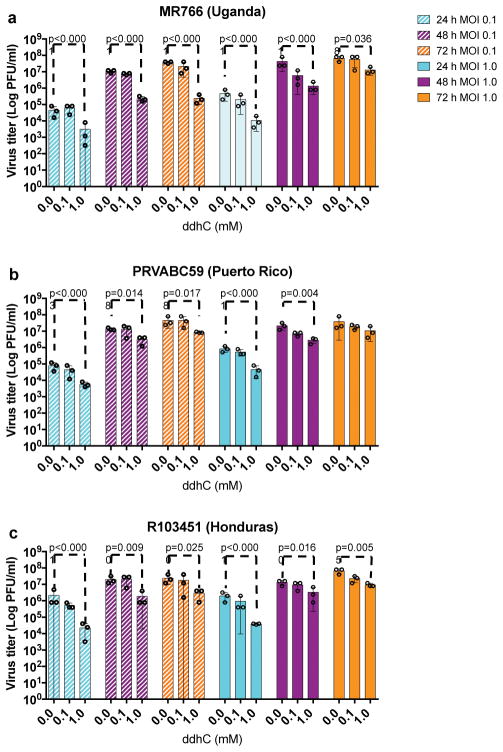
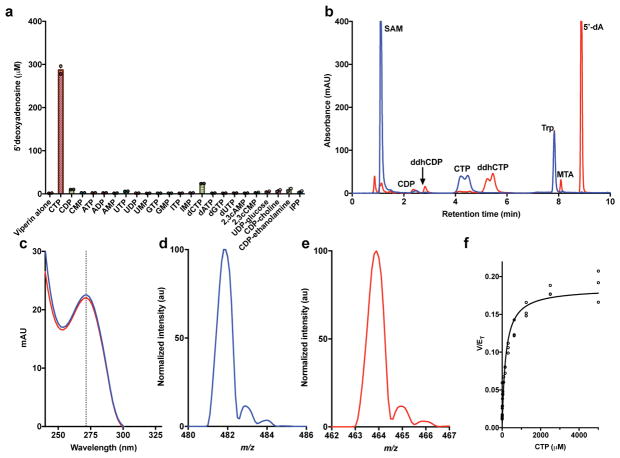
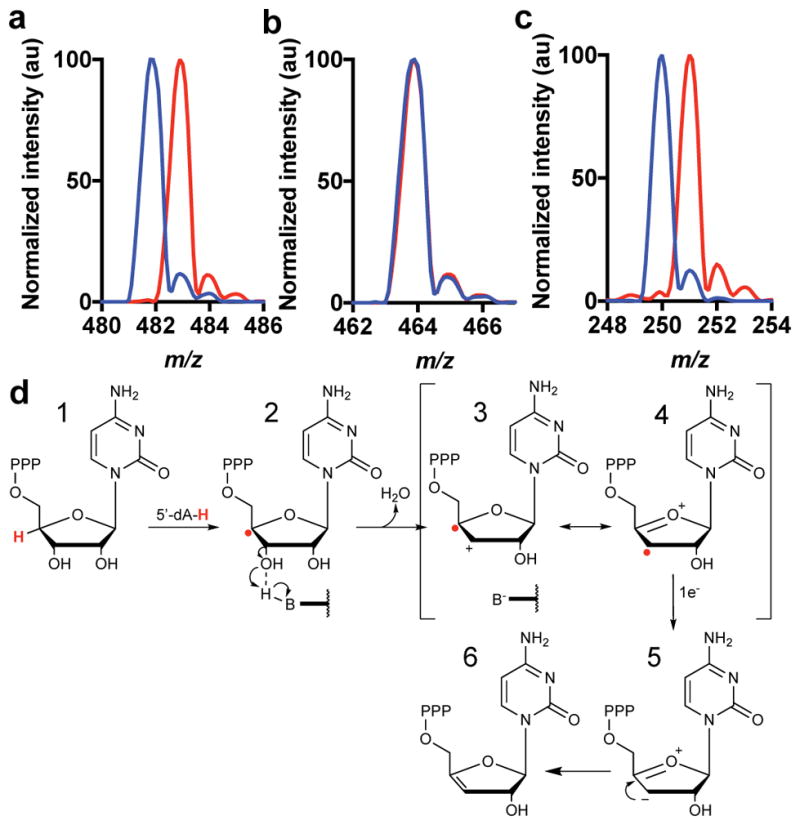
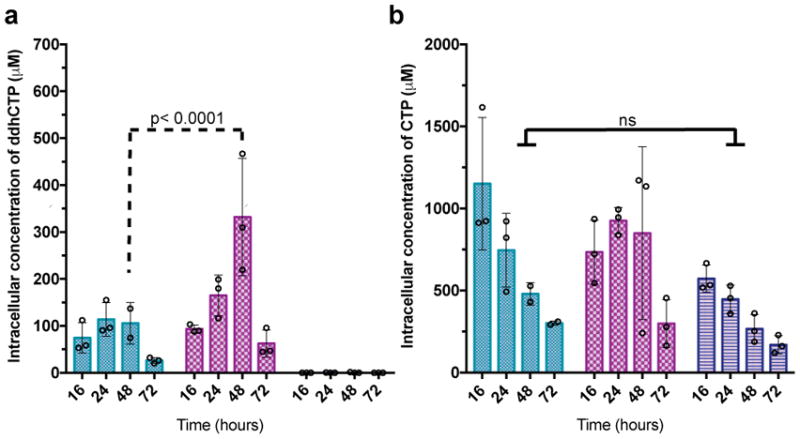
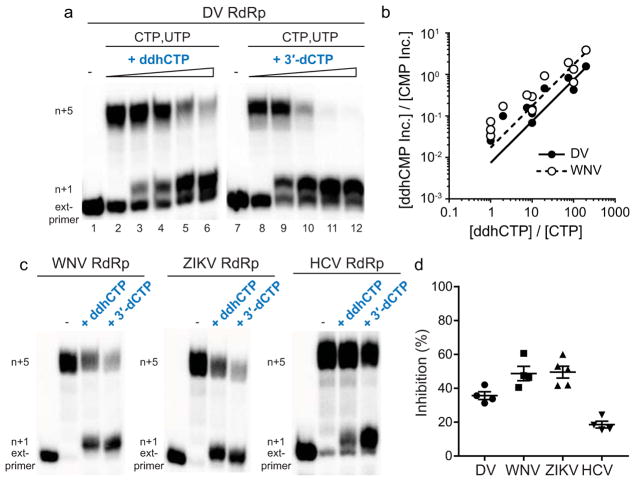
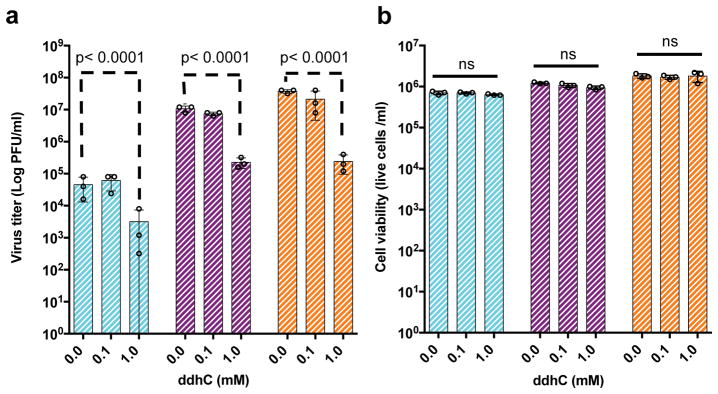
Viral infections continue to represent major challenges to public health, and an enhanced mechanistic understanding of the processes that contribute to viral life cycles is necessary for the development of new therapeutic strategies 1 . Viperin, a member of the radical S-adenosyl-L-methionine (SAM) superfamily of enzymes, is an interferon-inducible protein implicated in the inhibition of replication of a broad range of RNA and DNA viruses, including dengue virus, West Nile virus, hepatitis C virus, influenza A virus, rabies virus 2 and HIV3,4. Viperin has been suggested to elicit these broad antiviral activities through interactions with a large number of functionally unrelated host and viral proteins3,4. Here we demonstrate that viperin catalyses the conversion of cytidine triphosphate (CTP) to 3'-deoxy-3',4'-didehydro-CTP (ddhCTP), a previously undescribed biologically relevant molecule, via a SAM-dependent radical mechanism. We show that mammalian cells expressing viperin and macrophages stimulated with IFNα produce substantial quantities of ddhCTP. We also establish that ddhCTP acts as a chain terminator for the RNA-dependent RNA polymerases from multiple members of the Flavivirus genus, and show that ddhCTP directly inhibits replication of Zika virus in vivo. These findings suggest a partially unifying mechanism for the broad antiviral effects of viperin that is based on the intrinsic enzymatic properties of the protein and involves the generation of a naturally occurring replication-chain terminator encoded by mammalian genomes.


Conflict of interest statement

Competing interests

A.S.G., T.L.G., J.J.A., C.E.C., and S.C.A. are co-inventors on a U.S. provisional patent application (No. 62/548,425; filed by S.C.A) that incorporates discoveries described in this manuscript.

Figures

Extended data 1
Extended data 1. Purification of Rvip and ddhCTP
a, Amino acid sequence from Lacinutrix mariniflava fusion gene product of CMPK2- and viperin-like protein. b, SDS-PAGE analysis following affinity and size-exclusion chromatography. The protein corresponding to amino acid residues 51–361 has a predicted M.W. of 38.36 kDa. This construct was chosen because ~ 100 mg of protein could be purified from a 2 L fermentation. Also, the protein is soluble to concentration > 2 mM. c, UV-visible spectrum of purified Rvip (29.5 μM, UV 280/400 ratio of 4.2). d, Purification of ddhCTP using an ammonium bicarbonate, pH 9, with an elution gradient (dashed line) from 0.2M to 0.8M over 200 column volumes. All results have been repeated at least 3 times.
Extended data 2
Extended data 2. NMR spectroscopy of ddhCTP
a, 13C-13C COSY spectrum of 13C915N3-ddhCTP. The assignments for the observed correlations of the 13C-connectivities are indicated with the grey dotted lines. b, 31P NMR spectra (300MHz) of ddhCTP (1mM) in D2O at 300 K. Three resonance peaks at −19.5- (triplet), −9.5- (doublet) and −3.9- (doublet) p.p.m., correspond to the beta, alpha, and gamma phosphates of ddhCTP, respectively. c, 2D-HSQC NMR spectra collected on purified 1mM ddhCTP in D2O. d, 2D-HSQC NMR spectra collected on 1mM synthetic ddh-cytidine in D2O. All experiments have been repeated twice.
Extended data 3
Extended data 3. Rvip produces a 1:1 stoichiometry of 5′dA and ddhCTP and reacts specifically with CTP
a, Formation of ddhCTP (red squares) and 5′dA (blue circles) from CTP and SAM in the presence of dithionite and 100 μM RVip. ddhCTP is formed at roughly stoichiometric amounts with that of 5′dA. Error bars represent the mean ± SD of three replicates. b, Formation of ddhCTP (open triangle,) and 5′dA (open circle), from CTP and SAM in the presence of the flavodoxin, flavodoxin reductase and NADPH by 100 μM Rvip. Error bars represent the mean ± SD of three replicates. ddhCTP and 5′-dA is formed at roughly stoichiometric concentrations. The production of ddhCTP with this enzyme-driven reducing system indicates that ddhCTP formation is not the consequence of a side reaction with dithionite. c, HPLC analysis (0 minutes, blue trace; 20 minutes, red trace; 12 hours, green trace) showing the generation of a new peak at 1.55 min in the 12 hour sample corresponding to a 5′dA-dithionite adduct in the presence of 100 μM Rvip, 1mM SAM and 10 mM IPP. d, Corresponding mass spectra in ESI negative mode of peak occurring at 1.55 minutes in the 12 hours sample. The 5′dA-dithionite conjugate was calculated to have an exact mass of 315 Da and an m/z of 314.1. These results have been repeated twice. e, Rate of 5′dA formed by 100 μM Rvip in the presence of 1mM SAM, 1mM CTP and/or 10mM IPP or UDP-glucose (n = 3 independent experiments, mean ± S.D). f, Mass spectrum traces of 5′dA by ESI+. Reactions were conducted with 100 μM Rvip, 1mM SAM, 1mM deuCTP and/or 10 mM UDP-glucose. The mass spectrum of 5′dA produced during these reactions show only the presence of deuterium, which derives from deuCTP, even when UDP-glucose is present at 10 fold higher concentrations. An m/z of 252.1 represents the natural abundance peak of 5′dA, an m/z of 253.1 indicating the addition of one deuterium g, Mass spectrum trace showing −m/z of 5′-dA formed by combining 100 μM Rvip with 1mM deuCTP (dotted blue trace) or 1mM deuCTP with 1mM deoxyCTP (red trace). The y-axis of each spectrum was normalized to 100 % with arbitrary units (au) to allow direct comparison between each sample. The 5′-dA produced during this reaction has an m/z of 251.1, which is only consistent with Rvip abstracting a deuteron from deuCTP and not acting on the deoxyCTP (i.e., lack of m/z 250.1). h, Mass spectrum trace showing −m/z of 5′-dA or new product (i), formed by combining 100 μM Rvip with either 1mM CTP (dotted blue trace) or 1mM deuCTP (red trace). When Rvip was incubated with SAM and CTP deuterated at the 2′, 3′, 4′, 5′ and 5 positions (deuCTP), the negative ion m/z of 5′-dA increased from 250.1 to 251.1, consistent with the transfer of one deuterium from deuCTP to 5′-dA•. When ddhCTP from the reaction was analyzed by MS, the product exhibited a negative ion m/z of 468.1, indicating that the deuterium abstracted by 5′-dA during catalysis did not return to the product. The y-axis of each spectrum was normalized to 100 % with arbitrary units (au) to allow direct comparison between each sample. These results have been repeated at least twice.
Extended data 4
Extended data 4. Viperin abstracts the 4′-H from CTP
Using CTP with deuterium (2H denoted with red D) incorporated at either the a, 2′-2H, b, 3′-2H, c, 4′-2H or d, 5′-2H2 (left column), we were able to monitor the loss of deuterium from the resulting product (middle column) and gain of a deuterium in the resulting 5′dA (right column). The 5′dA −m/z increases by one only in reactions containing CTP with a 4′-2H (c, right column). Natural abundance peaks are denoted with dashed vertical lines. All experiments were repeated once.
Extended data 5
Extended data 5. CMPK2 phosphorylates UDP or CDP and synthetic ddhC can be converted to ddhCTP by cellular machinery
a, Formation of trinucleotide species (UTP, CTP or ddhCTP) from mono- and di-phosphate species (1mM UMP, UDP, CMP, CDP, or ddhCDP respectively) in the presence of either ATP or GTP as the phosphate donor by 5 μM Hs CMPK2. b, ddhCTP formation in HEK293T cells expressing either FLAG- Hs viperin (N- or C-terminal tags), FLAG- Hs viperin without N-terminal amphipathic region (delta 1-42), Hs CMPK2 only, FLAG-Hs viperin (N- or C-terminal tags), Hs CMPK2, FLAG- Hs viperin without N-terminal amphipathic region (delta 1-42) and Hs CMPK2, control plasmid, or cells only. Only in cases where the tag is on the N-terminus of the full length Hs viperin is produced ddhCTP at detectable levels. c, ddhCTP concentrations from HEK293T suspension cells that were incubated with synthetic ddh-cytidine (0, 1mM) for 24, 48 or 72 h (see Supplementary Information for details). d, ddhCTP concentrations from adherent Vero cells that were incubated with synthetic ddh-cytidine (0, 0.3, 1mM) for 24, 48 or 72 h (see Supplementary Information for details). nd = not detectable. All experiments were repeated once.
Extended Data 6
Extended Data 6. Cellular concentrations of nucleotides are not effected by viperin expression
HEK293T cells expressing FLAG- Hs viperin (aqua), FLAG- Hs viperin and Hs CMPK2 (maroon), or cells only (dark blue). Samples were taken at 16 h, 24 h, 48 h, and 72 h post infection. Extraction performed with acetonitrile/methanol/water (40:40:20 + 0.1M formic acid). Cellular concentrations were determined using 13C915N15-CTP, 13C1015N10-ATP, 13C10N5 –GTP and 13C915N2-UTP spiked into the extraction mixture at known concentrations and using equations 1 and 2 above. Analysis of nucleotides a, ATP, b, CTP, c, GTP, and d, UTP did not show statistically significant differences (ns) between FLAG- Hs viperin (aqua), FLAG- Hs viperin and Hs CMPK2 (maroon), or cells only (dark blue) for any time point. n = 3 biologically independent samples. Statistical significance was determined using a two-way ANOVA (Table S12, S13, S14 and S15). e, Ratio of cellular concentrations of ddhCTP to CTP from HEK293T cells expressing FLAG-Hs viperin (aqua) or FLAG- Hs viperin and Hs CMPK2 (maroon); samples were taken at 16 h, 24 h, 48 h, and 72 h post transfection. The overall ratio of ddhCTP to CTP remains constant when only FLAG- Hs viperin is expressed, but the concentration of ddhCTP is boosted significantly relative to CTP when both FLAG- Hs viperin and Hs CMPK2 are co-expressed (plots are derived from c and Fig 3a data).
Extended data 7
Extended data 7. Nucleotide concentrations are not effected during ddhCTP production
a, ddhCTP, b, CTP, UTP and ATP in immortalized macrophage cells (RAW 264.7) grown in serum free media in the presence of increasing concentrations of murine IFN-alpha (10 ng/mL, 50 ng/mL and 250 ng/mL). n = 2 biologically independent samples.
Extended Data Figure 8
ddhCTP is utilized as a substrate by DV and WNV RdRp and chain terminates RNA synthesis. a, Schematic of primer extension assay for evaluating DV and WNV RdRp activity. b, DV RdRp-catalyzed nucleoside incorporation using CTP, 3′-dCTP or ddhCTP as nucleoside triphosphate substrates. Some full-length product was observed in the presence of ddhCTP (> 99 % pure), which is due to residual contaminating CTP that could not be removed). c, Reaction products resolved by denaturing PAGE containing 40% formamide showing the trace amount of CTP contaminate in the ddhCTP preparation. These experiments were repeated independently at least four times with similar results. d, Longer incubation times and more DV RdRp enzyme does not increase the yield of extended product. e, DV RdRp-catalyzed nucleoside incorporation with increasing concentrations of ddhCTP (0, 1, 10, 100, 200 and 750 μM) at varying concentrations of CTP. This experiment was repeated independently three times with similar results. f, Plot of the percentage inhibition as a function of ddhCTP concentration at varying concentrations of CTP. Data were fit to a dose response curve to obtain IC50 values of ddhCTP of 60 ± 10, 120 ± 20, 520 ± 90, 3900 ± 700 μM at 0.1, 1, 10 and 100 μM CTP, respectively. This experiment was repeated at least three times with similar results. The total sample size is 24. The error reported is the standard error from the fit of the data to a dose response curve. g, Plot of IC50 values as a function of CTP concentration. The data were fit to a line with a slope of 38 ± 1 and an intercept of 91 ±. 25. The error reported is the standard error from the fit of the data to a line. h, WNV RdRp-catalyzed nucleoside incorporation with increasing concentrations of ddhCTP (0, 1, 10, 100, 200 and 750 μM) at varying concentrations of CTP. This experiment was repeated at least three times with similar results. i, Plot of the percentage inhibition as a function of ddhCTP concentration at varying concentrations of CTP. Data were fit to a dose response curve to obtain IC50 values of ddhCTP of 20 ± 10, 70 ± 10, 300 ± 40, 2700 ± 300 μM at 0.1, 1, 10 and 100 μM CTP, respectively. The total sample size is 24. The error reported is the standard error from the fit of the data to a dose response curve. j, Plot of IC50 values as a function of CTP concentration. The data were fit to a line with a slope of 27 ± 1 and an intercept of 31 ± 8. Both of these results demonstrate that once ddhCMP is incorporated, it effectively terminates synthesis and that the small amount of extended product is from a trace amount of CTP contamination. The error reported is the standard error from the fit of the data to a line.
Extended Data Figure 9
Extended Data Figure 9. HRV-C and PV RdRp are poorly inhibited by ddhCTP
a, Schematic of primer extension assay for evaluating HRV-C RdRp activity. b, HRV-C RdRp-catalyzed nucleoside incorporation using CTP, 3′-dCTP or ddhCTP as nucleoside triphosphate substrates. These experiments were repeated independently at least four times with similar results. c, Increasing concentrations of ddhCTP does not efficiently inhibit HRV-C RdRp-catalyzed RNA synthesis. HRV-C RdRp-catalyzed nucleoside incorporation in the presence of increasing concentrations of either ddhCTP or 3′-dCTP. These experiments were repeated independently at least five times with similar results. d, Plot of the percentage inhibition as a function of either ddhCTP or 3′-dCTP concentration. Data were fit to a dose response curve to obtain IC50 values of 900 ± 300 μM for ddhCTP and 5 ± 1 μM for 3′-dCTP, respectively. The total sample size is 8. The error reported is the standard error from the fit of the data to a dose response curve. e–f, HRV-C (panel e) and PV (panel f) RdRp-catalyzed nucleoside incorporation with increasing concentrations of ddhCTP (0, 1, 10, 100 and 200 μM) at varying concentrations of CTP. Reactions were performed with the trinucleotide primer, 5′-pGGC, and 20-nt RNA template as described for DV and WNV RdRp in order to directly compare results with HRV-C and PV RdRp. At the highest concentration of ddhCTP, only ~2% inhibition was observed for HRV-C RdRp at 0.1 and 1 μM CTP. The IC50 values at 0.1 and 1 μM CTP are estimated to be ~10,000 and 20,000 μM ddhCTP, respectively. These values are 3-orders of magnitude higher than obtained for DV and WNV RdRp. Reactions in the presence of 3′-dCTP (200 μM) are shown as a control for inhibition. These experiments were repeated independently at least four times with similar results. g, Efficiency of incorporation and inhibition of viral RdRps. Footnotes: aCalculated for ddhCTP in direct competition with CTP (800 μM) using the linear equations obtained from the fit of data shown in panels g and j. For HRV-C, the IC50 value was estimated to be two orders magnitude greater than that calculated for DV and WNV RdRps as evidenced from the data shown in panels m, n and o. bCalculated for a ddhCTP concentration of 350 μM using the following equation: Probability = [ddhCTP]/([ddhCTP] + IC50). cCalculated using the following equation: full-length genome (%) = 100*(1− probability)^Cn; where, Cn is the number of cytidine residues in the viral genome with values of 2200, 2497,1565 and 1737, for DV, WNV, HRV-C and PV respectively.
Extended Data 10
Extended Data 10. ddhC reduces virus release of three different ZIKV isolates
Vero cells were treated with increasing concentrations of ddhC (0, 0.1, and 1 mM) for 24 h and infected with one of three strains of ZIKV; African strain MR766 (Uganda 1947), PRVABC59 (Puerto Rico; 2015) and R103451 (Honduras; 2016, GenBank: KX262887). Viral titers at 24, 48 and 72 hpi were determined using plaque assay. a, b, and c, represent the effect of ddhC on three different ZIKV isolate; a, MR766 (Uganda 1947) b, PRVABC59 (Puerto Rico; 2015) c, and R103451 (Honduras; 2016). Analysis of ZIKV titers indicates that 1mM ddhC inhibits all three ZIKV isolates compared to 0 mM ddhC. However, reduction in virus titer is more prominent at 24 hpi and 48 hpi compared to 72 hpi when using an MOI of 1.0. The antiviral effect of ddhC is more prominent at an MOI of 0.1. (n = 3 biologically independent samples, mean ± S.D., two-way ANOVA and a Dunnett post-hoc analysis).
Figure 1
Figure 1. Substrate specificity of viperin
a, A panel of nucleotides was mixed with Rvip and SAM, and the resulting 5′-dA measured (n=2 independent experiments). b, HPLC analysis showing viperin-mediated conversion of CTP to new product (time = 0, blue; time = 45 min, red). c, UV-visible spectrum of CTP (blue) and new product (ddhCTP, red). Absorbance maximum at 271nm (dotted line). d, MS for CTP (blue, −m/z = 482.1) and e, ddhCTP (red, −m/z = 464.1). All results have been repeated at least 3 times. f, Kinetic analysis of rVIP with CTP: Km for CTP = 182.8 ± 27.6 μM and Vmax = 0.185 ± 0.007 min−1 (n = 3 independent experiments, mean ± S.D).
Figure 2
Figure 2. Proposed mechanism for formation of ddhCTP
a, m/z of CTP (blue) or 4′-2H -CTP (red). b, MS of ddhCTP from reactions with either CTP (blue), or 4′-2H -CTP (red) and Rvip. Deuterium from 4′-2H -CTP is not retained in ddhCTP as products have the same −m/z 464.1. c, 5′-dA derived from 4′-2H -CTP (red trace) increases by one mass unit due to the incorporation of deuterium. These experiments have been repeated at least 3 times with similar results. d, Following hydrogen atom abstraction at the 4′ position of CTP, general base-assisted loss of the 3′ hydroxyl group leads to a carbocation/radical intermediate that is reduced by 1e to yield the ddhCTP product.
Figure 3
Figure 3. Expression of viperin in HEK293 cells produces ddhCTP
a, Cells expressing Hs viperin (aqua), Hs viperin and Hs CMPK2 (maroon), or empty vector (dark blue). Analysis of ddhCTP formation indicates that the Hs viperin + Hs CMPK2 cells show a statistically significant increase in ddhCTP formation over viperin alone at 48 hr post transfection. In cells with empty vector, ddhCTP levels were undetectable. b, Intracellular concentrations of CTP did not differ significantly (ns) over time (n = 3 biologically independent samples, mean ± S.D., two-way ANOVA, Tukey post-hoc).
Figure 4
Figure 4. ddhCTP inhibits Flavivirus RdRps by a chain termination mechanism
a, ddhCTP (0, 1, 10, 100 and 300 μM) inhibits DV RdRp. Experiments repeated independently four times with similar results. b, Plot of [ddhCMP Inc.] / [CMP Inc.] versus [ddhCTP] / [CTP]. Data fit to a line with slope of 0.0074 ± 0.0006 (DV) and 0.017 ± 0.002 (WNV). At each ratio of [ddhCTP] /[CTP] a total of at least 3 independent experiments, with total sample size of 24. c, Inhibition of WNV, ZV and HCV RdRps with either ddhCTP or 3′-dCTP (100 μM). Experiments repeated independently four to five times with similar results. d, Percentage of inhibition shown. Error bars represent SEM (n = 4 independent experiments).
Figure 5
Figure 5. ddhC reduces ZIKV release in Vero cells
a, Vero cells were treated with increasing concentrations of ddhC for 24 hr and infected with ZIKV MR766 (Uganda) at an MOI 0.1. b, For viability studies, Vero cells were treated with increasing concentrations of ddhC under the same culture conditions used for the antiviral experiment described in a. (n = 3 biologically independent samples, mean ± S.D., two-way ANOVA and a Dunnett post-hoc analysis).

Comment in

  • Viperin breaks viral chains.
    Minton K. Minton K. Nat Rev Immunol. 2018 Aug;18(8):480-481. doi: 10.1038/s41577-018-0035-1. Nat Rev Immunol. 2018. PMID: 29950609 No abstract available.
  • Viperin Poisons Viral Replication.
    Ng LFP, Hiscox JA. Ng LFP, et al. Cell Host Microbe. 2018 Aug 8;24(2):181-183. doi: 10.1016/j.chom.2018.07.014. Cell Host Microbe. 2018. PMID: 30092190

References

    1. Molinari NAM, et al. The annual impact of seasonal influenza in the US: Measuring disease burden and costs. Vaccine. 2007;25:5086–5096. doi: 10.1016/j.vaccine.2007.03.046. - DOI - PubMed
    1. Tang HB, et al. Viperin inhibits rabies virus replication via reduced cholesterol and sphingomyelin and is regulated upstream by TLR4. Scientific reports. 2016;6:30529. doi: 10.1038/srep30529. - DOI - PMC - PubMed
    1. Helbig KJ, Beard MR. The role of viperin in the innate antiviral response. Journal of molecular biology. 2014;426:1210–1219. doi: 10.1016/j.jmb.2013.10.019. - DOI - PubMed
    1. Seo JY, Yaneva R, Cresswell P. Viperin: A Multifunctional, Interferon-Inducible Protein that Regulates Virus Replication. Cell Host Microbe. 2011;10:534–539. doi: 10.1016/j.chom.2011.11.004. - DOI - PMC - PubMed
    1. Hover BM, Loksztejn A, Ribeiro AA, Yokoyama K. Identification of a cyclic nucleotide as a cryptic intermediate in molybdenum cofactor biosynthesis. Journal of the American Chemical Society. 2013;135:7019–7032. doi: 10.1021/ja401781t. - DOI - PMC - PubMed

Publication types

MeSH terms