. 2018 Aug;560(7718):387-391.
doi: 10.1038/s41586-018-0290-0. Epub 2018 Jun 20.

A multiprotein supercomplex controlling oncogenic signalling in lymphoma

Affiliations

A multiprotein supercomplex controlling oncogenic signalling in lymphoma

James D Phelan et al. Nature. 2018 Aug.

Abstract

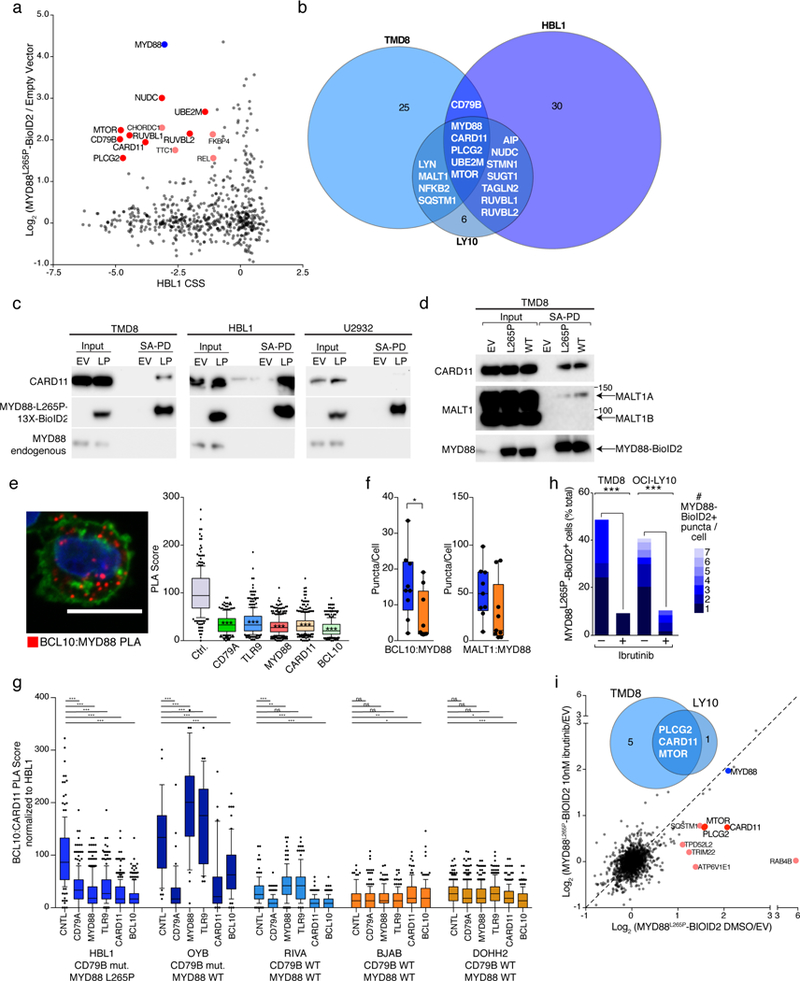
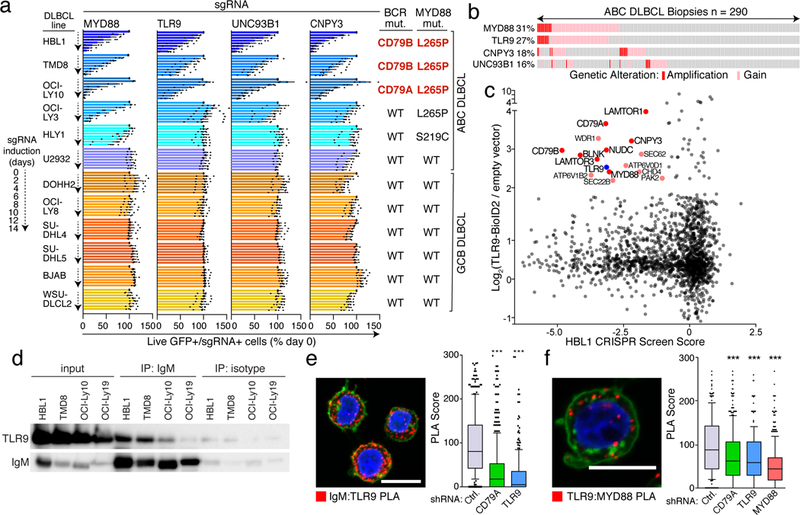
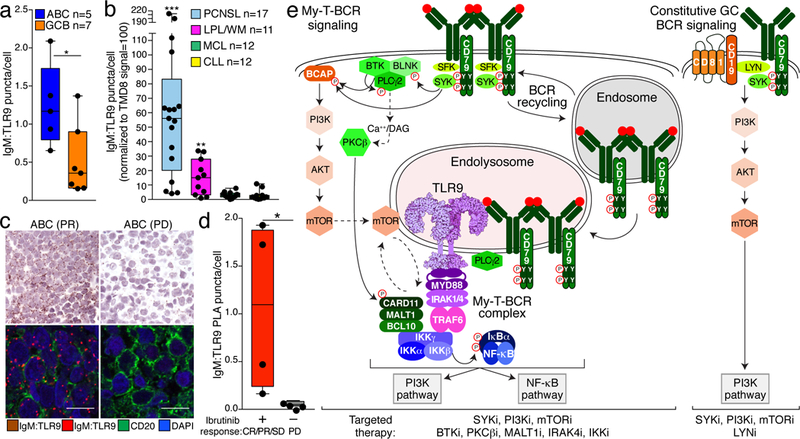
B cell receptor (BCR) signalling has emerged as a therapeutic target in B cell lymphomas, but inhibiting this pathway in diffuse large B cell lymphoma (DLBCL) has benefited only a subset of patients1. Gene expression profiling identified two major subtypes of DLBCL, known as germinal centre B cell-like and activated B cell-like (ABC)2,3, that show poor outcomes after immunochemotherapy in ABC. Autoantigens drive BCR-dependent activation of NF-κB in ABC DLBCL through a kinase signalling cascade of SYK, BTK and PKCβ to promote the assembly of the CARD11-BCL10-MALT1 adaptor complex, which recruits and activates IκB kinase4-6. Genome sequencing revealed gain-of-function mutations that target the CD79A and CD79B BCR subunits and the Toll-like receptor signalling adaptor MYD885,7, with MYD88(L265P) being the most prevalent isoform. In a clinical trial, the BTK inhibitor ibrutinib produced responses in 37% of cases of ABC1. The most striking response rate (80%) was observed in tumours with both CD79B and MYD88(L265P) mutations, but how these mutations cooperate to promote dependence on BCR signalling remains unclear. Here we used genome-wide CRISPR-Cas9 screening and functional proteomics to determine the molecular basis of exceptional clinical responses to ibrutinib. We discovered a new mode of oncogenic BCR signalling in ibrutinib-responsive cell lines and biopsies, coordinated by a multiprotein supercomplex formed by MYD88, TLR9 and the BCR (hereafter termed the My-T-BCR supercomplex). The My-T-BCR supercomplex co-localizes with mTOR on endolysosomes, where it drives pro-survival NF-κB and mTOR signalling. Inhibitors of BCR and mTOR signalling cooperatively decreased the formation and function of the My-T-BCR supercomplex, providing mechanistic insight into their synergistic toxicity for My-T-BCR+ DLBCL cells. My-T-BCR supercomplexes characterized ibrutinib-responsive malignancies and distinguished ibrutinib responders from non-responders. Our data provide a framework for the rational design of oncogenic signalling inhibitors in molecularly defined subsets of DLBCL.


Conflict of interest statement

The authors state they have no competing interests.

Figures

Extended Data Figure 1.
Extended Data Figure 1.. CRISPR screen controls.
a, Schematic of CRISPR-Cas9 screens in lymphoma cell lines. b, 991 negative control non-targeting (left) or 1210 positive control, essential gene (right) targeting sgRNAs are displayed for each cell line with indicated metrics. Box and whisker plots display mean and interquartile data, outliers represent 10% of total dataset. c, Cumulative CRISPR screen scores for indicated genes are displayed for lymphoma cell lines screened.
Extended Data Figure 2.
Extended Data Figure 2.. Correlation of genome-wide and replication CRISPR screens.
A subset of lymphoma cell lines were rescreened with replication libraries sgRNAs targeting each of the displayed 62 genes. Depletion scores of the genome-wide screen are shown on the x-axis while the z-score of the average log2 fold change of all sgRNAs targeting a given gene is shown on the y-axis for the replication screen. Pearson correlations (n=62) and linear regressions are displayed for each of the overlapping datasets. b, Cumulative CRISPR screen scores for TLR-pathway genes are displayed for ABC (blue) and GCB (orange) DLBCL cell lines.
Extended Data Figure 3.
Extended Data Figure 3.. CD19 is required for GCB and Burkitt lymphoma survival.
a, A panel of 67 lymphoma cell lines was transduced with an shRNA targeting CD19. Shown is the log ratio of the percent of live, shRNA-containing (GFP+) cells at the last time point (tfinal ,10–12 days) versus the intial time point (tinitial, day 0). ABC lines are depicted in blue, GCB lines depicted in orange, and BL lines are depicted in dark red. Average and SEM are displayed from independent biological replicates. See Statistics and Reproducibility. b, FACS gating strategy for Live, GFP+ shRNA or sgRNA expressing cells with knockdown of CD19 or negative control genes.
Extended Data Figure 4.
Extended Data Figure 4.. TLR9 overexpression and association with the BCR are features of ABC DLBCL.
a, Gene expression values (Log2 FPKM) values of TLR9 associated genes are shown by DLBCL subtype, ABC in blue (n=294), GCB in orange (n=164) and unclassified (Unc) in grey (n=115). Gene expression data was correlated with DNA copy number and linear regression calculated for ABC samples. One-way ANOVA and Tukey’s post test *p< 0.05 ***p< 0.001 (left), linear regression *p< 0.05 ***p<0.0001 (right). b, Amplification of the UNC93B1 and CNPY3 loci (black lines, below chromosome ideogram). Minimal shared amplified regions in ABC DLBCL biopsies are bracketed and genes displayed below. c, The essential TLR9 interactome in TMD8. TLR9-BioID2 interactome determined by SILAC-based mass spectrometry (y-axis) plotted by the CRISPR screen score (CSS, x-axis). Bait (TLR9) is labeled in blue. Essential interactors are labeled in red, those shared with HBL1 (Fig. 2C) are labeled in dark red. d, Venn diagram of the overlap of SILAC mass spectrometry TLR9-BioID2 interactors in experiments performed in TMD8 and HBL1 ABC lines. The 47 overlapping proteins are listed. e, The enrichment of 47 overlapping TLR9-bioID2 proximal proteins is shown (upper) relative to their CRISPR screen score (lower). Gene names labeled in red are enriched and toxic to both HBL1 and TMD8. See Statistics and Reproducibility.
Extended Data Figure 5.
Extended Data Figure 5.. IgM interacts with intracellular TLR9 in ABC DLBCL lines.
a, Whole cell lysates of indicated DLBCL cell lines were immunoprecipitated with anti-IgM or isotype control antibodies before being immunoblotted with IgM or indicated TLR antibodies, representative blots, n=3. b, ABC DLBCL cell lines HBL1 and TMD8 were incubated on ice with IgM or isotype control antibodies and lysed. Lysates were immunoprecipitated (plasma membrane) with IgM or isotype control. Unbound lysates (cytosolic) were then immunoprecipitated with IgM or isotype control antibodies before all IP lysates were immunoblotted with indicated antibodies, representative blots, n=2. c, Confocal images of PLA reaction between IgM and TLR9 in HBL1 and TMD8 cells transduced with control SC4, CD79A or TLR9 shRNAs. Cells were puromycin selected and shRNAs induced with dox for two days before being fixed and imaged (left); quantification right, data from 3 separate experiments. Data are pooled biologically independent experiments of n>100 cells scored per condition. Box plots represents median and 25–75% of data, whiskers display 10–90 percentile; one-way ANOVA with Dunnett's post test, ***p<0.001, **p<0.001. d, An IgM:TLR9 PLA (red) was performed in a panel of ABC and GCB DLBCL cell lines and the presence of chronic active BCR signaling (+ = present), MYD88 mutational status and IgH isotype (μ=IgM, γ=IgG) are displayed. Nuclei were stained with DAPI (blue) and membranes visualized by WGA (green). e, The number of puncta per cell of IgM:TLR9 PLA is quantitated. Box and whisker plots display mean and interquartile data, whiskers display 10–90 percentile. Data are from 3 fields of cells quantitated from 1 representative experiment of 3 biologically independent replicates. f, The data from Fig. 5e segregated by ABC (blue, n=9) and GCB (orange, n=9) lines. Box plots represent median and 25–75% of data, whiskers display range; Mann-Whitney unpaired one-tailed t-test **p< 0.01. g, IgG:TLR9 PLA (red) was performed in indicated DLBCL cell lines costained with DAPI (blue) and IgG-AlexaF488 (green). MYD88 mutational status, IgH isotype and presence of chronic active BCR signaling (+=present, −=absent) are displayed. Representative data from 2 independent biological replicates. h, To define the cytoplasmic location of the BCR-TLR9 interaction, we counterstained ABC cells for LAMP1, a marker of late endolysosomes, where TLR9 resides, and performed PLA between IgM:TLR9, IgM:LAMP1 and IgM:SYK. The PLA signal is in red, LAMP1 is counterstained in blue. Representative data from 3 independent biological experiments. i, To quantify the association between PLA signals and LAMP1 staining, we calculated the Pearson’s correlation coefficients across all pixels in each imaged cell (n=25 cells/PLA pair). The highest correlation was between an IgM:LAMP1 PLA and LAMP1 staining (R=0.471), whereas the correlation between an IgM:SYK PLA signal and LAMP1 was much lower (R=0.153). The correlation between the IgM:TLR9 PLA signal and LAMP1 staining was intermediate (R=0.310), indicating that a significant component of the IgM:TLR9 interaction is in LAMP1+ vesicles. Quantitated data is from one of three independent biological experiments. j, Quantitation of IgM:TLR9 PLA signal following ectopic expression of either empty vector, TLR9, wild type MYD88 or MYD88L265P. Data pooled from 3 (HBL1) or 2 (TMD8) biologically independent replicates of n≥100 cells scored per condition. Box plots represents median and 25–75% of data, whiskers display 10–90 percentile; one-way ANOVA with Dunnett's post test, ***p<0.001, **p<0.01, *p<0.05. See Statistics and Reproducibility.
Extended Data Figure 6.
Extended Data Figure 6.. TLR9 knockdown phenocopies MYD88 knockdown.
a, TLR9 shRNA is rescued by overexpression of TLR9. HBL1 cells were transduced with empty vector (EV) or wild type TLR9 expressing dsRedExpress2 vectors and then with shRNA vectors marked by GFP targeting a control (SC4), MYD88 or TLR9. The percent of double positive cells was monitored by FACS and normalized to day 0. One of three representative biologically independent experiments is shown. b, Heatmap of gene expression values showing the global phenocopy of MYD88-dependent genes after shRNA-mediated knockdown of TLR9 or MYD88 in HBL1 at indicated time points. c, Gene signatures enriched in downregulated genes from HBL1 or TMD8 after shRNA-mediated knockdown of TLR9. d, Normalized IκBα—luciferase reporter levels at indicated time points after knockdown of TLR9 with indicated shRNAs; mean and SEM are shown of nine technical replicates from n=3 independent biological experiments. One-way ANOVA with Sidak’s multiple comparison test, *p<0.05, ***p<0.001.
Extended Data Figure 7.
Extended Data Figure 7.. The MYD88L265P interactome in ABC DLBCL.
a, The essential MYD88L265P interactome in HBL1. MYD88L265P -BioID2 interactome from SILAC-based mass spectrometry (y-axis) plotted by the CRISPR screen score (CSS, x-axis). Bait (MYD88) is labeled in blue. Essential interactors are red, with those shared with either TMD8 or OCI-Ly10 labeled in dark red. b, Venn diagram of the overlap of MYD88L265P -BioID2 interactors in TMD8, OCI-Ly10 and HBL1 ABC lines. Proteins found in two or more experiments are listed. c, Lysates of TMD8, HBL1 and U2932 cells transduced with empty vector or MYD88L265P -BioID2, selected and treated with 50µM biotin for 24 hours. Lysates were prepared and immunoprecipitated with streptavidin before being immunoblotted with CARD11 and MYD88 antibodies. One representative blot is shown for each cell line from n=3 biologically independent experiments (HBL1, TMD8) and n=1 (U2932) d, Lysates of TMD8 cells transduced with empty vector, MYD88L265P or wild type (WT) BioID2-fusion proteins, selected and treated with 50µM biotin for 24 hours. Lysates were prepared and immunoprecipitated with streptavidin before being immunoblotted with CARD11, MALT1 or MYD88 antibodies; representative blot; n=3. e, Confocal image of a PLA of BCL10 with MYD88. Data pooled from 6 biologically independent replicates of n>200 cells scored per condition. Box plots represent median and 25–75% of data, whiskers display 10–90 percentile; one-way ANOVA with Dunnett's post test. f, BCL10:MYD88 and MALT1:MYD88 PLA in ABC (blue, n=9) and GCB (orange, n=9) lines. Box plots represent median and 25–75% of data, whiskers display range; Mann-Whitney unpaired, one-tailed t-test. g, BCL10:CARD11 PLA after shRNA knockdown of indicated genes in ABC (blue) and GCB (orange) lines. CD79B and MYD88 mutation status is displayed below each cell line. Data are from 3 fields of cells quantitated from 1 representative experiment of 3 (HBL1), 2 (BJAB, DOHH2) or 1 (OYB, RIVA) biologically independent replicates of n≥90 cells scored per condition. Box plots represent median and 25–75% of data, whiskers display 10–90 percentile; one-way ANOVA with Dunnett's post test. h, ABC lines expressing MYD88L265P-BioID2 were treated with DMSO or 10nM ibrutinib for 24 hours, and the numbers of biotin puncta were quantified from confocal images (representative experiment, n=3). Fisher’s exact test, two-sided. i, SILAC-based mass spectrometry comparison of MYD88L265P-BioID2 interactome in TMD8 cells treated with DMSO (x-axis) vs. 10nM ibrutinib (y-axis). Proteins reduced upon ibrutinib treatment are shown in red, those similarly decreased in two separate cell lines (Fig. 4A) are labeled in dark red. Bait (MYD88L265P) is labeled in blue. Venn diagraph showing overlap of proteins decreased by ≥30% in OCI-Ly10 cells (Fig. 4a) is shown as an inset. *p< 0.05, **p<0.01, ***p<0.001. See Statistics and Reproducibility.
Extended Data Figure 8.
Extended Data Figure 8.. IgM:TLR9 PLA identifies ABC samples with chronic active BCR signaling in FFPE TMA.
a, IgM:TLR9 PLA was performed on an FFPE fixed tissue microarray of lymphoma cell lines. PLA puncta were quantified and plotted as the absolute number of spots per cell from at least 2 images of 1 representative experiment from 3 independent TMA replicates. Box plots represent median and 25–75% of data, whiskers display range. Cell lines are divided by putative lymphoma subtype for presentation. PMBL = Primary Mediastinal B cell lymphoma, HL = Hodgkin lymphoma, BPDC = Blastic Plasmacytoid Dendritic Cell neoplasm, BL = Burkitt lymphoma, MZL = Marginal Zone lymphoma, GCB = Germinal Center DLBCL, WM = Waldenström's macroglobulinemia, ABC = Activated B cell-like DLBCL. b, Representative confocal fluorescent image from 3 independent biological samples of a germinal center from a reactive lymph node. IgM:TLR9 PLA is shown in red, ‘CD20 in green, CD138 in white and DAPI in blue.
Extended Data Figure 9.
Extended Data Figure 9.. Waldenström's macroglobulinemia can utilize the My-T-BCR.
a, shRNA-mediated toxicity of indicated genes in two WM cell lines. Control (SC4), CD79A, TLR9 or MYD88 shRNAs were expressed in tandem with GFP and the relative level of GFP was followed over time by FACS. Mean and SEM are shown of independent biological experiments, n = see Statistics and Reproducibility. b, Confocal images from one of two representative biologically independent experiments of PLA reaction between IgM and TLR9 (red puncta) counterstained with DAPI (blue) and wheat germ agglutinin (green) and c, normalized quantification (PLA Score) of IgM:TLR9. Data were quantitated from n≥28 cells per condition. Box plots represent median and 25–75% of data, whiskers display range. White scale bar is 10µm.
Figure 1.
Figure 1.. Genes essential for oncogenic signaling in lymphoma.
Icons indicate essential genes from CRISPR screens colored by the average CSS in GCB (orange) or BCR-dependent ABC (blue) DLBCL lines.
Figure 2.
Figure 2.. TLR9 couples BCR signaling and mutant MYD88.
a, Toxicity of sgRNAs in DLBCL lines normalized to day 0. b, Copy number gain or amplification of indicated genes in ABC biopsies. c, TLR9-BioID interactome in HBL1 cells vs. CSS. Blue:bait, red:essential interactors, dark red:essential interactors also in TMD8. d, TLR9 co-immunoprecipitates with IgM in ABC lines (HBL1, TMD8, OCI-Ly10). Confocal images of PLAs (red) showing TLR9:IgM (e) or TLR9:MYD88 (f) interaction in HBL1. DAPI (blue), WGA (green). (right) PLA scores after knockdown of indicated genes. ***p≤0.001; see Statistics and Reproducibility for additional information.
Figure 3.
Figure 3.. The My-T-BCR supercomplex coordinates NF-κB activation.
a, MYD88L265P-BioID interactome in TMD8 cells vs. CSS. Blue:bait, red:essential interactors, dark red:essential interactors in ≥2 ABC lines. Confocal image of PLAs (red) showing interaction of b, MALT1:MYD88; c, CARD11:BCL10 d, IgM:p-IκBα e, TLR9:p-IκBα. DAPI (blue); WGA (green). (right) PLA scores in HBL1 cells after knockdown of indicated genes. f, Confocal images of MYD88L265P-BioID-transduced HBL1 or TMD8 cells stained as indicated. ***p≤0.001; see Statistics and Reproducibility for additional information.
Figure 4.
Figure 4.. mTOR is an essential component of the My-T-BCR supercomplex.
a, MYD88L265P-BioID interactome in OCI-Ly10 cells treated with ibrutinib (10nM) or DMSO. Red: ibrutinib-sensitive interactions, blue:bait. b, Confocal images of mTOR (green), LAMP1 (red) and MYD88L265P-BioID2 (cyan, streptavidin) in ABC cells. c, PLA scores for indicated protein interactions in ABC lines treated with ibrutinib or DMSO. d, Normalized MYD88L265P-BioID intensity/cell in ABC lines treated as indicated for 24 hours. e, Immunoblots using the indicated antibodies of ABC lines treated with indicated drugs for 24 hours. f, Synergistic toxicity scores in TMD8 cells treated with ibrutinib or acalabrutinib together with the indicated drugs. g, Growth of TMD8 xenografts in NSG mice treated as indicated. ***p≤0.001, **p≤0.01, *p≤0.05; see Statistics and Reproducibility for additional information.
Figure 5.
Figure 5.. The My-T-BCR complex identifies ibrutinib-responsive lymphomas.
IgM:TLR9 PLA puncta/cell in a, GCB and ABC biopsies or b, indicated lymphoma biopsies. c, Representative IgM:TLR9 PLA images of ABC biopsies. Bright field (top) fluorescence (bottom). PR: partial response, PD: progressive disease. d, IgM:TLR9 PLA of biopsies from DLBCL patients treated with ibrutinib. Responders (red; complete response (CR), PR, stable disease (SD)), non-responders (grey; PD). e, Models of My-T-BCR signaling and constitutive GC BCR signaling. ***p≤0.001, **p≤0.01, *p≤0.05; see Statistics and Reproducibility for additional information.

References

    1. Wilson WH et al. Targeting B cell receptor signaling with ibrutinib in diffuse large B cell lymphoma. Nat Med 21, 922–926, (2015). - PMC - PubMed
    1. Alizadeh AA et al. Distinct types of diffuse large B-cell lymphoma identified by gene expression profiling. Nature 403, 503–511 (2000). - PubMed
    1. Wright G et al. A gene expression-based method to diagnose clinically distinct subgroups of diffuse large B cell lymphoma. Proc Natl Acad Sci U S A 100, 9991–9996 (2003). - PMC - PubMed
    1. Young RM et al. Survival of human lymphoma cells requires B-cell receptor engagement by self-antigens. Proc Natl Acad Sci U S A 112, 13447–13454, (2015). - PMC - PubMed
    1. Davis RE et al. Chronic active B-cell-receptor signalling in diffuse large B-cell lymphoma. Nature 463, 88–92, (2010). - PMC - PubMed

Publication types

MeSH terms