. 2018 Jul;19(7):711-722.
doi: 10.1038/s41590-018-0136-9. Epub 2018 Jun 20.

Distinct progenitor lineages contribute to the heterogeneity of plasmacytoid dendritic cells

Affiliations

Distinct progenitor lineages contribute to the heterogeneity of plasmacytoid dendritic cells

Patrick Fernandes Rodrigues et al. Nat Immunol. 2018 Jul.

Abstract

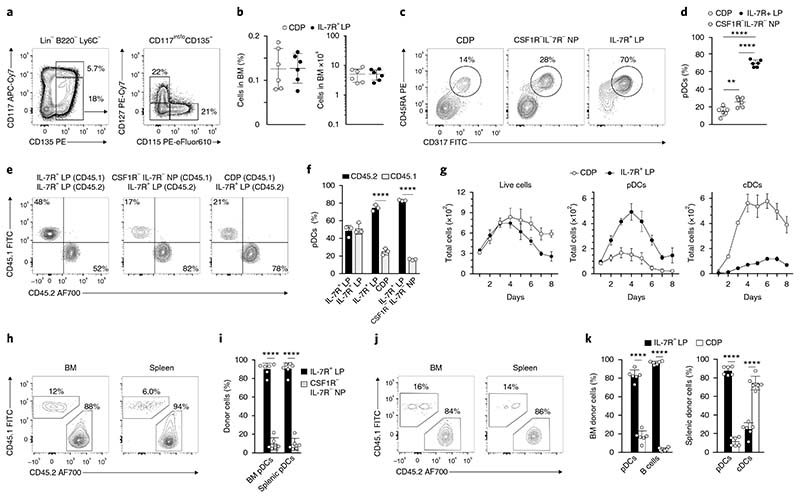
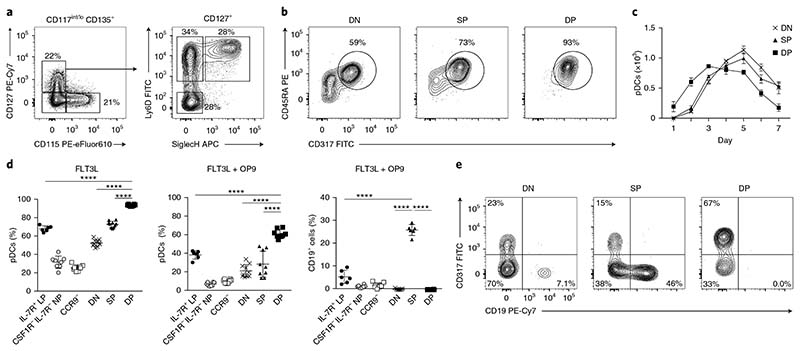
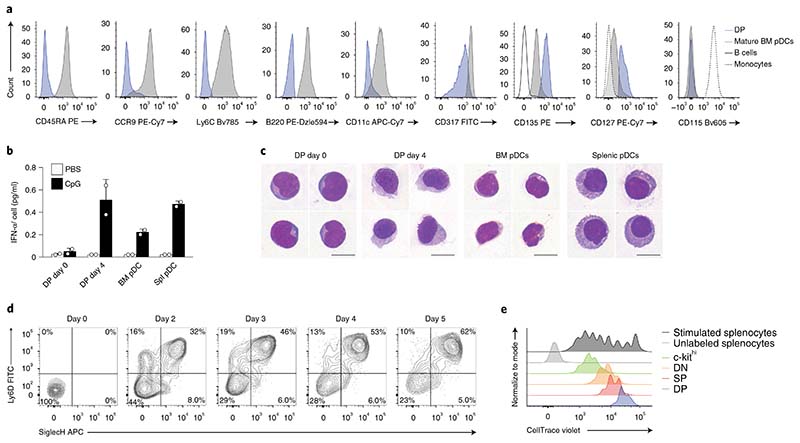
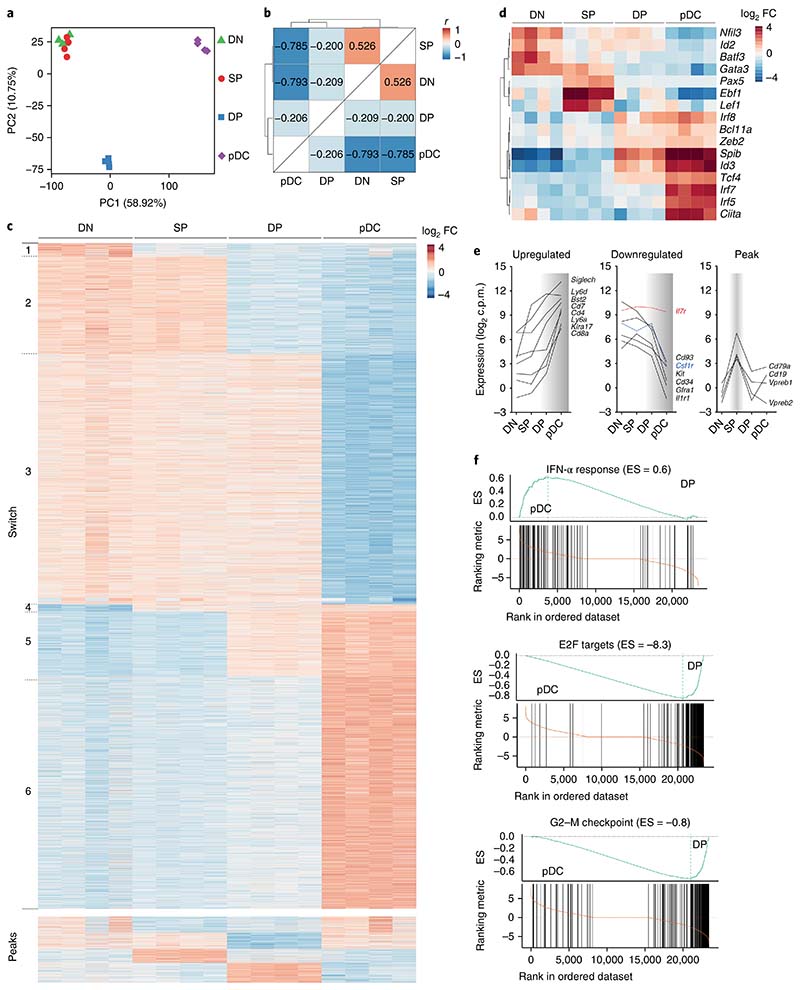
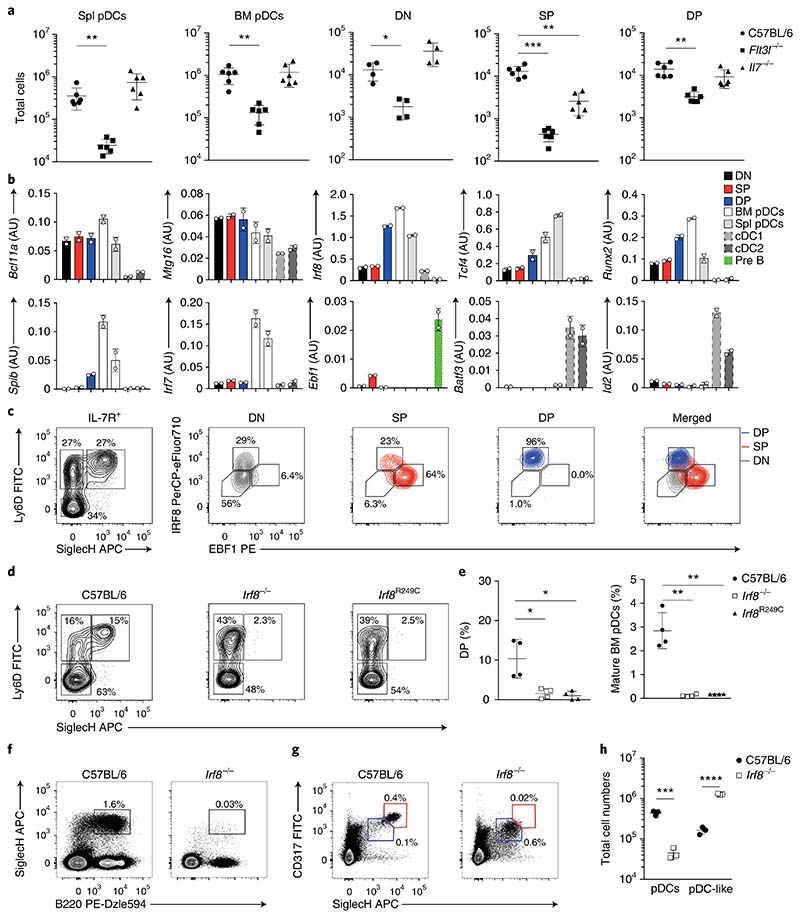
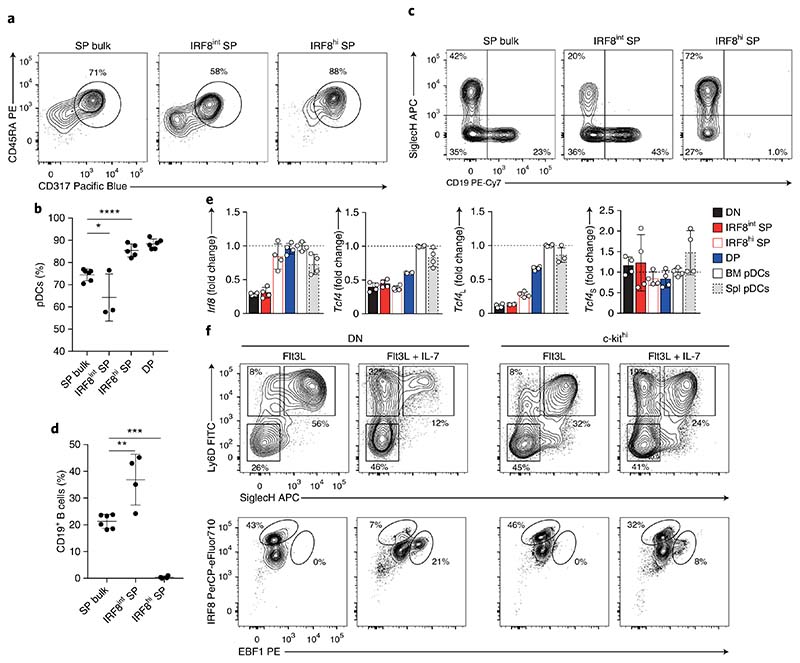
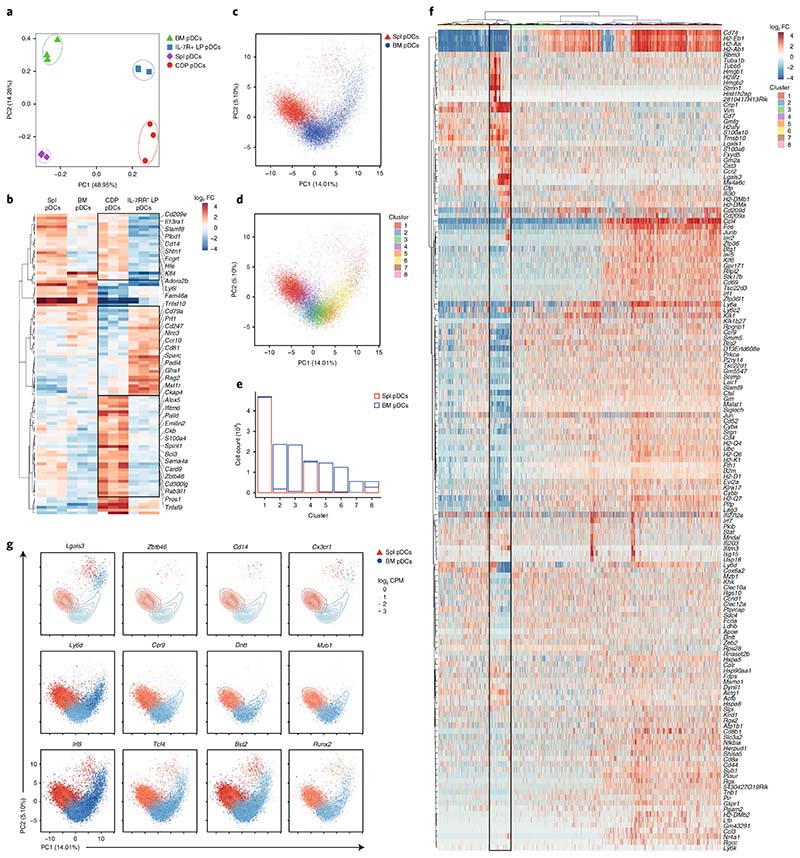
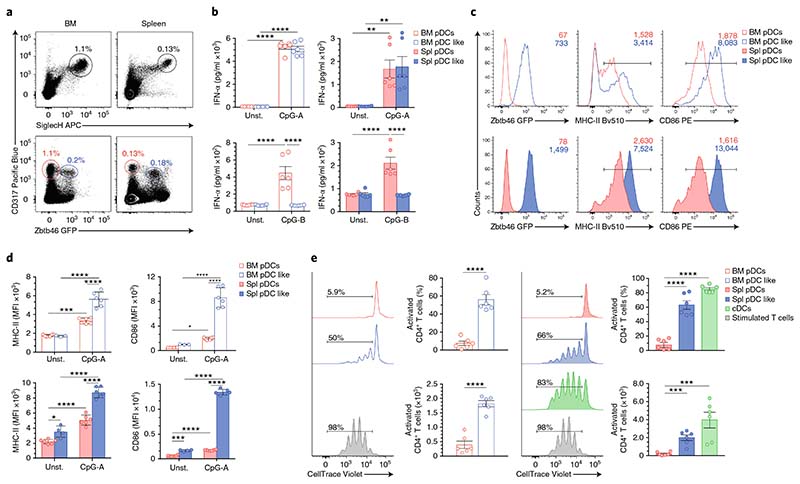
Plasmacytoid dendritic cells (pDCs) are an immune subset devoted to the production of high amounts of type 1 interferons in response to viral infections. Whereas conventional dendritic cells (cDCs) originate mostly from a common dendritic cell progenitor (CDP), pDCs have been shown to develop from both CDPs and common lymphoid progenitors. Here, we found that pDCs developed predominantly from IL-7R+ lymphoid progenitor cells. Expression of SiglecH and Ly6D defined pDC lineage commitment along the lymphoid branch. Transcriptional characterization of SiglecH+Ly6D+ precursors indicated that pDC development requires high expression of the transcription factor IRF8, whereas pDC identity relies on TCF4. RNA sequencing of IL-7R+ lymphoid and CDP-derived pDCs mirrored the heterogeneity of mature pDCs observed in single-cell analysis. Both mature pDC subsets are able to secrete type 1 interferons, but only myeloid-derived pDCs share with cDCs their ability to process and present antigen.


Conflict of interest statement

Competing interests

The authors declare no competing interests.

Figures

Fig. 1
Fig. 1. pDCs develop primarily from IL-7R+ lymphoid progenitors.
a,b, All subsets are pregated on LinB220Ly6CCD117int/loCD135+. Shown are the gating strategy (a) of CDPs (CD115+CD127), IL-7RM-CSFR NPs (CD115CD127) and IL-7R+ LPs (CD115CD127+), and the frequency (b) of the indicated progenitors in the BM of C57BL/6 mice (n = 6; each dot represents a mouse, and thin lines represent the mean ± s.d.). c,d, Sort-purified CDPs, IL-7RMCSFR NPs and IL-7R+ LPs were cultured for 4 d in the presence of FLT3L. pDC output was determined according to the expression of CD317 (Bst2) and CD45RA (c) and is shown as percentage output (d) (n = 6; each dot represents a mouse, and thin lines represent the mean ± s.d.). ek, Sort-purified progenitors isolated from CD45.1 and CD45.2 mice were cocultured (e,f) for 4 d in the presence of FLT3L. Shown are two-color histograms for the expression of CD45.1 and CD45.2 pregated on CD45RA+CD317+ pDCs (e) and percentage output (f) (n = 3; each dot represents a mouse, and thin lines represent the mean ± s.d.). g, IL-7R+ LPs and CDPs were cultured in competitive settings in a 1:1 ratio. Shown is the total, pDC and cDC output over 8 d of culture (n = 3 mice; thin lines represent the mean ± s.e.m.). hk, BM and splenic pDC output was determined 4 d after intravenous co-transfer of CD45.2-positive IL-7R+ LPs in competition with CD45.1-positive IL-7RM-CSFR NPs (h,i) or CDPs (j,k). Shown are two-color histograms for the expression of CD45.1 and CD45.2 pregated on CD45RA+CD317+ pDCs (h,j) (n = 6 mice). Shown are percentage donor-derived BM pDCs and B cells and splenic pDCs and cDCs, as indicated (i,k) (n = 6; each dot represents a mouse, and thin lines represent the mean ± s.d.). Statistical analysis was done with one-way ANOVA with Tukey post-test (d,f) or two-tailed Student’s t test (i,k). *P < 0.05, **P < 0.01, ***P < 0.001, ****P < 0.0001.
Fig. 2
Fig. 2. SiglecH+Ly6D+IL-7R+ LPs have exclusive pDC potential.
a, IL-7R+ LPs, as defined in Fig. 1a, were further subdivided on the basis of expression of SiglecH and Ly6D. Shown is the gating strategy for DN, Ly6D SP, and SiglecH and Ly6D DP progenitors (n = 6 mice). be, Sort-purified IL-7RM-CSFR NPs, IL-7R+ LPs, CCR9 (CD317+ B220+CD11c+CCR9), DN, SP and DP precursors were cultured in the presence of FLT3L. Two-color histograms for the expression of CD45RA and CD317 (b) and the percentage of mature pDCs (d) are shown for day 4 of culture (n = 6 mice, with 1 or 2 technical replicates. Each dot represents a sample, and thin lines represent the mean ± s.d.). c, Total pDCs generated over 7 d of culture from sort-purified DN, SP and DP precursors (n = 3 mice; thin lines represent the mean ± s.e.m.). d,e, The same progenitors cultured for 4 d in the presence of FLT3L and OP9 stromal cells. Shown are percentages of mature pDCs and B cells (d) and two-color histograms for the expression of CD317+ pDCs and CD19+ B cells (e) (n = 6 mice with 1 or 2 technical replicates; each dot represents a sample, and thin lines represent the mean ± s.d.). Statistical analysis was done with one-way ANOVA with Tukey post-test. *P < 0.05, **P < 0.01, ***P < 0.001, ****P < 0.0001.
Fig. 3
Fig. 3. SiglecH+Ly6D+ DP cells are bona fide pDC progenitors.
a, Representative single-color histograms for the indicated surface markers expressed by DP pre-pDCs (blue), mature pDCs (gray), B cells (black) and monocytes (broken line) (n = 3 independent experiments). b, DP pre-pDC progenitors were cultured for 4 d in the presence of FLT3L. IFN-α was measured in the supernatants collected on day 0 and day 4, or on freshly plated mature pDCs 16 h after stimulation with CpG-A, as indicated (n = 3 independent experiments, with one representative experiment shown; each dot represents a technical replicate, and thin lines represent the mean ± s.d.). Spl, splenic. c, May–Gruenwald staining of sort-purified mature BM, splenic pDCs and DP progenitors at day 0 and after 4 d of culture (n = 4 representative images taken from 3 independent experiments; scale bars, 10 μ m). d, DN progenitors, as defined in Fig. 2a, were cultured in the presence of FLT3L for 5 d. Shown are two-color histograms for the expression of Ly6D and SiglecH analyzed at the indicated time points (n = 3 independent experiments, with representative data from one experiment shown). e, DP (blue), SP (red), DN (orange) and c-kithi (LinB220Ly6CCD117hi) (green) progenitors were cultured for 4 d in the presence of FLT3L. Proliferation was assessed through CellTrace Violet dilution. Unlabeled (light gray) or labeled (dark gray) splenocytes were stimulated with anti-CD3 and anti-CD28 (n = 3 independent experiments, with representative data from one experiment shown). Statistical analysis was done with one-way ANOVA with Tukey post-test. *P < 0.05, **P < 0.01, ***P < 0.001, ****P < 0.0001.
Fig. 4
Fig. 4. Stage-specific transcriptional signatures define pDC commitment.
af, Bulk RNA sequencing was performed on cell-sorted DN, SP and DP progenitors, and mature pDCs (Methods). a,b, PCA (a) and hierarchical clustering (b) of the progenitor subsets and mature pDCs on the basis of Pearson’s correlation coefficient calculated on the 25% of genes with the highest variance (calculated as interquartile range). PC, principal component. c, Heat map based on a developmental-stage model from DN to SP to DP and to mature pDCs, generated on selected genes (fold change (FC) > 1 and P < 0.05; Methods). Genes were ordered in switches and peaks according to their expression profiles for the different subsets. d, Correlation heat map for selected transcription factors. e, Specific surface markers, plotted according to their expression profiles (upregulated, downregulated or peak) across the indicated developmental stages from DN to mature pDCs. Highlighted are the transcript levels as c.p.m. for Il7r (red) and Csf1r (blue). f, Gene set enrichment analysis, performed on the Molecular Signature Database (MSigDb v5.2) comparing the enrichment score (ES) for DP progenitors with mature pDCs, as depicted (IFN-α response, P < 0.00358; E2F targets, P < 0.00146; G2–M checkpoint, P < 0.000946). RNA was collected from sort-purified subsets in n = 4 independent experiments. For each experiment, all progenitors were obtained from one mouse.
Fig. 5
Fig. 5. Expression of IRF8 marks pDC lineage commitment on SP cells.
a, Total mature BM and splenic pDCs and DN, SP and DP progenitors in wild-type, Flt3l−/− and Il7−/− mice, as indicated (n = 6 independent experiments; each symbol represents a mouse, and thin lines represent the mean ± s.d.). b, Expression of selected genes (arbitrary units (AU) relative to β-actin) on sort-purified DN, SP and DP BM progenitors, gated as in Fig. 2a, mature BM and splenic pDCs (SiglecH+CD317+), cDC1 (CD11c+MHCIIhiCD24+XCR1+) and cDC2 (CD11c+MHCIIhiCD11b+Sirp-α+) were analyzed for the expression of selected genes (n = 3 independent experiments, with one representative experiment shown; each dot represents a technical replicate, and thin lines represent the mean ± s.d.). c, Expression of IRF8 and EBF1, determined on DN (black), SP (red) and DP (blue) progenitors (n = 6 mice; representative experiment shown). d,e, DN, SP and DP subsets and mature pDCs were analyzed in Irf8−/− and BXH2 (IRF8R249C) mice. Shown are representative two-color histograms for the expression of Ly6D and SiglecH (d) and the percentage DP pre-pDCs and mature BM pDCs (e) (n = 4; each symbol represents a mouse, and thin lines represent the mean ± s.d.). fh, Splenic and BM pDCs analyzed in C57BL/6 and Irf8−/− mice. Shown are representative two-color histograms for the expression of SiglecH and B220 on BM cells (f) and CD317 and SiglecH on splenocytes (g). CD317hiSiglecHhi pDCs (red) and CD317intSiglecHint pDC-like cells (blue), gated as in g, were quantified (h) (n = 3; each symbol represents a mouse, and thin lines represent the mean ± s.d.). Statistical analysis was done with two-tailed Student’s t test (b,e,h). *P < 0.05, **P < 0.01, ***P < 0.001, ****P < 0.0001.
Fig. 6
Fig. 6. IRF8 and EBF1 define pDC and B cell lineage dichotomy.
ad, Progenitors from C57BL/6 (bulk) and Irf8egfp reporter mice, as indicated and gated as in Supplementary Fig. 6a, were sort-purified and analyzed for pDC and B cell potential. Specifically, DP and unfractionated SP (SP bulk) and SP progenitors expressing intermediate (IRF8int SP) or high (IRF8hi SP) levels of IRF8 were sort-purified and cultured for 4 d in the presence of FLT3L (a,b) or FLT3L and OP9 stromal cells (c,d), as indicated. Shown are two-color histograms and percentages of CD45RA+CD317+ pDCs (a,b) and SiglecHCD19+ (c,d) (n = 3 independent experiments with 1 or 2 technical replicates; each symbol represents a sample, and thin lines represent the mean ± s.d.). e, Expression of Irf8, Tcf4 and its long (Tcf4L) or short (Tcf4S) isoforms, quantified in DN, SP IRF8int, SP IRF8hi, DP, BM and splenic pDCs from IRF8-eGFP reporter mice. Shown are the expression levels indicated as a ratio to BM pDCs (n = 2 independent experiments with 2 technical replicates; data shown as mean ± s.d). f, DN and c-kithi progenitors were cultured for 5 d in the presence of FLT3L with or without IL-7 as indicated. Shown are two-color histograms for the expression of Ly6D/SiglecH (top) and IRF8/EBF1 (bottom) (n = 3 independent experiments, with one representative experiment shown). Statistical analysis was done with one-way ANOVA with Tukey post-test. *P < 0.05, **P < 0.01, ***P < 0.001, ****P < 0.0001.
Fig. 7
Fig. 7. Single-cell analysis elucidates pDC heterogeneity.
a,b, Bulk RNA sequencing on mature BM and splenic pDCs, and on IL-7R+ LP– and CDP-derived pDCs, performed as described in Methods. a, PCA performed on the 25% most variable genes. b, Heat map showing relative expression for differentially expressed genes (log2 fold change > 2.0) from IL-7R+ LPs versus CDP-derived pDCs. cg, Single-cell RNA sequencing, performed as described in Methods, on sort-purified BM and splenic pDCs. c,d, PCA based on the 148 hypervariable genes (biological variation > 0.1 and false discovery rate < 0.05). Colors indicate the tissue of origin (c) or the identified clusters (d). e, Number of cells identified for each cluster in the BM and spleen. f, Heat map for 148 hypervariable genes across all 14,744 cells. At top, colors indicate the identified clusters as in d. g, Expression of the indicated genes from individual BM (blue) and splenic (red) pDCs. The size of each dot corresponds to the relative expression of a given gene for each cell. The contour lines indicate the density of the BM (blue) and splenic (red) cells in the PCA space. Cells for bulk and single-cell RNA sequencing were harvested from n = 3 mice in 3 independent experiments.
Fig. 8
Fig. 8. Functional heterogeneity of pDCs is developmentally encoded.
ae, BM and splenic pDCs and pDC-like cells, analyzed in Zbtb46gfp/+ mice. a, Two-color histograms for the expression of CD317/SiglecH and CD317/Zbtb46-GFP on BM and splenic pDCs pregated on CD11c+MHCII cells. BM and splenic pDCs are labeled in red, and pDC-like cells are marked in blue (n = 6 mice, with one representative experiment shown). b, IFN-α, measured from BM and splenic pDCs and pDC-like cells stimulated for 16 h with CpG-A or CpG-B, or left unstimulated (unst.), as indicated (n = 3 independent experiments with 2 technical replicates; each symbol represents a sample, and thin lines represent the mean ± s.e.m.). Expression of Zbtb46-GFP, MHC-II and CD86, determined in BM and splenic pDCs (red) and pDC-like cells (blue) 16 h after CpG-A stimulation. c,d Representative single-color histograms with mean fluorescence intensity (MFI) (c) and the compiled values from BM and splenic cells (d) (n = 3 independent experiments with 2 technical replicates; each symbol represents a sample, and thin lines represent the mean ± s.d.). e, Proliferation of OT-II T cells induced by sort-purified BM and splenic pDCs (red), pDC-like cells (blue) and splenic cDCs (green) (Methods). Cells were cultured in the presence of CpG-A, lipopolysaccharide and OVA-protein for 4 d. T cells stimulated with anti-CD3 and anti-CD28 (gray) were used as controls (n = 3 independent experiments with 2 technical replicates; each symbol represents a sample, and thin lines represent the mean ± s.e.m.). Statistical analysis was done with two-way ANOVA with Tukey post-test (b,d,e). *P < 0.05, **P < 0.01, ***P < 0.001, ****P < 0.0001.

Comment in

References

    1. Banchereau J, Steinman RM. Dendritic cells and the control of immunity. Nature. 1998;392:245–252. - PubMed
    1. Guilliams M, et al. Dendritic cells, monocytes and macrophages: a unified nomenclature based on ontogeny. Nat Rev Immunol. 2014;14:571–578. - PMC - PubMed
    1. Colonna M, Trinchieri G, Liu YJ. Plasmacytoid dendritic cells in immunity. Nat Immunol. 2004;5:1219–1226. - PubMed
    1. Murphy TL, et al. Transcriptional control of dendritic cell development. Annu Rev Immunol. 2016;34:93–119. - PMC - PubMed
    1. Mildner A, Jung S. Development and function of dendritic cell subsets. Immunity. 2014;40:642–656. - PubMed

Publication types