

Effects of Level, Loading Rate, Injury and Repair on Biomechanical Response of Ovine Cervical Intervertebral Discs
- PMID: 29926304
- PMCID: PMC6279553
- DOI: 10.1007/s10439-018-2077-8
Effects of Level, Loading Rate, Injury and Repair on Biomechanical Response of Ovine Cervical Intervertebral Discs
Abstract
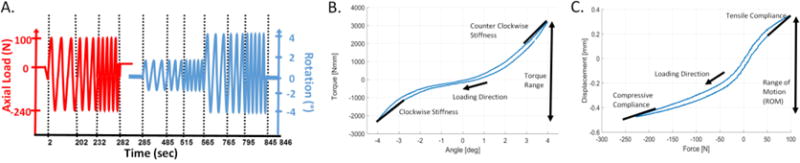
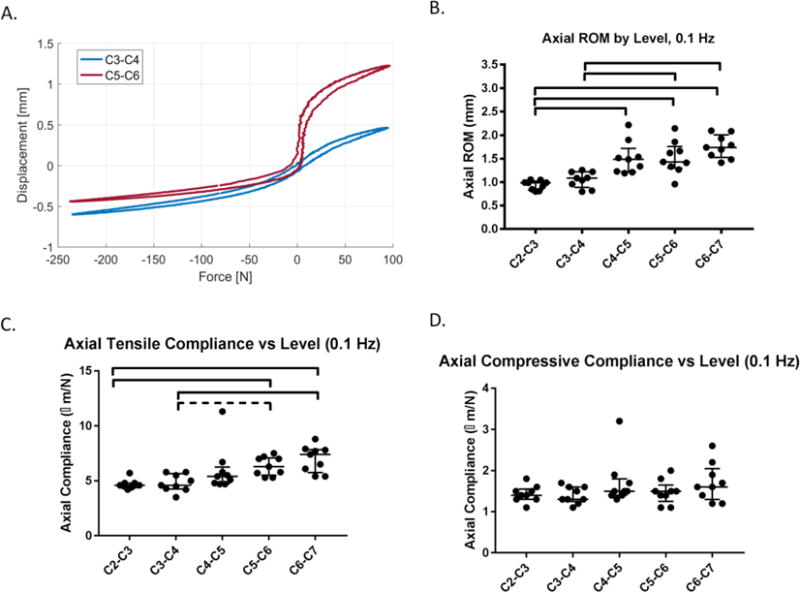
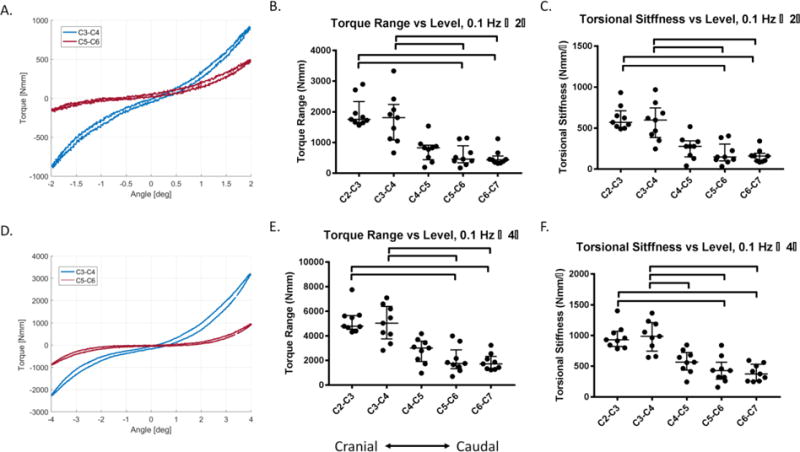
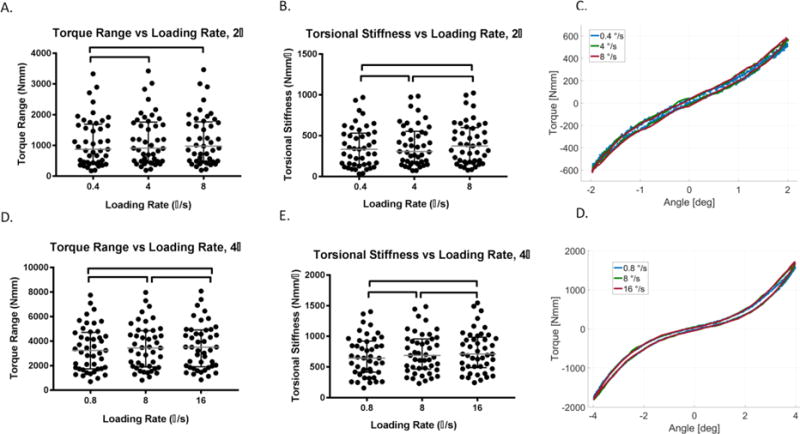
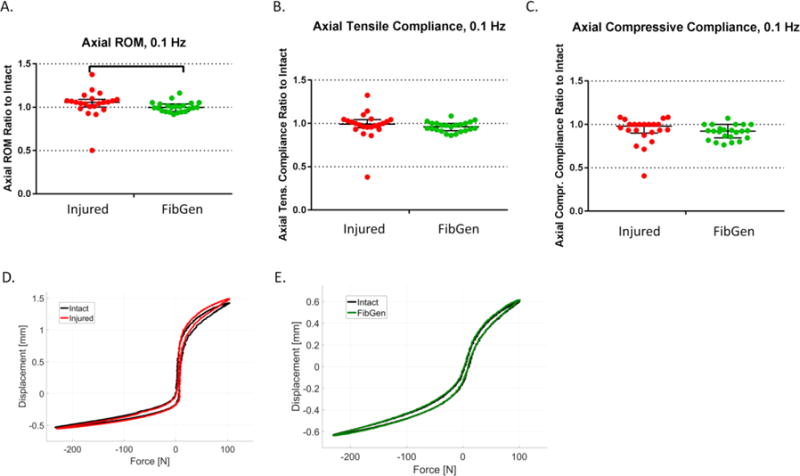
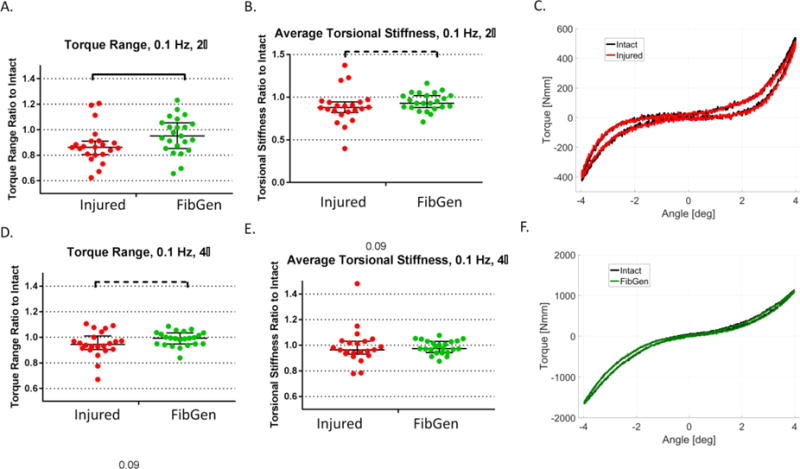
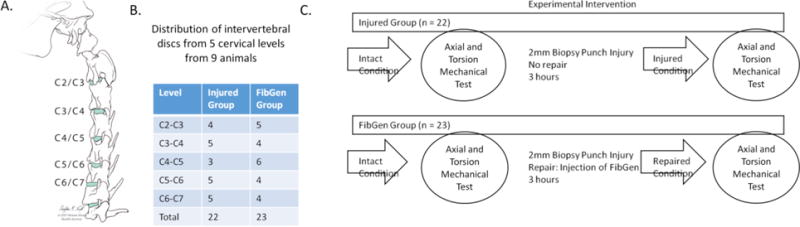
A need exists for pre-clinical large animal models of the spine to translate biomaterials capable of repairing intervertebral disc (IVD) defects. This study characterized the effects of cervical spinal level, loading rate, injury and repair with genipin-crosslinked fibrin (FibGen) on axial and torsional mechanics in an ovine cervical spine model. Cervical IVDs C2-C7 from nine animals were tested with cyclic tension-compression (- 240 to 100 N) and cyclic torsion (± 2° and ± 4°) tests at three rates (0.1, 1 and 2 Hz) in intact, injured and repaired conditions. Intact IVDs from upper cervical levels (C2-C4) had significantly higher torque range and torsional stiffness and significantly lower axial range of motion (ROM) and tensile compliance than IVDs from lower cervical levels (C5-C7). A tenfold increase in loading rate significantly increased torque range and torsional stiffness 4-8% (depending on amplitude) (p < 0.001). When normalized to intact, FibGen significantly restored torque range (FibGen: 0.96 ± 0.14, Injury: 0.88 ± 0.14, p = 0.03) and axial ROM (FibGen: 1.00 ± 0.05, Injury: 1.04 ± 0.15, p = 0.02) compared to Injury, with a values of 1 indicating full repair. Cervical spinal level must be considered for controlling biomechanical evaluations, and FibGen restored some torsional and axial biomechanical properties to intact levels.
Keywords: Annulus fibrosus; Biomechanics; Hydrogel; In vitro; Large animal; Tissue engineering.
Conflict of interest statement
No competing financial interests exist.
Figures
Similar articles
-
Morphological and biomechanical effects of annulus fibrosus injury and repair in an ovine cervical model.JOR Spine. 2019 Dec 21;3(1):e1074. doi: 10.1002/jsp2.1074. eCollection 2020 Mar. JOR Spine. 2019. PMID: 32211587 Free PMC article.
-
Ex-vivo biomechanics of repaired rat intervertebral discs using genipin crosslinked fibrin adhesive hydrogel.J Biomech. 2020 Dec 2;113:110100. doi: 10.1016/j.jbiomech.2020.110100. Epub 2020 Oct 28. J Biomech. 2020. PMID: 33142205 Free PMC article.
-
Composite biomaterial repair strategy to restore biomechanical function and reduce herniation risk in an ex vivo large animal model of intervertebral disc herniation with varying injury severity.PLoS One. 2019 May 28;14(5):e0217357. doi: 10.1371/journal.pone.0217357. eCollection 2019. PLoS One. 2019. PMID: 31136604 Free PMC article.
-
Mechanical Aspects of Intervertebral Disc Injury and Implications on Biomechanics.Spine (Phila Pa 1976). 2020 Apr 15;45(8):E457-E464. doi: 10.1097/BRS.0000000000003291. Spine (Phila Pa 1976). 2020. PMID: 31651681 Review.
-
Morphometric, Biomechanical and Histologic Assessment of Physiologic Ovine Cervical Intervertebral Disc: An Experimental Study and Brief Literature Review.Int J Mol Sci. 2024 Nov 22;25(23):12579. doi: 10.3390/ijms252312579. Int J Mol Sci. 2024. PMID: 39684292 Free PMC article. Review.
Cited by
-
Biomaterials-Induced Stem Cells Specific Differentiation Into Intervertebral Disc Lineage Cells.Front Bioeng Biotechnol. 2020 Feb 7;8:56. doi: 10.3389/fbioe.2020.00056. eCollection 2020. Front Bioeng Biotechnol. 2020. PMID: 32117935 Free PMC article. Review.
-
Biomaterials and Cell-Based Regenerative Therapies for Intervertebral Disc Degeneration with a Focus on Biological and Biomechanical Functional Repair: Targeting Treatments for Disc Herniation.Cells. 2022 Feb 9;11(4):602. doi: 10.3390/cells11040602. Cells. 2022. PMID: 35203253 Free PMC article. Review.
-
Spine biomechanical testing methodologies: The controversy of consensus vs scientific evidence.JOR Spine. 2021 Jan 5;4(1):e1138. doi: 10.1002/jsp2.1138. eCollection 2021 Mar. JOR Spine. 2021. PMID: 33778410 Free PMC article. Review.
-
Mechano growth factor attenuates mechanical overload-induced nucleus pulposus cell apoptosis through inhibiting the p38 MAPK pathway.Biosci Rep. 2019 Mar 28;39(3):BSR20182462. doi: 10.1042/BSR20182462. Print 2019 Mar 29. Biosci Rep. 2019. Retraction in: Biosci Rep. 2024 Aug 28;44(8):BSR-2018-2462_RET. doi: 10.1042/BSR-2018-2462_RET. PMID: 30858307 Free PMC article. Retracted.
-
Morphological and biomechanical effects of annulus fibrosus injury and repair in an ovine cervical model.JOR Spine. 2019 Dec 21;3(1):e1074. doi: 10.1002/jsp2.1074. eCollection 2020 Mar. JOR Spine. 2019. PMID: 32211587 Free PMC article.
References
-
- GBD 2015 DALYs and HALE Collaborators. Global, regional, and national disability-adjusted life- years (DALYs) for 315 diseases and injuries and healthy life expectancy (HALE), 1990–2015: a systematic analysis for the Global Burden of Disease Study 2015. The Lancet. 2016 Oct 8;388(10053):1603–1658. - PMC - PubMed
-
- Melrose J, Ghosh P, Taylor TK, Hall A, Osti OL, Vernon-Roberts B, et al. A longitudinal study of the matrix changes induced in the intervertebral disc by surgical damage to the annulus fibrosus. J Orthop Res. 1992 Sep;10(5):665–676. - PubMed
-
- Shu C, Hughes C, Smith SM, Smith MM, Hayes A, Caterson B, et al. The ovine newborn and human foetal intervertebral disc contain perlecan and aggrecan variably substituted with native 7D4 CS sulphation motif: spatiotemporal immunolocalisation and co-distribution with Notch-1 in the human foetal disc. Glycoconj J. 2013 Oct;30(7):717–725. - PubMed
MeSH terms
Grants and funding
LinkOut - more resources
Full Text Sources
Other Literature Sources
Medical
Miscellaneous
