. 2018 Jun;89 Suppl 1(Suppl 1):S140-S158.
doi: 10.1002/JPER.17-0670.

Age-dependent distribution of periodontitis in two countries: Findings from NHANES 2009 to 2014 and SHIP-TREND 2008 to 2012

Affiliations

Age-dependent distribution of periodontitis in two countries: Findings from NHANES 2009 to 2014 and SHIP-TREND 2008 to 2012

Monisha Billings et al. J Periodontol. 2018 Jun.

Abstract

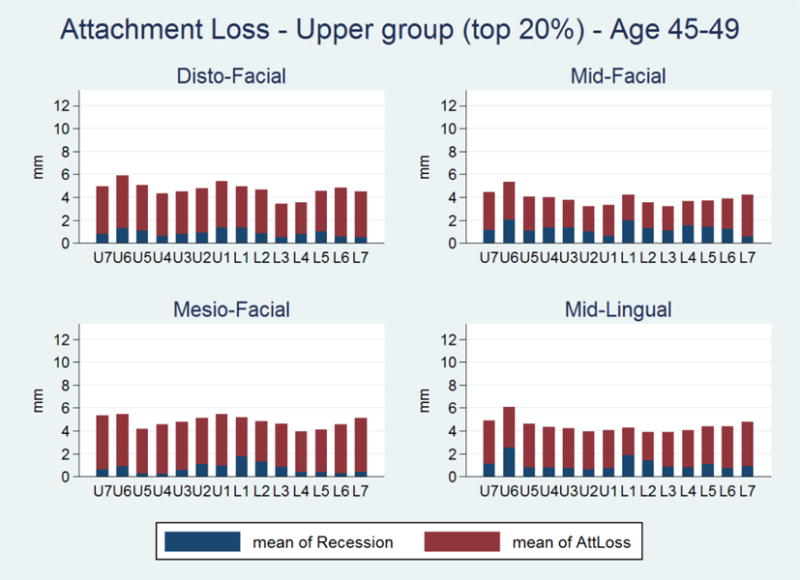
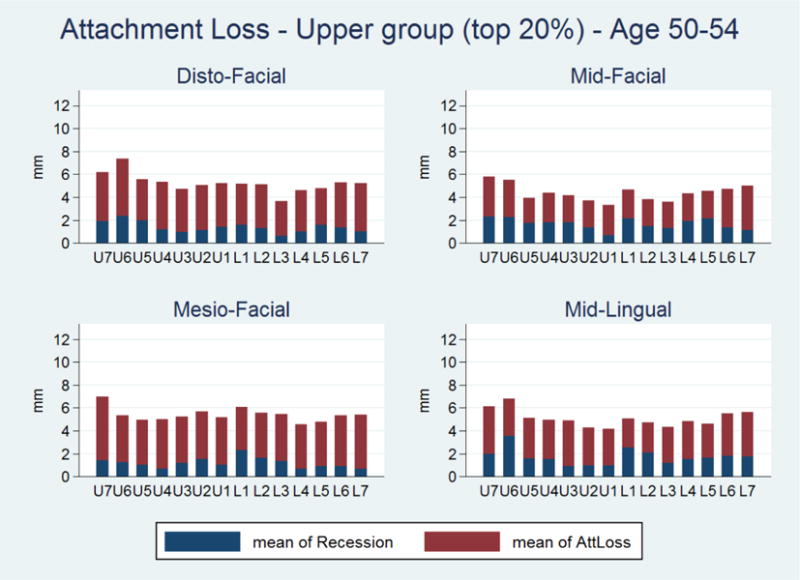
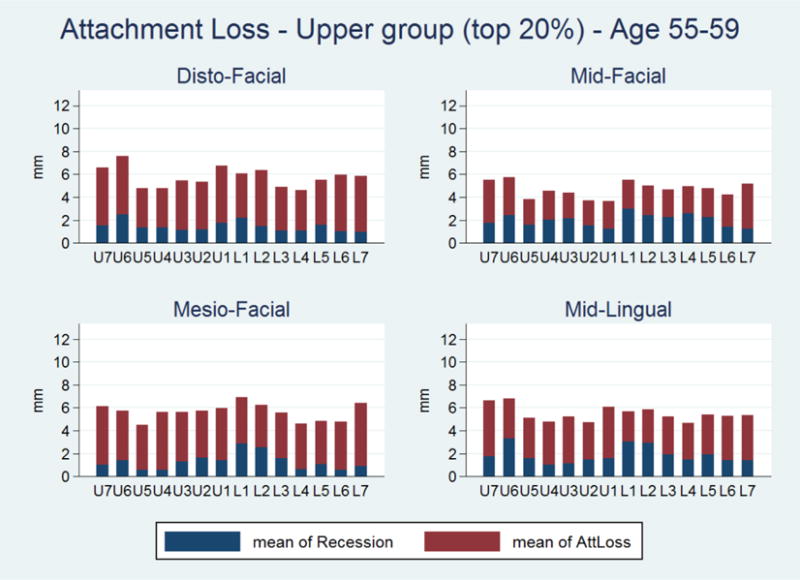
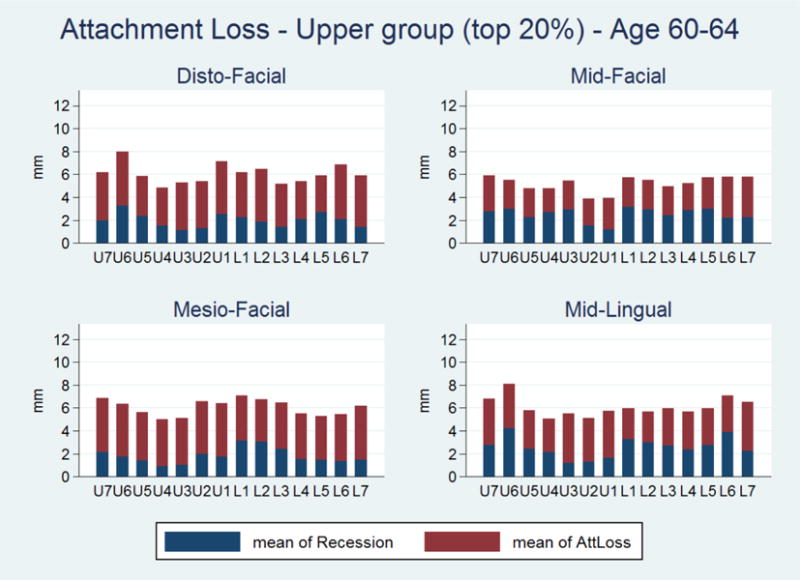
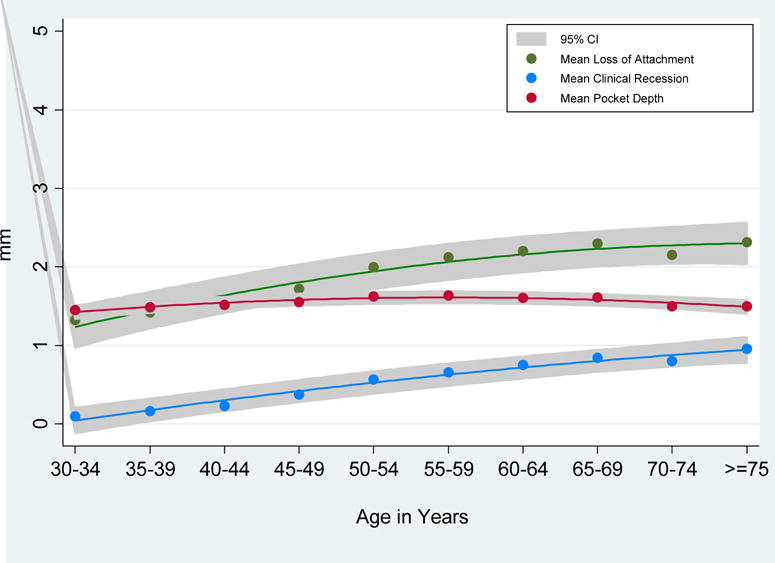
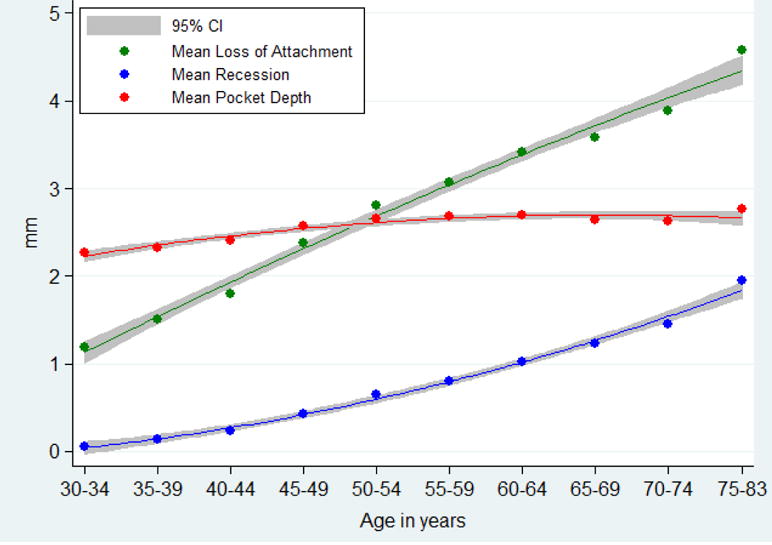
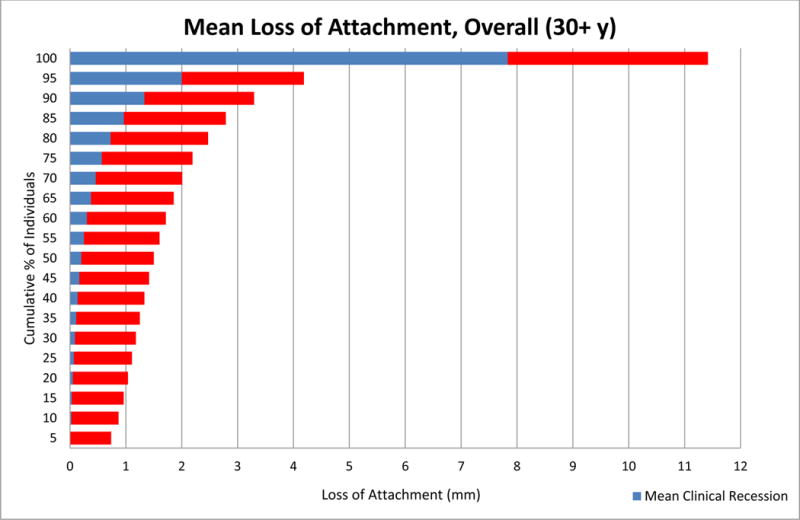
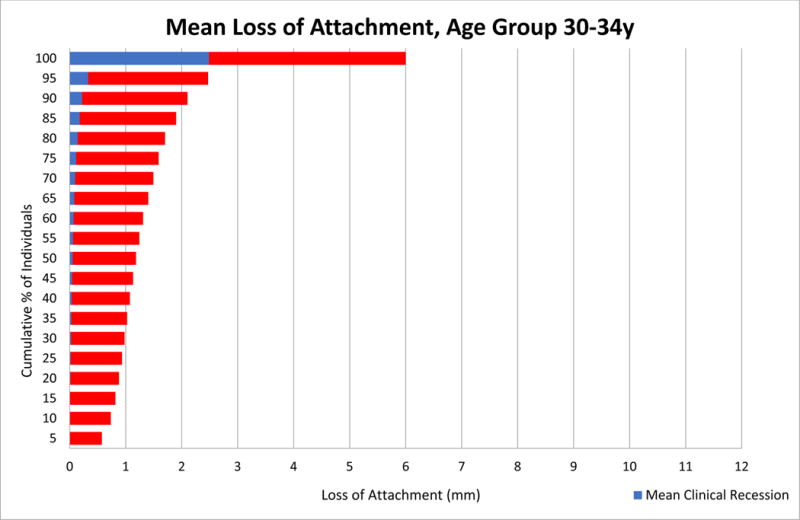
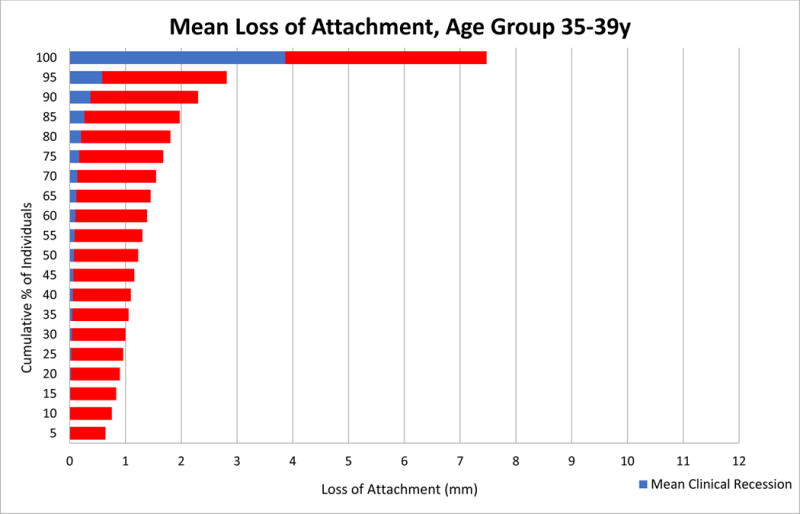
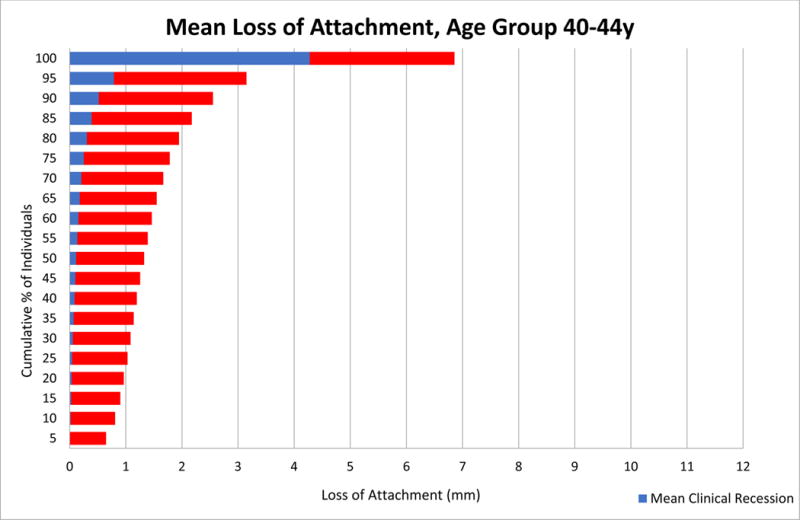
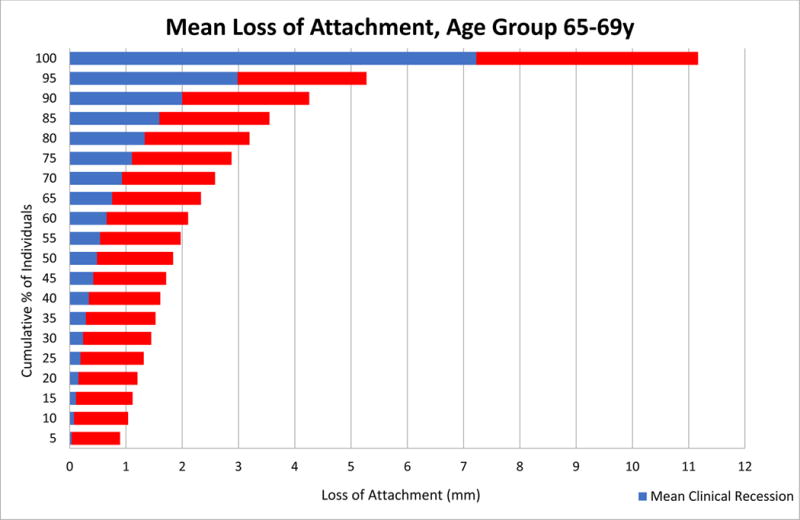
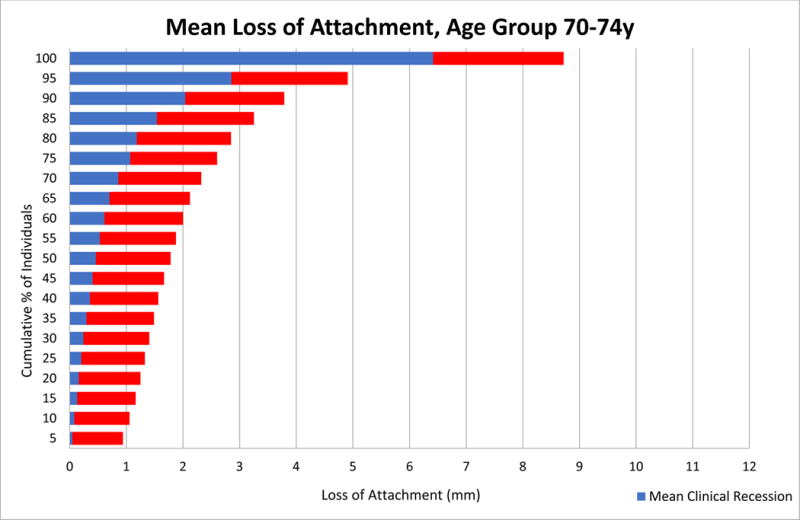
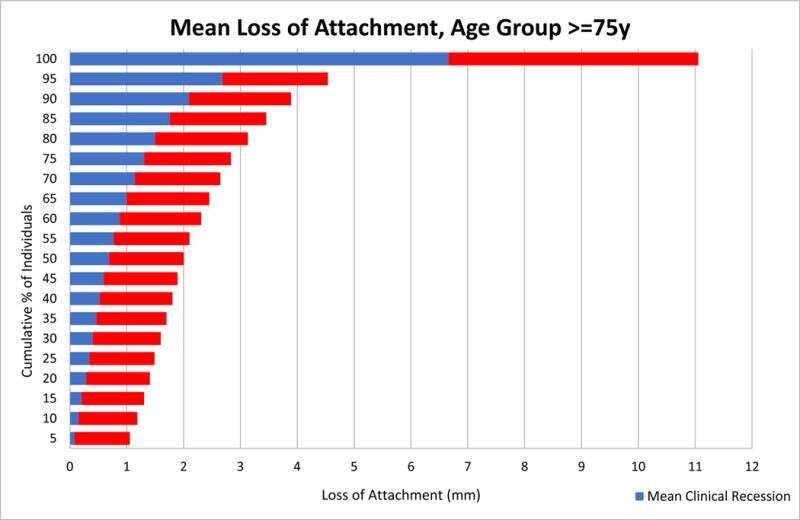
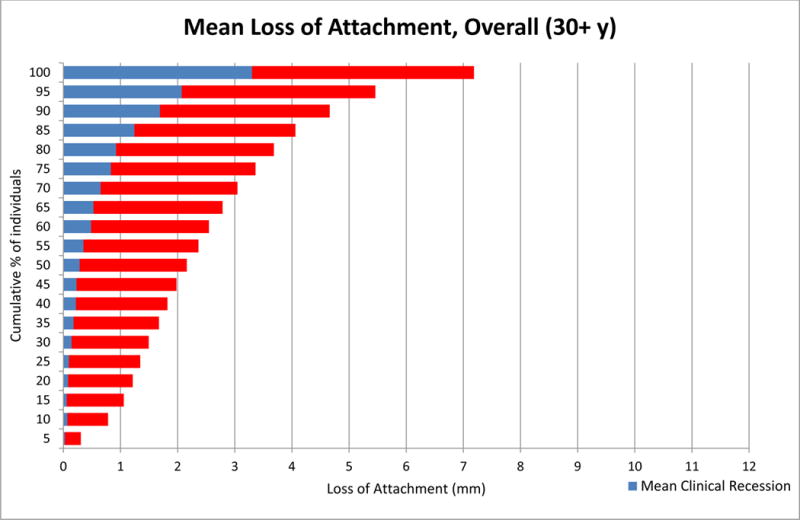
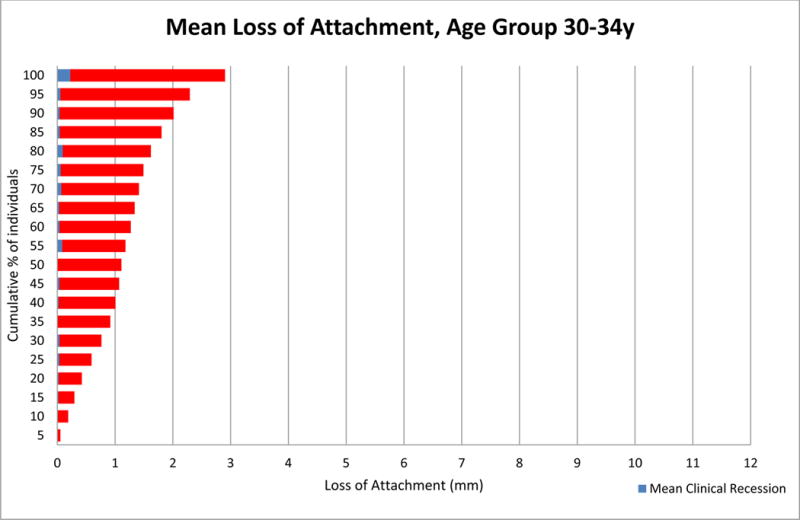
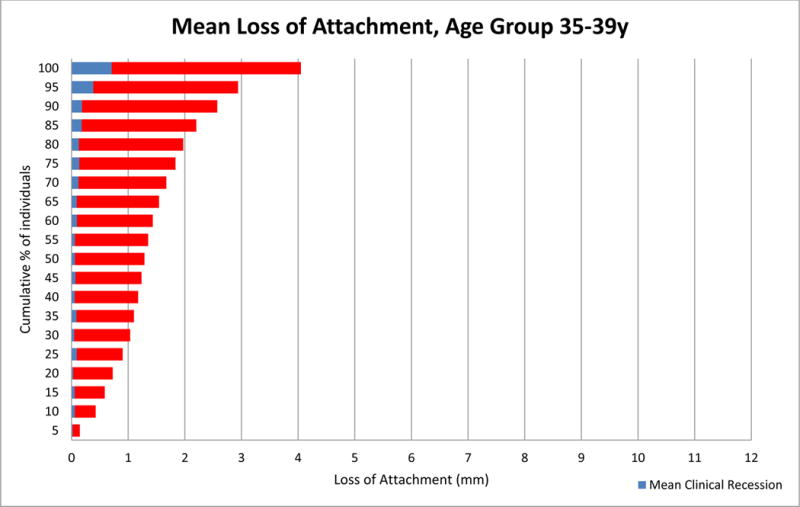
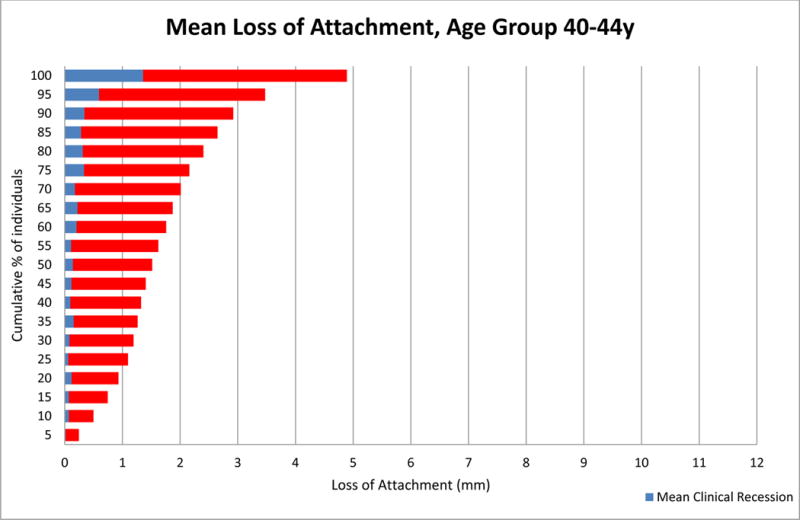
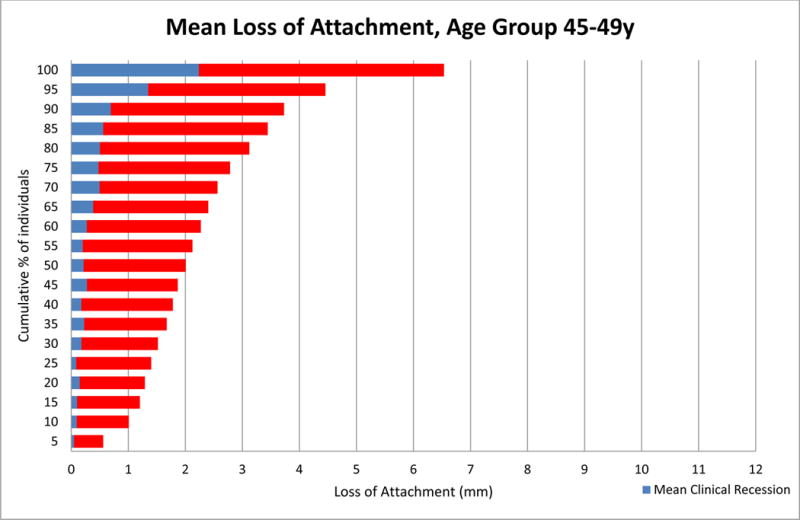
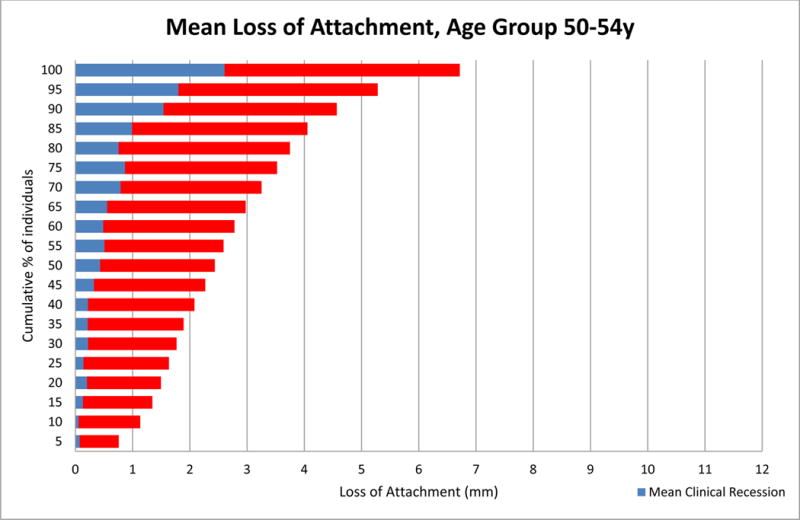
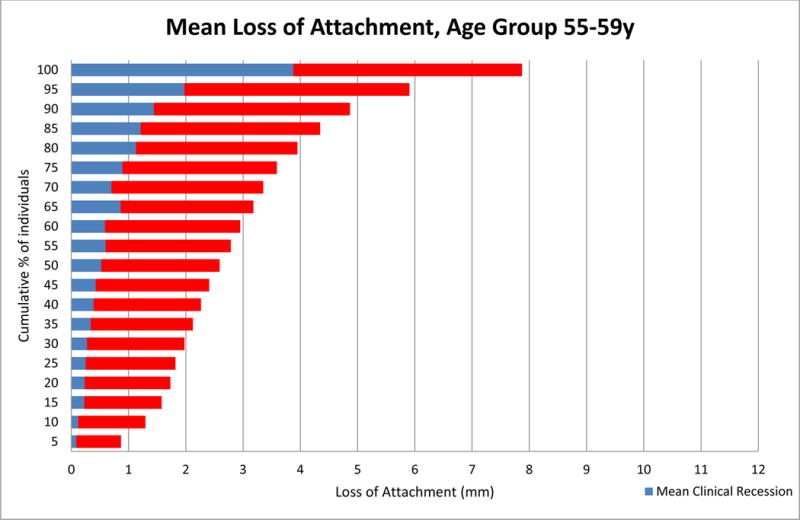
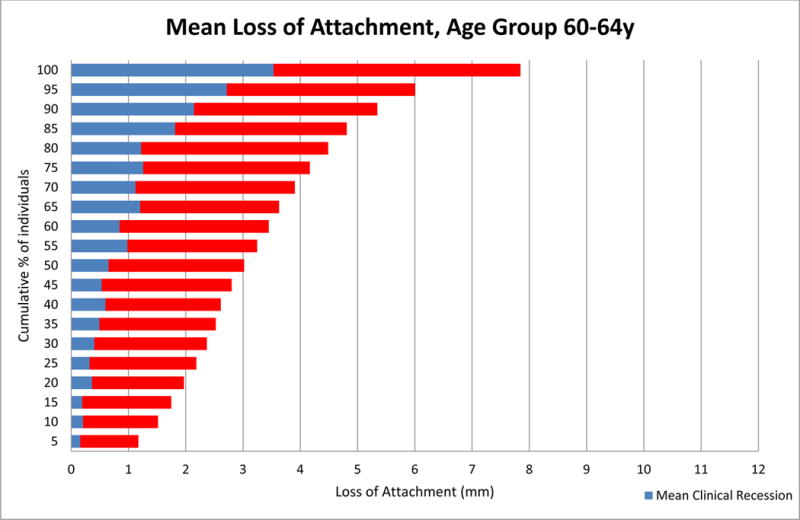
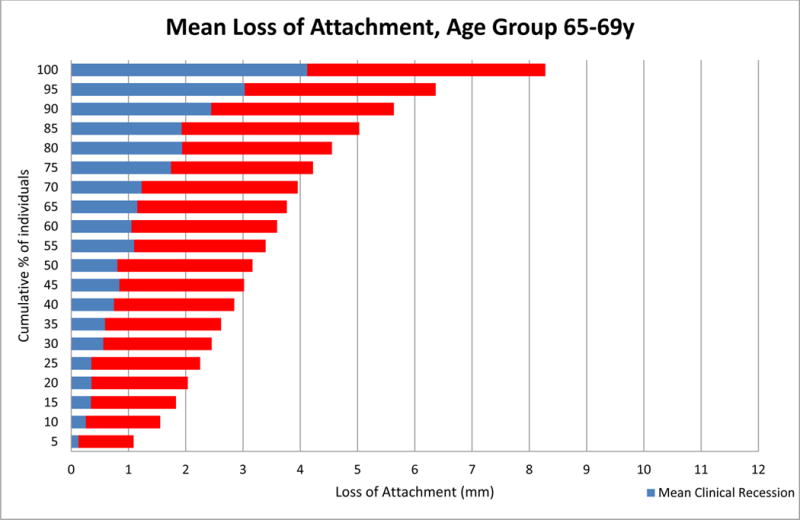
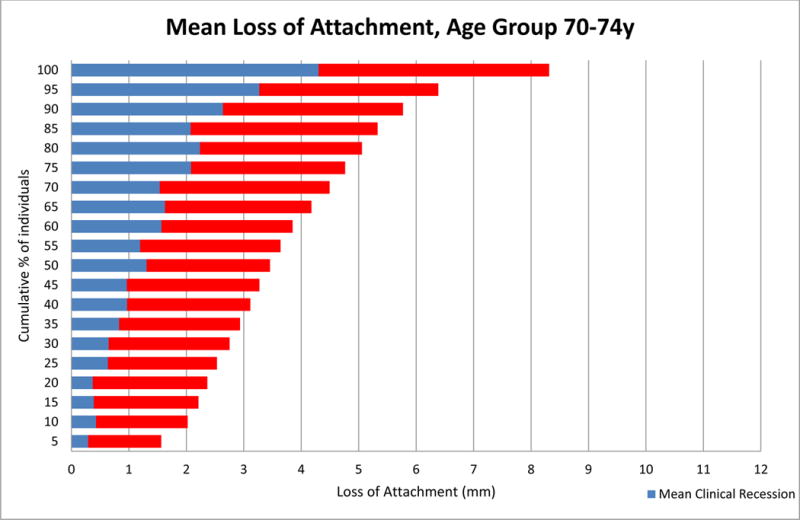
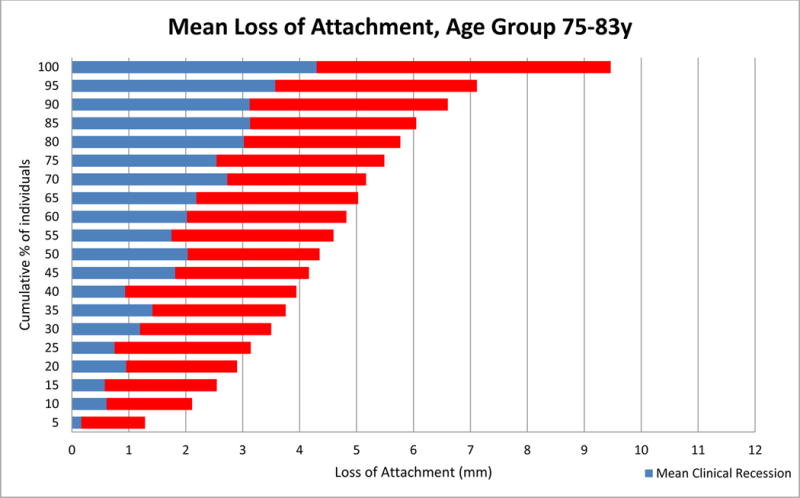
Objective: We used epidemiologic data of clinical periodontal status from two population-based samples in two countries, United States and Germany, to examine 1) the impact of age on the relative contribution of recession and pocketing on the distribution of clinical attachment loss, and 2) whether it is feasible to define age-dependent thresholds for severe periodontitis.

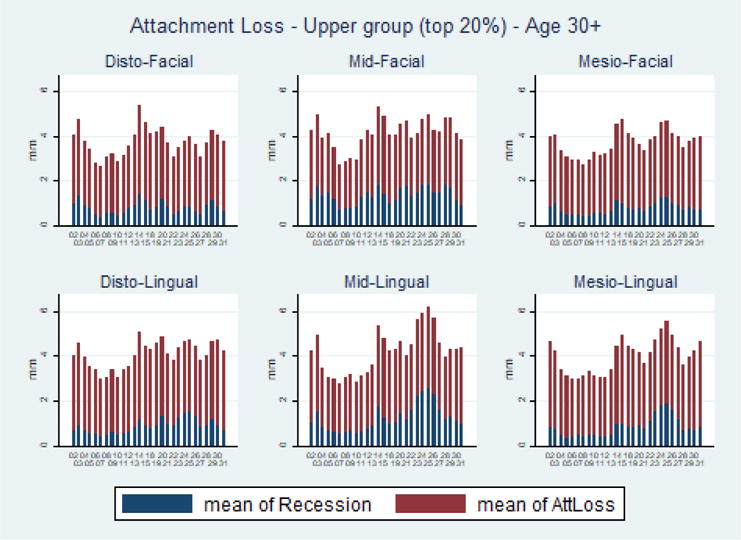
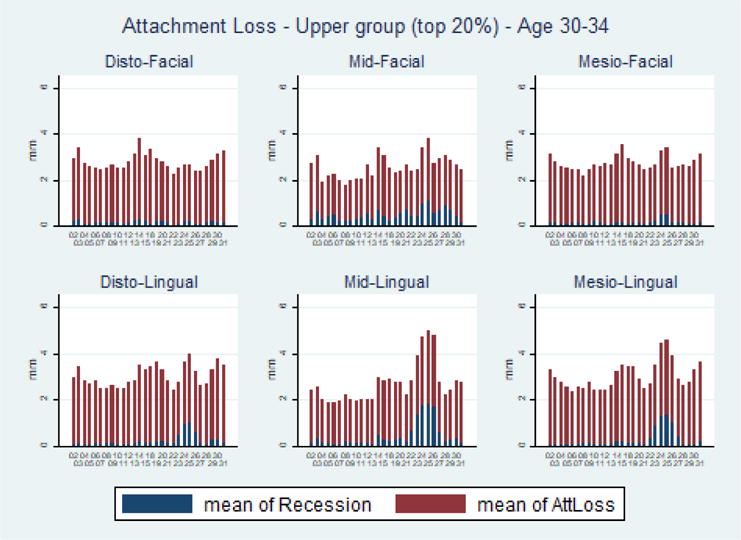
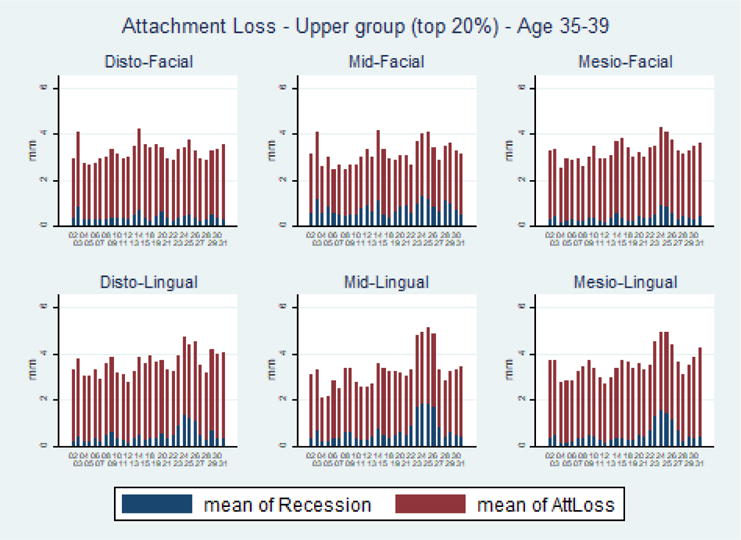
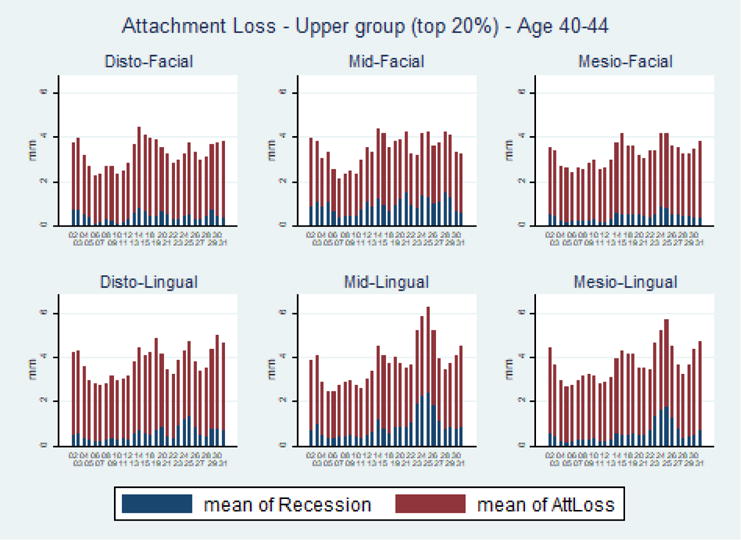
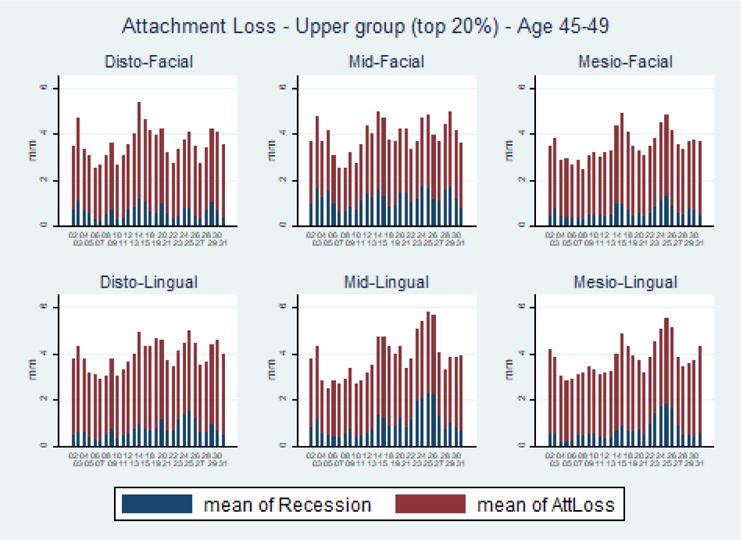
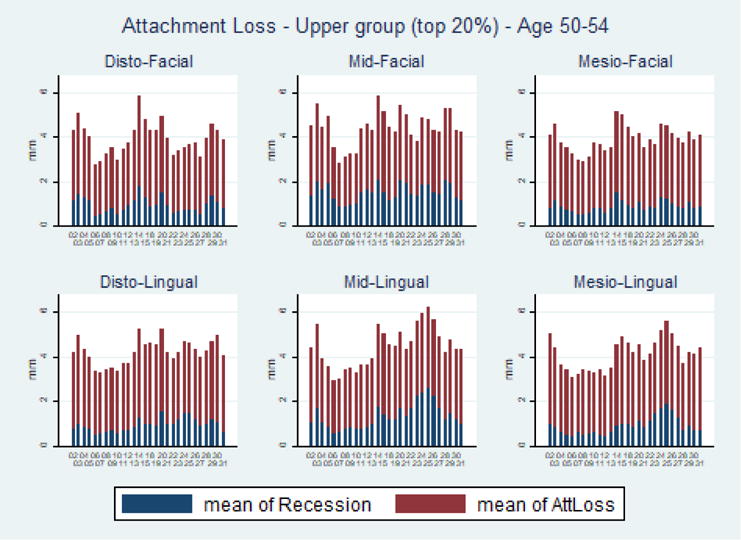
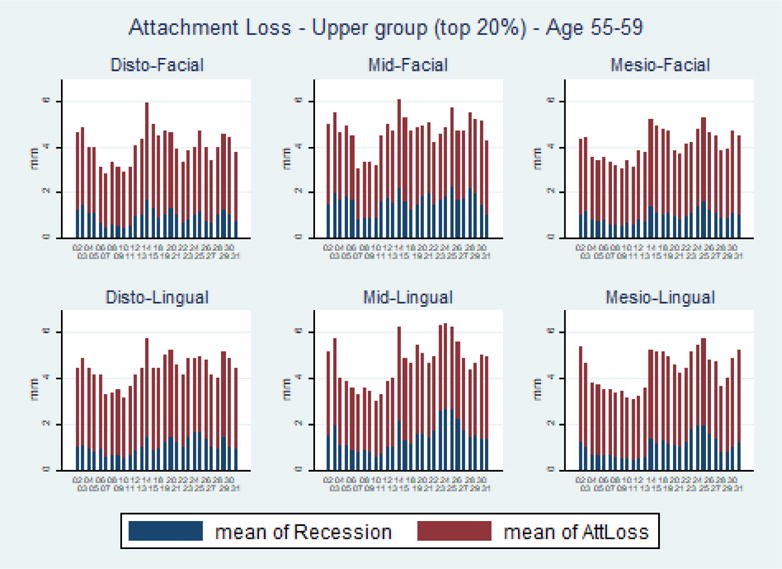
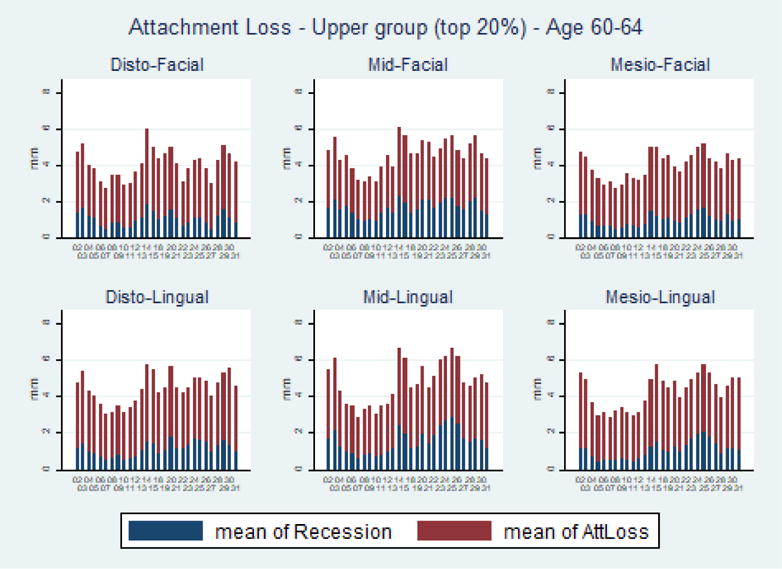
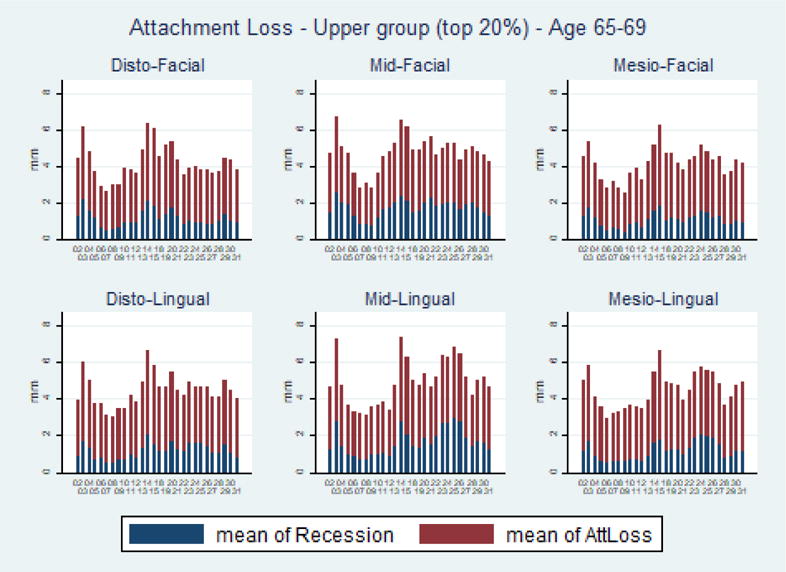
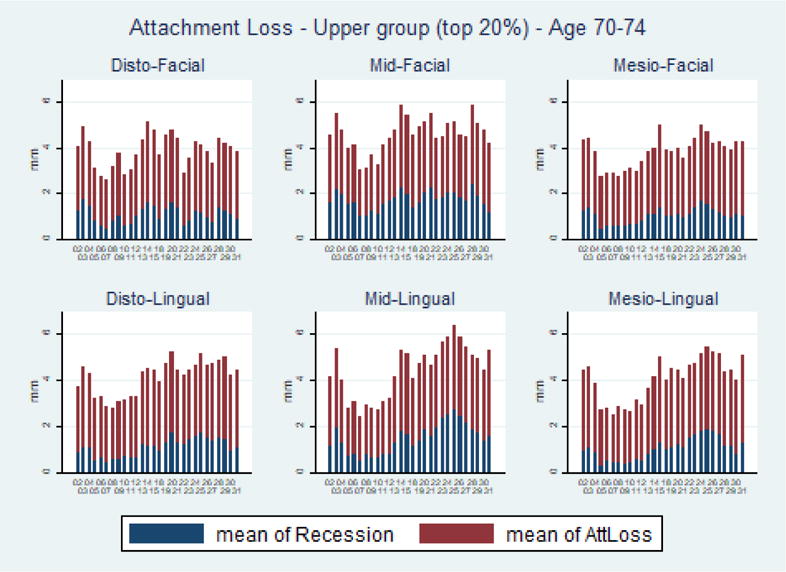
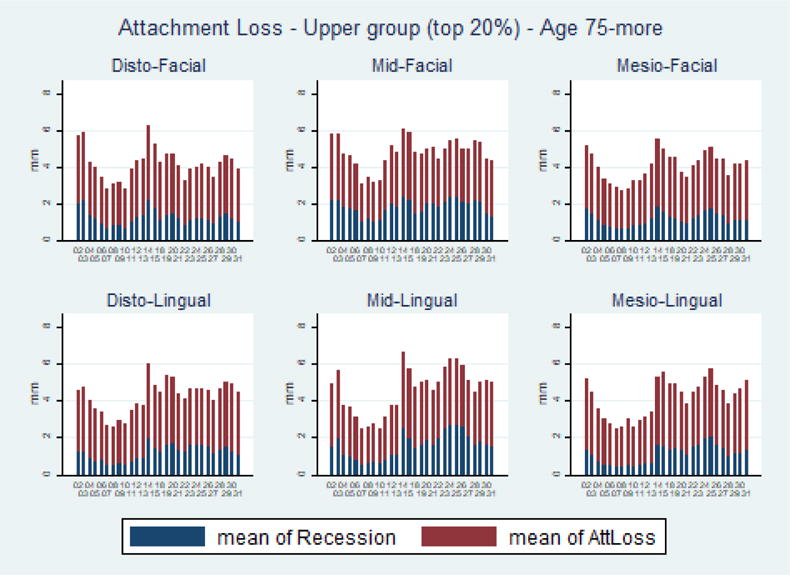
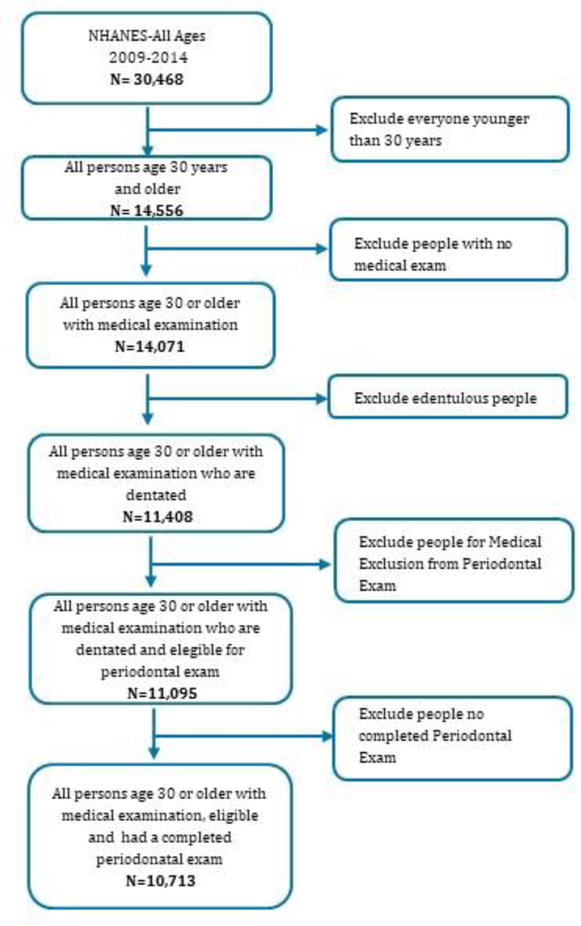
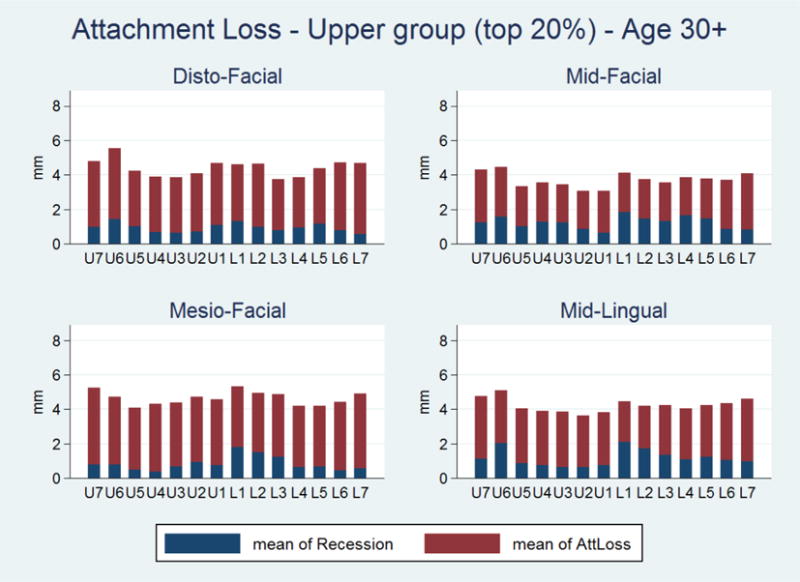
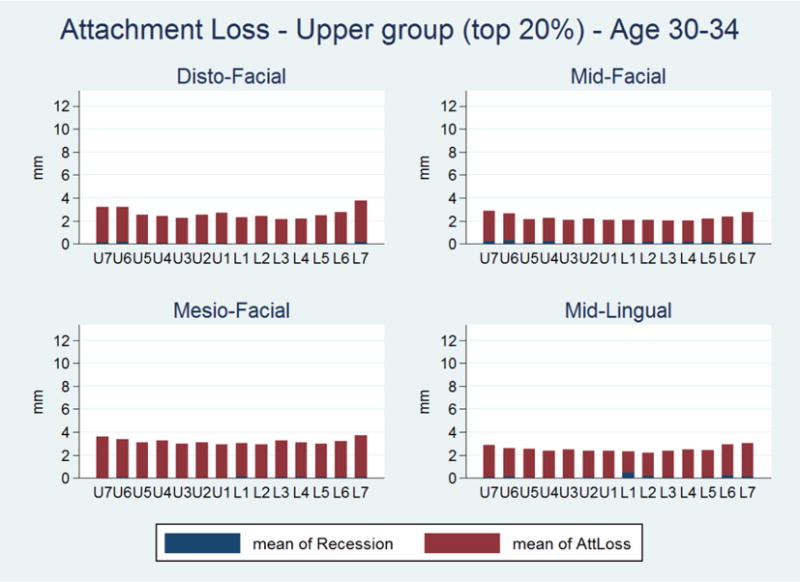
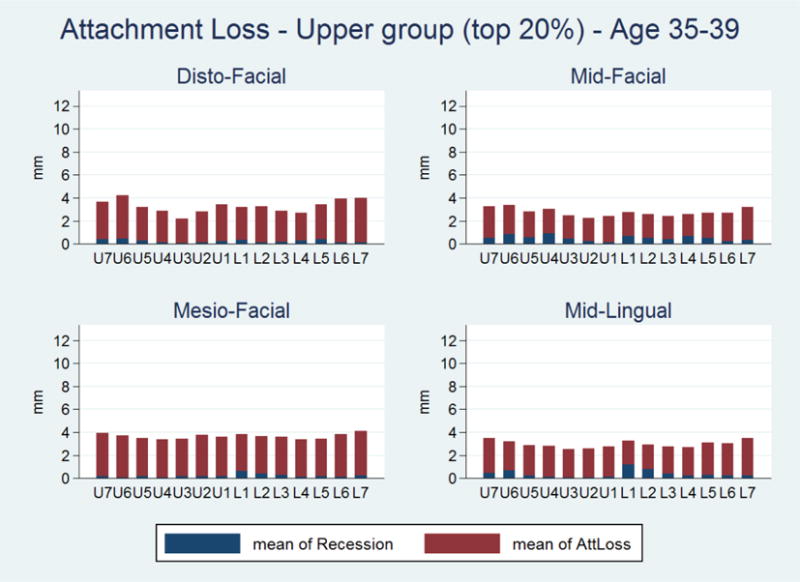
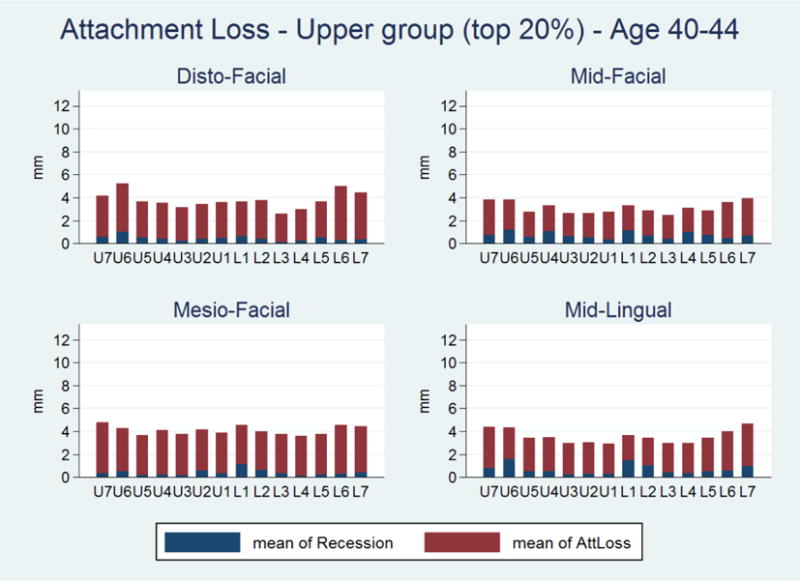
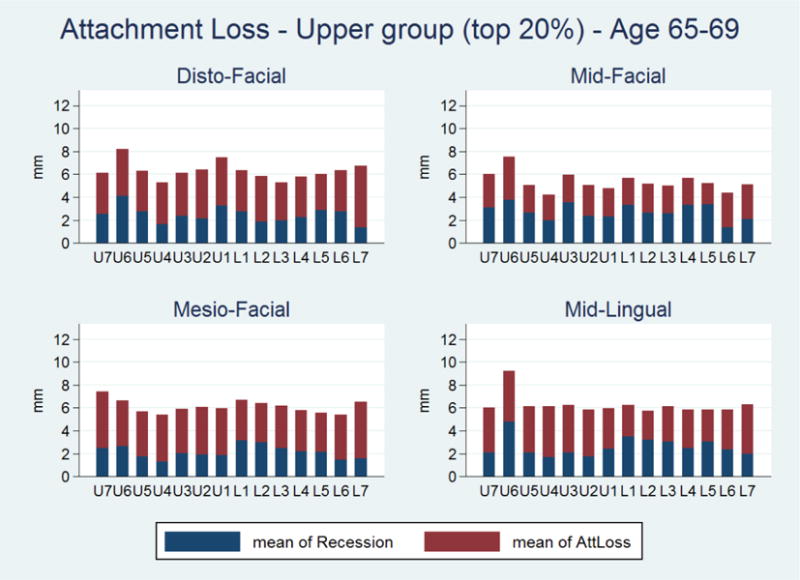
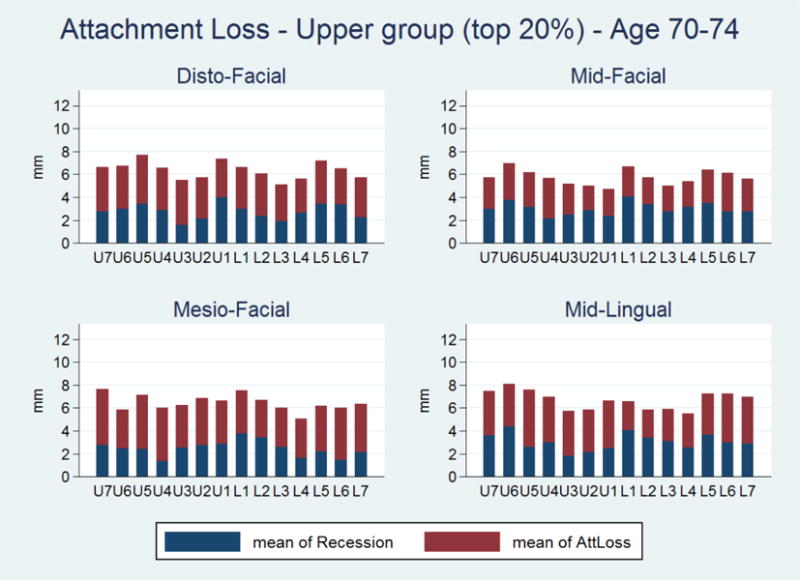
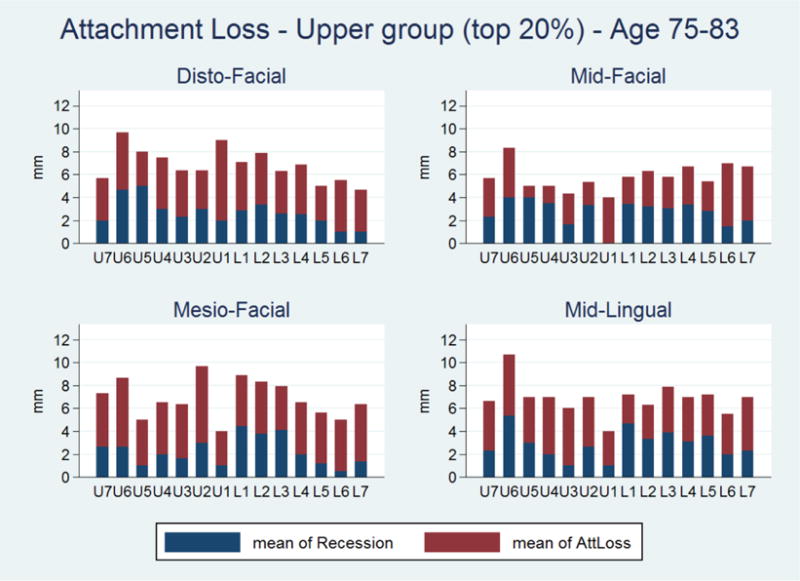
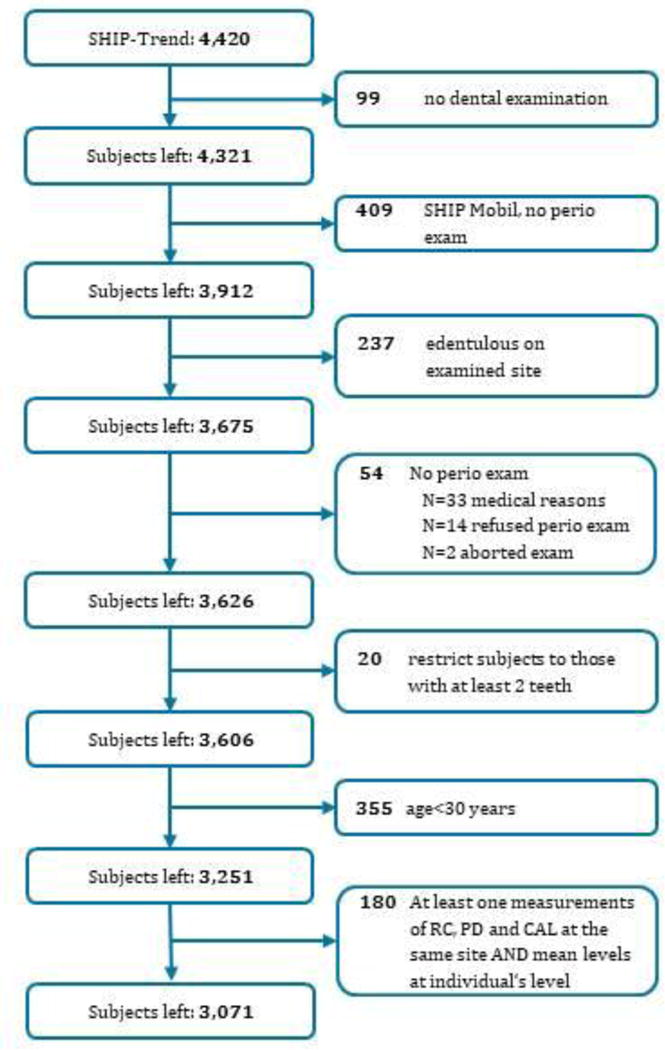
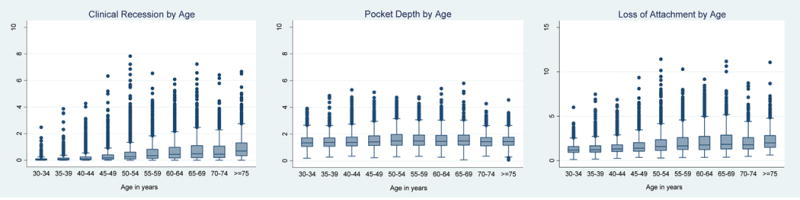
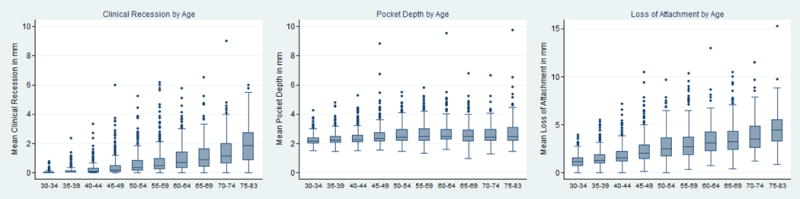
Methods: The analytical sample was based on persons aged ≥30 and included 10,713 individuals in the United States, participants in NHANES 2009 to 2014, and 3,071 individuals in Pomerania, Germany, participants in the SHIP-Trend 2008 to 2012. NHANES used a full-mouth examination protocol to collect data on recession (R), pocket depth (PD) and clinical attachment loss (CAL) for six sites/tooth on a maximum of 28 teeth; SHIP-Trend used a half-mouth examination at four sites/tooth. In both samples, percentile distributions of mean CAL/person were generated for each 5-year age interval. Age-dependent thresholds defining the upper quintile of mean CAL were calculated for both samples. The topographic intraoral distribution of CAL and the relative contribution of R and PD on CAL was assessed.

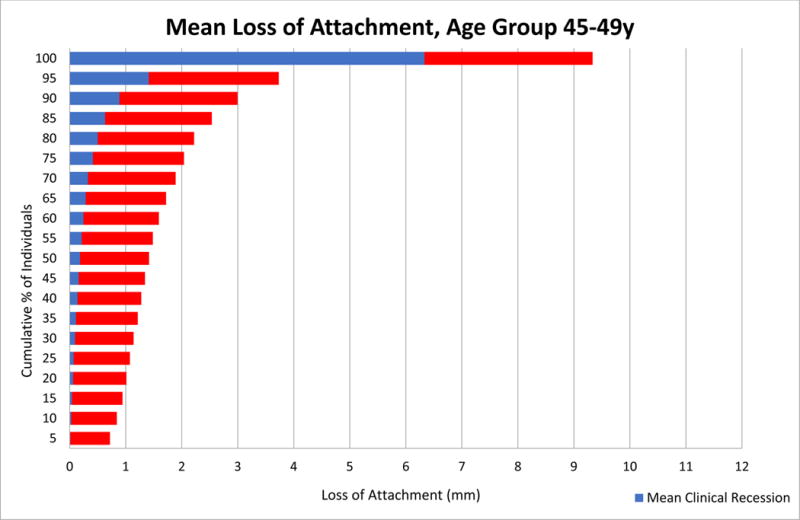
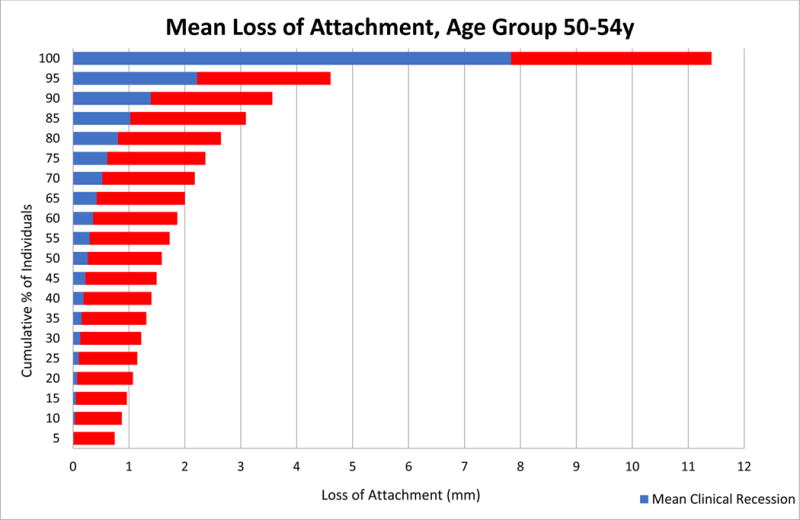
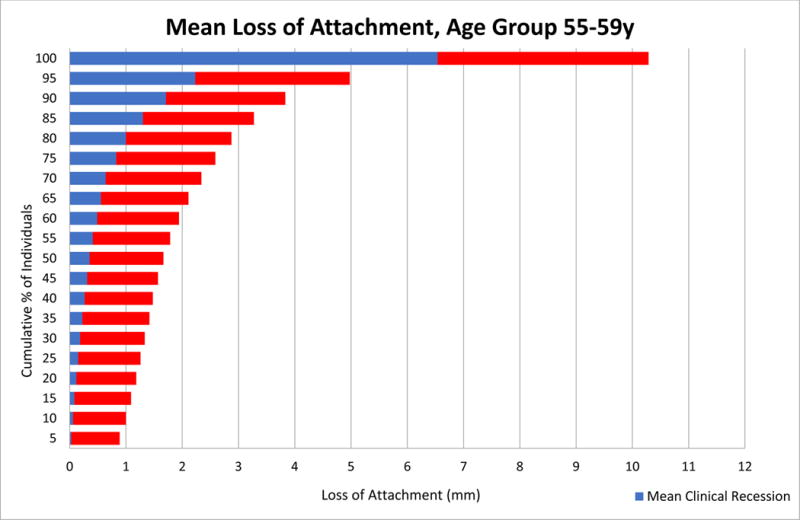
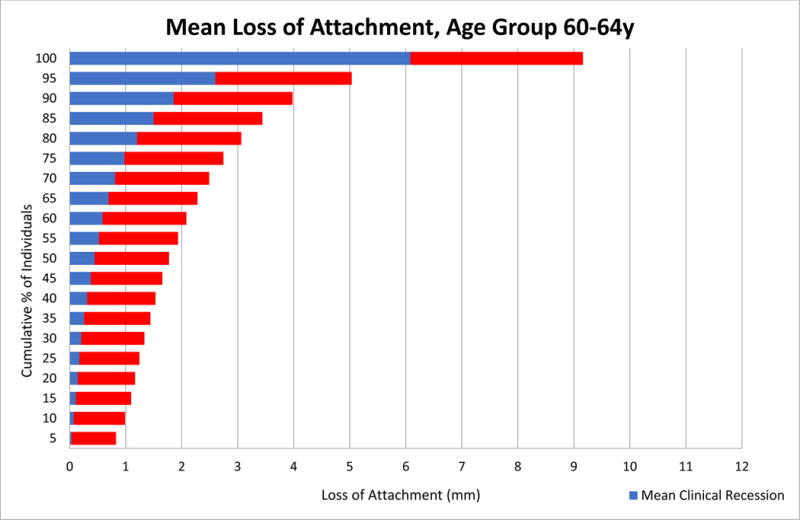
Results: Mean CAL increased linearly with age in both samples and was higher in SHIP-Trend than NHANES across the age spectrum. In contrast, mean PD was constant across age groups in both populations. R contributed increasingly to CAL with age, especially after 45 to 49 years. Upper quintile mean CAL thresholds in NHANES were < 3 mm for ages up to 39 years, and under 3.58 mm in all other age groups. Corresponding values in SHIP-Trend were also < 3 mm in ages up to 39 years but increased linearly with age up to 7.21 mm for ages ≥75 years.

Conclusions: Despite substantial differences in the overall severity of attachment loss between the two samples, common patterns of CAL and of the relative contribution of R and PD to CAL with increasing age were identified. Although periodontitis severity may vary in different populations, empirical evidence-driven definitions of CAL thresholds signifying disproportionate severity of periodontitis by age are feasible.

Keywords: classification; clinical attachment loss; epidemiology; periodontitis; pocket depth; recession.


Conflict of interest statement

The authors do not have any financial or other competing interests to declare.

Figures

Figure A
Figure A
Average Clinical Attachment Loss by Site – Upper Quintile, Total Sample, National Health and Nutrition Examination Survey (NHANES) 2009-2014
Figure B
Figure B
Average Clinical Attachment Loss by Site – Upper Quintile, Age 30-34, National Health and Nutrition Examination Survey (NHANES) 2009-2014
Figure C
Figure C
Average Clinical Attachment Loss by Site – Upper Quintile, Age 35-39, National Health and Nutrition Examination Survey (NHANES) 2009-2014
Figure D
Figure D
Average Clinical Attachment Loss by Site – Upper Quintile, Age 40-44, National Health and Nutrition Examination Survey (NHANES) 2009-2014
Figure E
Figure E
Average Clinical Attachment Loss by Site – Upper Quintile, Age 45-49, National Health and Nutrition Examination Survey (NHANES) 2009-2014
Figure F
Figure F
Average Clinical Attachment Loss by Site – Upper Quintile, Age 50-54, National Health and Nutrition Examination Survey (NHANES) 2009-2014
Figure G
Figure G
Average Clinical Attachment Loss by Site – Upper Quintile, Age 55-59, National Health and Nutrition Examination Survey (NHANES) 2009-2014
Figure H
Figure H
Average Clinical Attachment Loss by Site – Upper Quintile, Age 60-64, National Health and Nutrition Examination Survey (NHANES) 2009-2014
Figure I
Figure I
Average Clinical Attachment Loss by Site – Upper Quintile, Age 65-69, National Health and Nutrition Examination Survey (NHANES) 2009-2014
Figure J
Figure J
Average Clinical Attachment Loss by Site – Upper Quintile, Age 70-74, National Health and Nutrition Examination Survey (NHANES) 2009-2014
Figure K
Figure K
Average Clinical Attachment Loss by Site – Upper Quintile, Age 75-more, National Health and Nutrition Examination Survey (NHANES) 2009-2014
Figure L
Figure L
Flow Chart
Figure M
Figure M
Average Clinical Attachment Loss by Site – Upper Quintile, Total Sample, Study of Health in Pomerania (SHIP)-Trend 2008-2012
Figure N
Figure N
Average Clinical Attachment Loss by Site – Upper Quintile, Age 30-34, Study of Health in Pomerania (SHIP)-Trend 2008-2012
Figure O
Figure O
Average Clinical Attachment Loss by Site – Upper Quintile, Age 35-39, Study of Health in Pomerania (SHIP)-Trend 2008-2012
Figure P
Figure P
Average Clinical Attachment Loss by Site – Upper Quintile, Age 40-44, Study of Health in Pomerania (SHIP)-Trend 2008-2012
Figure Q
Figure Q
Average Clinical Attachment Loss by Site – Upper Quintile, Age 45-49, Study of Health in Pomerania (SHIP)-Trend 2008-2012
Figure R
Figure R
Average Clinical Attachment Loss by Site – Upper Quintile, Age 50-54, Study of Health in Pomerania (SHIP)-Trend 2008-2012
Figure S
Figure S
Average Clinical Attachment Loss by Site – Upper Quintile, Age 55-59, Study of Health in Pomerania (SHIP)-Trend 2008-2012
Figure T
Figure T
Average Clinical Attachment Loss by Site – Upper Quintile, Age 60-64, Study of Health in Pomerania (SHIP)-Trend 2008-2012
Figure U
Figure U
Average Clinical Attachment Loss by Site – Upper Quintile, Age 65-69, Study of Health in Pomerania (SHIP)-Trend 2008-2012
Figure V
Figure V
Average Clinical Attachment Loss by Site – Upper Quintile, Age 70-74, Study of Health in Pomerania (SHIP)-Trend 2008-2012
Figure X
Figure X
Average Clinical Attachment Loss by Site – Upper Quintile, Age 75-83, Study of Health in Pomerania (SHIP)-Trend 2008-2012
Figure Y
Figure Y
Flow Chart
Figure 1A
Figure 1A
Trend in mean loss of attachment, clinical recession and pocket depth by age group, National Health and Nutrition Examination Survey (NHANES), 2009-2014. Lines show quadratic fits to averages (points).
Figure 1B
Figure 1B
Trend in mean loss of attachment, clinical recession and pocket depth by age group, Study of Health in Pomerania (SHIP)-Trend 2008-2012. Lines show quadratic fits to averages (points).
Figure 2A
Figure 2A
Boxplots of mean clinical recession, mean pocket depth and mean loss of attachment by age groups, National Health and Nutrition Examination Survey (NHANES), 2009-2014.
Figure 2B
Figure 2B
Boxplots of mean clinical recession, mean pocket depth and mean loss of attachment by age groups, Study of Health in Pomerania (SHIP)-Trend 2008-2012.
Figure 3A
Figure 3A
Mean Loss of Attachment in Total Population, Full-Mouth Exam, National Health and Nutrition Examination Survey (NHANES) 2009-2014.
Figure 3B
Figure 3B
Mean Loss of Attachment in Age Group 30-34y, Full-Mouth Exam, National Health and Nutrition Examination Survey (NHANES) 2009-2014.
Figure 3C
Figure 3C
Mean Loss of Attachment in Age Group 35-39y, Full-Mouth Exam, National Health and Nutrition Examination Survey (NHANES) 2009-2014.
Figure 3D
Figure 3D
Mean Loss of Attachment in Age Group 40-44y, Full-Mouth Exam, National Health and Nutrition Examination Survey (NHANES) 2009-2014.
Figure 3E
Figure 3E
Mean Loss of Attachment in Age Group 45-49y, Full-Mouth Exam, National Health and Nutrition Examination Survey (NHANES) 2009-2014.
Figure 3F
Figure 3F
Mean Loss of Attachment in Age Group 50-54y, Full-Mouth Exam, National Health and Nutrition Examination Survey (NHANES) 2009-2014.
Figure 3G
Figure 3G
Mean Loss of Attachment in Age Group 55-59y, Full-Mouth Exam, National Health and Nutrition Examination Survey (NHANES) 2009-2014.
Figure 3H
Figure 3H
Mean Loss of Attachment in Age Group 60-64y, Full-Mouth Exam, National Health and Nutrition Examination Survey (NHANES) 2009-2014.
Figure 3I
Figure 3I
Mean Loss of Attachment in Age Group 65-69y, Full-Mouth Exam, National Health and Nutrition Examination Survey (NHANES) 2009-2014.
Figure 3J
Figure 3J
Mean Loss of Attachment in Age Group 70-74y, Full-Mouth Exam, National Health and Nutrition Examination Survey (NHANES) 2009-2014.
Figure 3K
Figure 3K
Mean Loss of Attachment in Age Group ≥75y, Full-Mouth Exam, National Health and Nutrition Examination Survey (NHANES) 2009-2014.
Figure 3L
Figure 3L
Mean Loss of Attachment in Total Population, Half-Mouth Exam, Study of Health in Pomerania (SHIP)-Trend 2008-2012.
Figure 3M
Figure 3M
Mean Loss of Attachment in Age Group 30-34y, Half-Mouth Exam, Study of Health in Pomerania (SHIP)-Trend 2008-2012.
Figure 3N
Figure 3N
Mean Loss of Attachment in Age Group 35-39y, Half-Mouth Exam, Study of Health in Pomerania (SHIP)-Trend 2008-2012.
Figure 3O
Figure 3O
Mean Loss of Attachment in Age Group 40-44y, Half-Mouth Exam, Study of Health in Pomerania (SHIP)-Trend 2008-2012.
Figure 3P
Figure 3P
Mean Loss of Attachment in Age Group 45-49y, Half-Mouth Exam, Study of Health in Pomerania (SHIP)-Trend 2008-2012.
Figure 3Q
Figure 3Q
Mean Loss of Attachment in Age Group 50-54y, Half-Mouth Exam, Study of Health in Pomerania (SHIP)-Trend 2008-2012.
Figure 3R
Figure 3R
Mean Loss of Attachment in Age Group 55-59y, Half-Mouth Exam, Study of Health in Pomerania (SHIP)-Trend 2008-2012.
Figure 3S
Figure 3S
Mean Loss of Attachment in Age Group 60-64y, Half-Mouth Exam, Study of Health in Pomerania (SHIP)-Trend 2008-2012.
Figure 3T
Figure 3T
Mean Loss of Attachment in Age Group 65-69y, Half-Mouth Exam, Study of Health in Pomerania (SHIP)-Trend 2008-2012.
Figure 3U
Figure 3U
Mean Loss of Attachment in Age Group 70-74y, Half-Mouth Exam, Study of Health in Pomerania (SHIP)-Trend 2008-2012.
Figure 3V
Figure 3V
Mean Loss of Attachment in Age Group 75-83y, Half-Mouth Exam, Study of Health in Pomerania (SHIP)-Trend 2008-2012.

References

    1. Centers for Disease Control and Prevention. National Health and Nutrition Examination Survey. Questionnaires, Datasets, and Related Documentation. Available at: http://www.cdc.gov/nchs/nhanes/nhanes_questionnaires.htm. Accessed September 29, 2017.
    1. World Health Organization Health Impact Assessment. The Determinants of Health. Available at http://www.who.int/hia/evidence/doh/en/. Accessed October 2017.
    1. Armitage GC. Development of a classification system for periodontal diseases and conditions. Ann Periodontol. 1999;4:1–6. doi: 10.1902/annals.1999.4.1.1. - DOI - PubMed
    1. Burt BA. Definitions of risk. J Dent Educ. 2001;65:1007–1008. - PubMed
    1. Dye BAAJ, Iafolla T. Overview and Quality Assurance for the Oral Health Component of the National Health and Nutrition Examination Survey (NHANES), 2011-2014. Under review 2017 - PMC - PubMed

Publication types

LinkOut - more resources