. 2018 Jun 21;13(6):e0199332.
doi: 10.1371/journal.pone.0199332. eCollection 2018.

B-1 cells and B-1 cell precursors prompt different responses to Wnt signaling

Affiliations

B-1 cells and B-1 cell precursors prompt different responses to Wnt signaling

Lika Osugui et al. PLoS One. .

Abstract

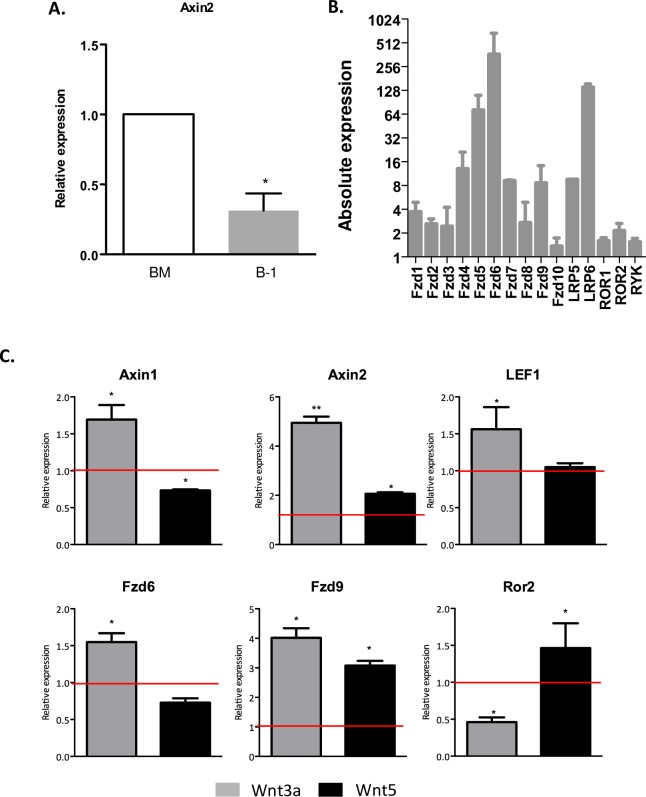
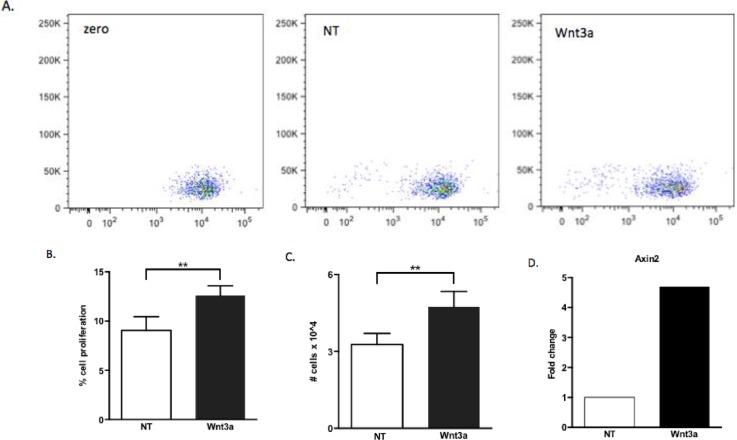
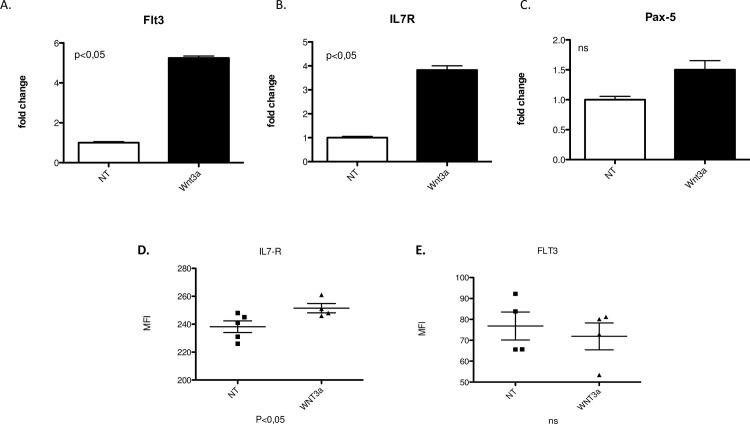
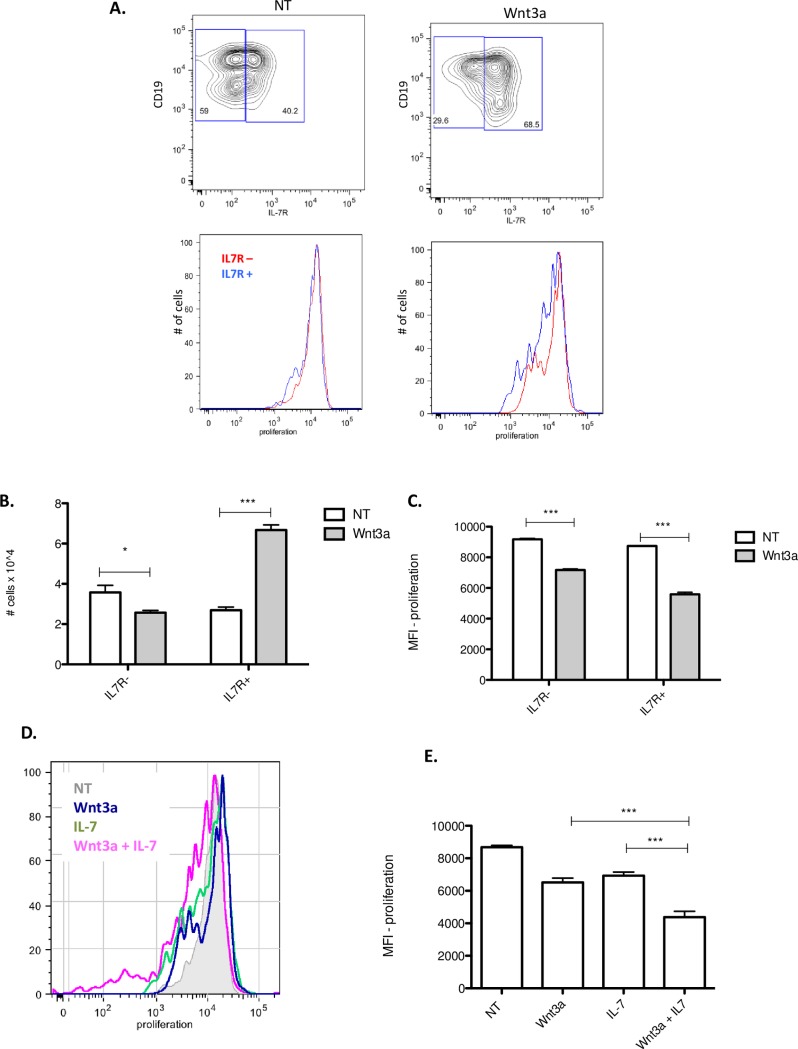
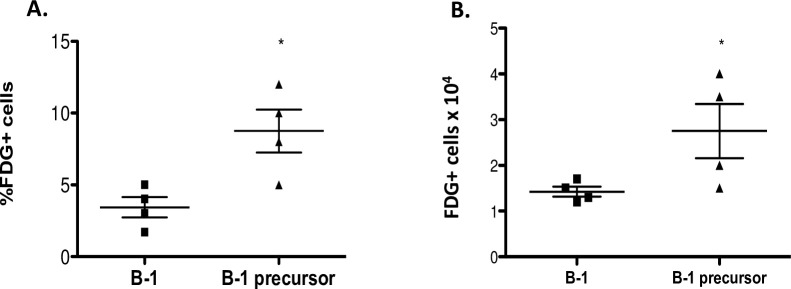
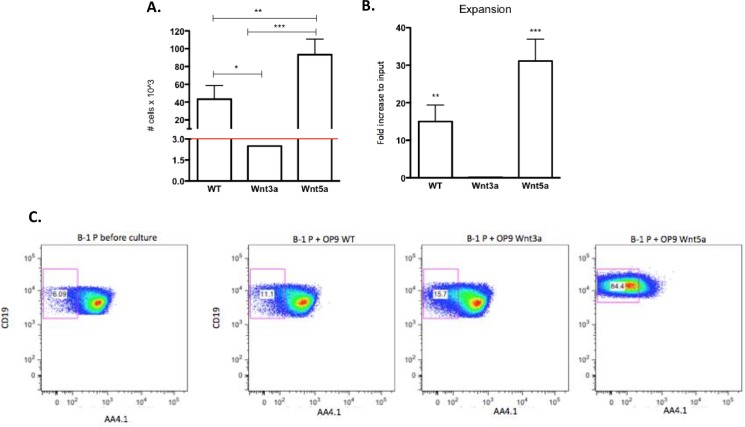
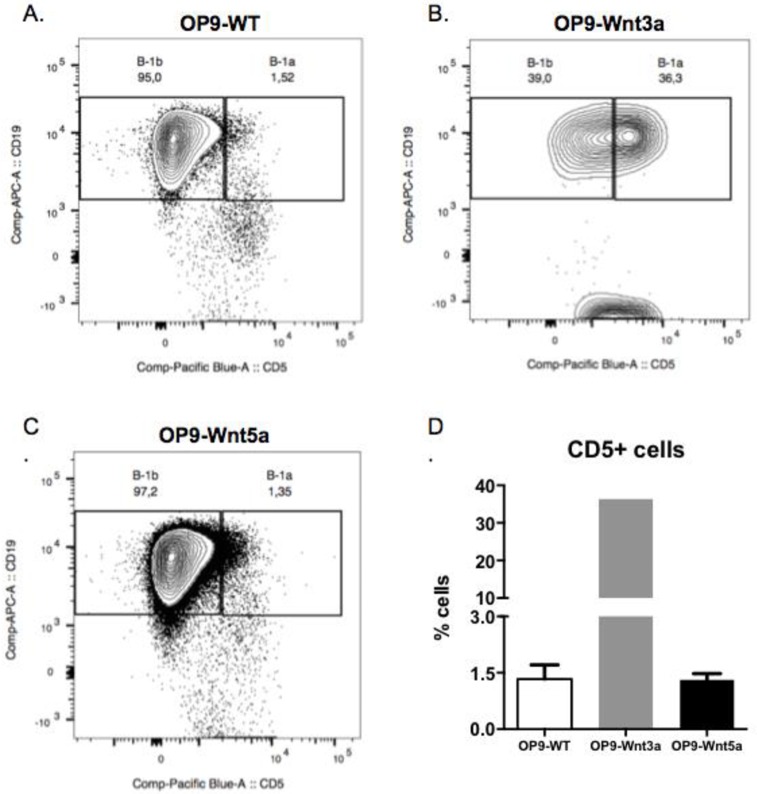
Recently several studies demonstrated a role for the Wnt pathway in lymphocyte development and self-renewal of hematopoietic stem cells (HSCs). B-1 cells constitute a separate lineage of B lymphocytes, originating during fetal hematopoiesis, expressing lymphoid and myeloid markers and possessing self-renewal ability, similar to early hematopoietic progenitors and HSCs. A plethora of studies have shown an important role for the evolutionary conserved Wnt pathway in the biology of HSCs and T lymphocyte development. Our previous data demonstrated abundant expression of Wnt pathway components by B-1 cells, including Wnt ligands and receptors. Here we report that the canonical Wnt pathway is activated in B-1 cell precursors, but not in mature B-1 cells. However, both B-1 precursors and B-1 cells are able to respond to Wnt ligands in vitro. Canonical Wnt activity promotes proliferation of B-1 cells, while non-canonical Wnt signals induce the expansion of B-1 precursors. Interestingly, using a co-culture system with OP9 cells, Wnt3a stimulus supported the generation of B-1a cells. Taking together, these results indicate that B-1 cells and their progenitors are differentially responsive to Wnt ligands, and that the balance of activation of canonical and non-canonical Wnt signaling may regulate the maintenance and differentiation of different B-1 cell subsets.


Conflict of interest statement

The authors have declared that no competing interests exist.

Figures

Fig 1
Fig 1. B-1 cells are responsive to Wnt ligands.
A) Relative expression of Axin2 by B-1 cells. Rplp0 gene was used as reference gene. Relative expression is 2-ΔΔCt, considering control bone marrow cells B-1 cells as a normalizer. Data from 3 biological samples per experiment, each one plated on triplicate. Data shown are representative of 2 experiments. *p<0,05 B) Expression of Wnt receptors, co-receptors and other Wnt target genes by purified B-1 cells determined using 2-ΔCT. Normalization was performed using Rplp0 as reference gene. Data from a representative of 3 experiments performed at triplicate of each biological sample (n = 3). C) Expression of Wnt target genes and receptors by B-1 cells stimulated in vitro by Wnt3a (100ng/ml) and Wnt5a (100ng/ml) daily for 3 days. Rplp0 gene was used as reference gene. Relative expression is 2-ΔΔCt, considering non-treated B-1 cells as a normalizer (red line). n = 3 biological sample per experiment, each one plated on triplicate. Data shown are representative of 2 experiments. *p<0,05 and **p<0,01 when indicated group were compared to non-treated cells.
Fig 2
Fig 2. Wnt3a increases B-1 cell proliferation in vitro.
Purified B-1 cells from C57BL/6 mice were were stimulated with recombinant Wnt3a protein (100ng/mL) was added daily. (A) Representative dot plots of proliferation of B-1 cells: time zero (zero), non- treated cells (NT) and in the presence of Wnt3a. After 72 hrs, percentage (B) and absolute number (C) of B-1 cells in proliferation were determined. The Wnt activation was evaluated by qPCR by Axin2 gene expression (D). Normalization was performed using Rplp0 as reference gene. Non-treated B-1 cells were used as normalizer sample. Relative expression was determined using 2-ΔΔCT. Data from a representative of 3 experiments performed at triplicate from 3 biological samples. **p≤0,001 (Mann-Whitney test).
Fig 3
Fig 3. IL7R overexpression in Wnt3-treated B-1 cells.
Purified B-1 cells from C57BL/6 mice were daily treated or not (NT) with 100 ng of Wnt3a (Wnt3a) recombinant. After 72 hrs, the relative expression of lymphoid transcription factors FLt3 (A), IL7R (B), Pax-5 (C) were calculated, using non-treated group (NT) as a normalized sample. Normalization was performed using Rplp0 as reference gene. Relative expression was determined using 2-ΔΔCT. Data from a representative of 2 experiments performed at triplicate. 3 biological samples were used in each experiment. *p≤0,01 and **p≤0,001 (Mann-Whitney test). D. MFI (Mean of Fluorescence Intensity) of IL7R expression by B-1 cells in the presence of Wnt3a or not (NT). Data from a representative of 2 experiments performed (n = 5). E. MFI (Mean of Fluorescence Intensity) of Flt3 expression by B-1 cells in the presence of Wnt3a or not (NT). Data from a representative of 2 experiments performed (n = 5).
Fig 4
Fig 4. Wnt3a stimulation increment proliferation of B-1 cells in response of IL7.
Purified B-1 cells from C57BL/6 mice were treated with Wnt3a (100ng/ml), IL-7 (50ng/ml) and Wnt3a+IL7 during 3 days. Non-treated cells (NT) were used as control group. A) Contour plots analysis of expression of CD19 and IL7R by non-treated B-1 cells or Wnt3a-treated B-1 cells. Histograms show the proliferation (CFSE decay) of IL7R+(blue) or IL7R-(red) B-1 cells in control group or Wnt3a group. The maximum of CFSE staining cells in time zero were considered to determine the region gate of non-proliferative cells. To measured the decay of fluorescence, which is not related to proliferation, B-1 cells cultured in a RPMI medium only was used. The decay of fluorescence in these samples was subtracted to the decay of fluorescence in the experimental groups to determine the gate region of fluorescence cells and also MFI. B) Absolute number of B-1 cells IL7R- or IL7R+ cells from non-treated group (NT) or Wnt3a treated group (Wnt3a). C) Proliferation of IL7R- or IL7R+ B-1 cells from non-treated group (NT) or Wnt3a treated group (Wnt3a) measured by decay in the MFI value. D) Histograms of CFSE decay (proliferation) of B-1 cells in the different groups: NT (non-treated), Wnt3a, IL-7, Wnt3a+IL7. E) Proliferation of B-1 cells was represented by MFI value in different conditions: NT (non-treated), Wnt3a, IL-7, Wnt3a+IL7. ***p<0,001, **p<0,01 and *p<0,05 (One way ANOVA). Data from a representative of 3 independent experiments performed in A,B and C and 2 independent experiments performed in D and E. Each experiment was performed using 3 biological samples.
Fig 5
Fig 5. Canonical Wnt signaling is activated in B-1 precursors, but not in B-1 cells.
B-1 progenitors from bone marrow and peritoneal B-1 cells from Axin2+/lacZ and WT mice were isolated and the canonical Wnt signaling analyzed based on β-galactosidase (FDG+) activity. The percentage (A-C) and absolute number (B-D) FDG+ of each cell population were then calculated. n = 3 mice per group. *p≤0,01 (Mann-Whitney test). WT mice not carrying the reporter transgene (Axin2+/lacZ) were used to define the FDG population. In order to calculate the percentage or absolute number of FDG+ cells of each subset, FDG+ amount was subtracted from amount of FDG+ cells in the WT mice in order to correct differences in background staining.
Fig 6
Fig 6. Wnt5a stimulates expansion of B-1P cells in vitro.
B-1P cells were co-cultivated onto OP9-WT (WT), Wnt3a-transduced OP9 (Wnt3a) or Wnt5a-transduced OP9 (Wnt5a) layers. After 9 days, the number of B-1P cells in these cultures was analyzed. (A) Absolute number of B-1P cells co-cultivated with OP9-WT, OP9-Wnt3a and OP9-Wnt5a after 9 days of co-culture. The initial input of B-1P was 3x10³ cells, which is represented by red line. (B) Expansion of B-1 cell precursor population after 9 days in co-culture with OP9-WT, OP9-Wnt3a and OP9-Wnt5a. The graphs represents fold change increase in relation to input of cells. It was calculated as the number of B-1 cell precursors after 9 days in culture normalized by the initial input (3x10³ cells). (C) Dot plots of expression of CD19X AA4.1 by B-1P cells before culture and after 9 days in culture with OP9-WT, OP9-WNt3a, OP9-Wnt5a. Results are representative of 2 experiments performed in triplicate (n = 3). ***p<0,001, **p<0,01 and *p<0,05. (One way ANOVA).
Fig 7
Fig 7. Generation of CD5+ B-1 cells from B-1P cells in vitro in the presence of Wnt3a.
Analysis of CD19+CD5- and CD19+CD5+ cells generated in the co-cultures of B-1P cells with OP9 stromal cells (A), Wnt3a-transduced OP9 cells (B) and Wnt5a-transduced OP9 cells (C). Dot plots CD19xCD5 were generated from AA4.1-cell population. The co-cultures were maintained for 9 days. (D) Percentage of CD19+CD5- (B-1a) cells generated in each cell culture condition. Results are representative of 2 experiments performed in triplicate **p≤0,001 (Mann-Whitney test).

Similar articles

Cited by

References

    1. Montecino-Rodriguez E, Leathers H, Dorshkind K. Identification of a B-1 B cell-specified progenitor. Nat Immunol. 2006;7(3):293–301. Epub 2006/01/24. doi: 10.1038/ni1301 . - DOI - PubMed
    1. Dorshkind K, Montecino-Rodriguez E. Fetal B-cell lymphopoiesis and the emergence of B-1-cell potential. Nat Rev Immunol. 2007;7(3):213–9. doi: 10.1038/nri2019 . - DOI - PubMed
    1. Yoshimoto M, Montecino-Rodriguez E, Ferkowicz MJ, Porayette P, Shelley WC, Conway SJ, et al. Embryonic day 9 yolk sac and intra-embryonic hemogenic endothelium independently generate a B-1 and marginal zone progenitor lacking B-2 potential. Proc Natl Acad Sci U S A. 2011;108(4):1468–73. doi: 10.1073/pnas.1015841108 ; PubMed Central PMCID: PMCPMC3029764. - DOI - PMC - PubMed
    1. Montecino-Rodriguez E, Dorshkind K. B-1 B cell development in the fetus and adult. Immunity. 2012;36(1):13–21. doi: 10.1016/j.immuni.2011.11.017 ; PubMed Central PMCID: PMCPMC3269035. - DOI - PMC - PubMed
    1. Kantor AB, Herzenberg LA. Origin of murine B cell lineages. Annual review of immunology. 1993;11:501–38. Epub 1993/01/01. doi: 10.1146/annurev.iy.11.040193.002441 . - DOI - PubMed

Publication types