

Transcriptome profiling analysis reveals biomarkers in colon cancer samples of various differentiation
- PMID: 29928385
- PMCID: PMC6006489
- DOI: 10.3892/ol.2018.8668
Transcriptome profiling analysis reveals biomarkers in colon cancer samples of various differentiation
Abstract
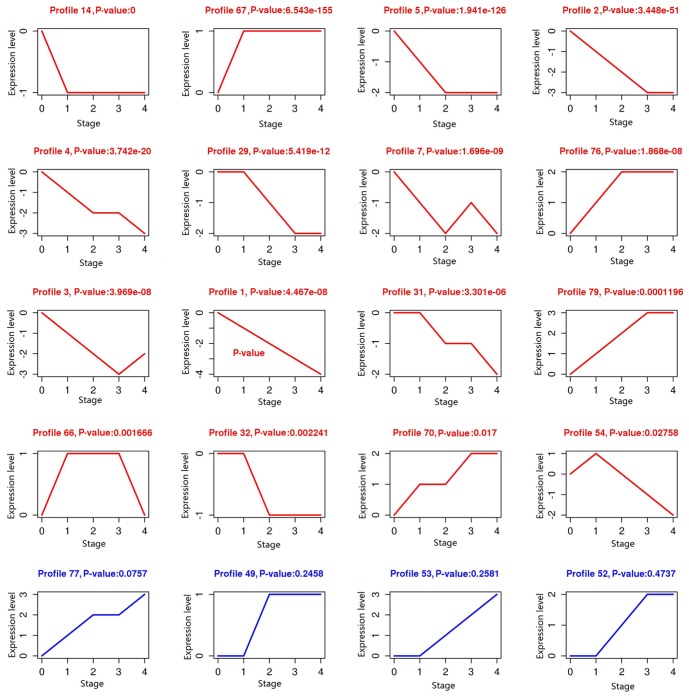
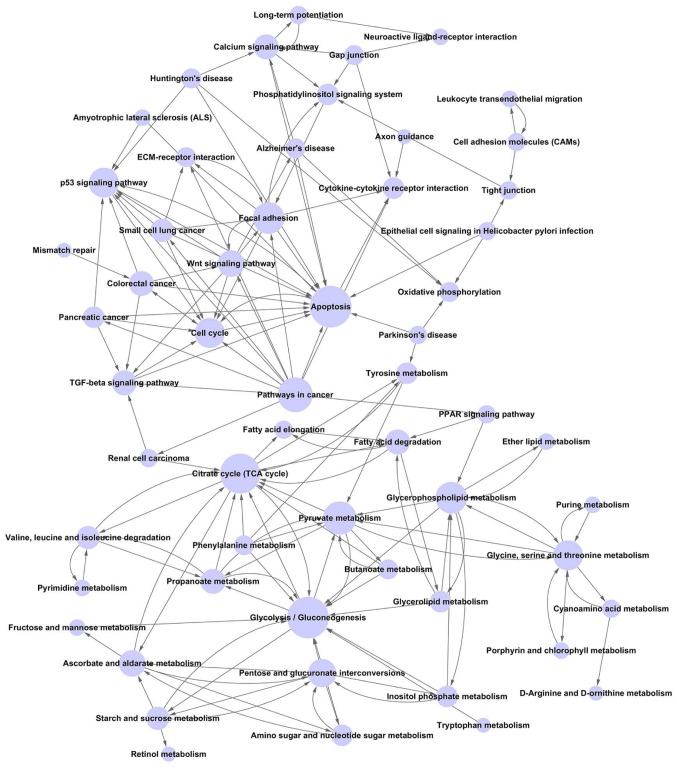
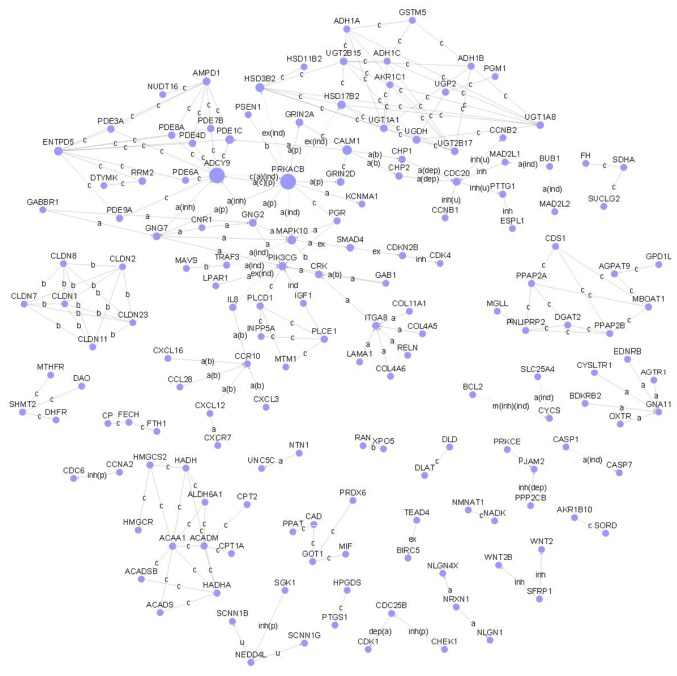
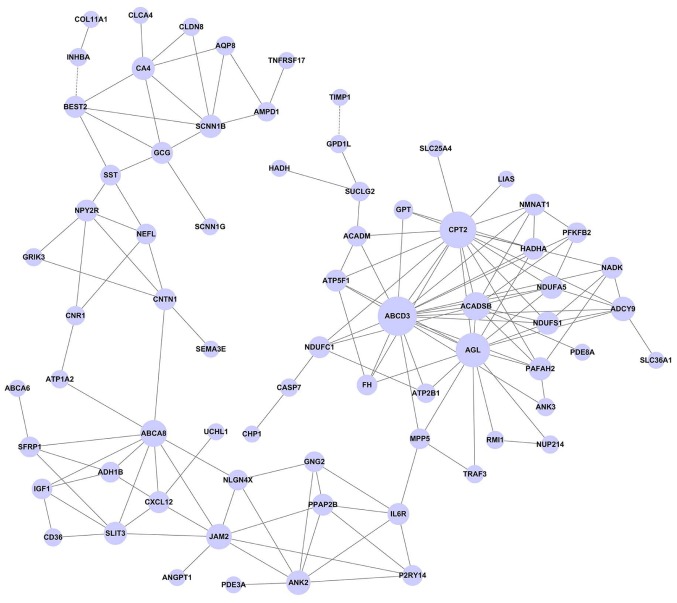
The aim of the present study was to investigate more colon cancer-related genes in different stages. Gene expression profile E-GEOD-62932 was extracted for differentially expressed gene (DEG) screening. Series test of cluster analysis was used to obtain significant trending models. Based on the Gene Ontology and Kyoto Encyclopedia of Genes and Genomes databases, functional and pathway enrichment analysis were processed and a pathway relation network was constructed. Gene co-expression network and gene signal network were constructed for common DEGs. The DEGs with the same trend were clustered and in total, 16 clusters with statistical significance were obtained. The screened DEGs were enriched into small molecule metabolic process and metabolic pathways. The pathway relation network was constructed with 57 nodes. A total of 328 common DEGs were obtained. Gene signal network was constructed with 71 nodes. Gene co-expression network was constructed with 161 nodes and 211 edges. ABCD3, CPT2, AGL and JAM2 are potential biomarkers for the diagnosis of colon cancer.
Keywords: biomarker; colon cancer; different stage; differently expressed genes.
Figures
References
-
- Li QC, Liang Y, Tian Y, Hu GR. Arctigenin induces apoptosis in colon cancer cells through ROS/p38MAPK pathway. J BUON. 2016;21:87–94. - PubMed
-
- Gao XY, Wang XL. An adoptive T cell immunotherapy targeting cancer stem cells in a colon cancer model. J BUON. 2015;20:1456–1463. - PubMed
-
- Gatzidou E, Mantzourani M, Giaginis C, Giagini A, Patsouris E, Kouraklis G, Theocharis S. Augmenter of liver regeneration gene expression in human colon cancer cell lines and clinical tissue samples. J BUON. 2015;20:84–91. - PubMed
LinkOut - more resources
Full Text Sources
Other Literature Sources
Miscellaneous