. 2018 Jun 1;9(42):26679-26700.
doi: 10.18632/oncotarget.25465.

An NFκB-dependent mechanism of tumor cell plasticity and lateral transmission of aggressive features

Affiliations

An NFκB-dependent mechanism of tumor cell plasticity and lateral transmission of aggressive features

Nancy Adriana Espinoza-Sánchez et al. Oncotarget. .

Abstract

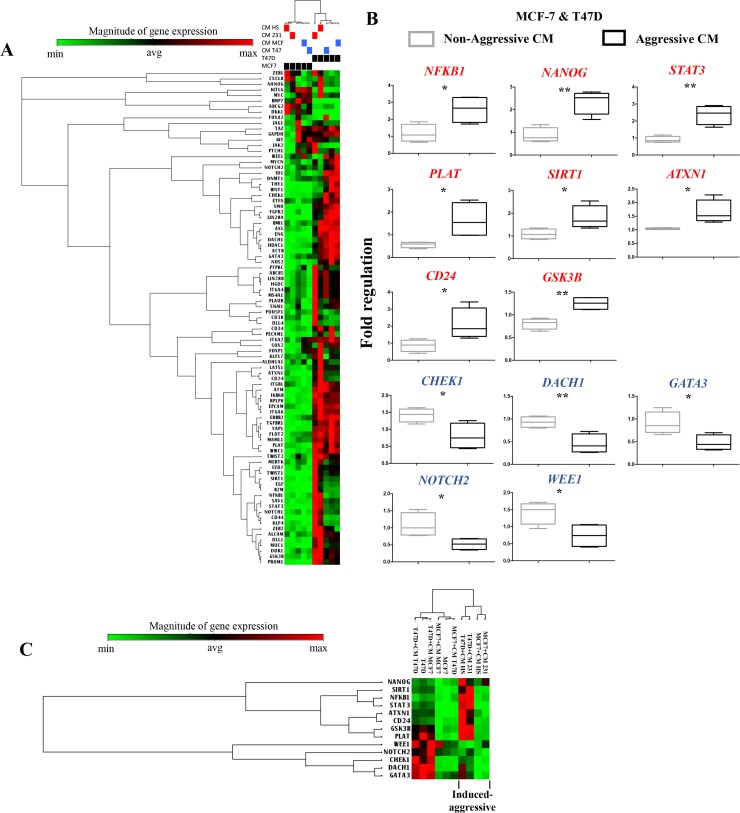
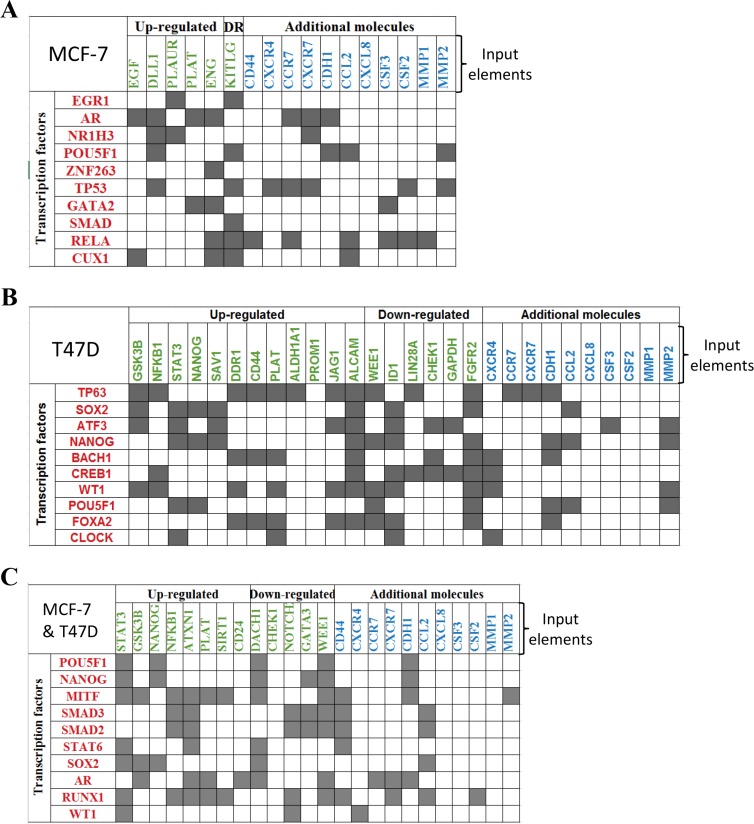
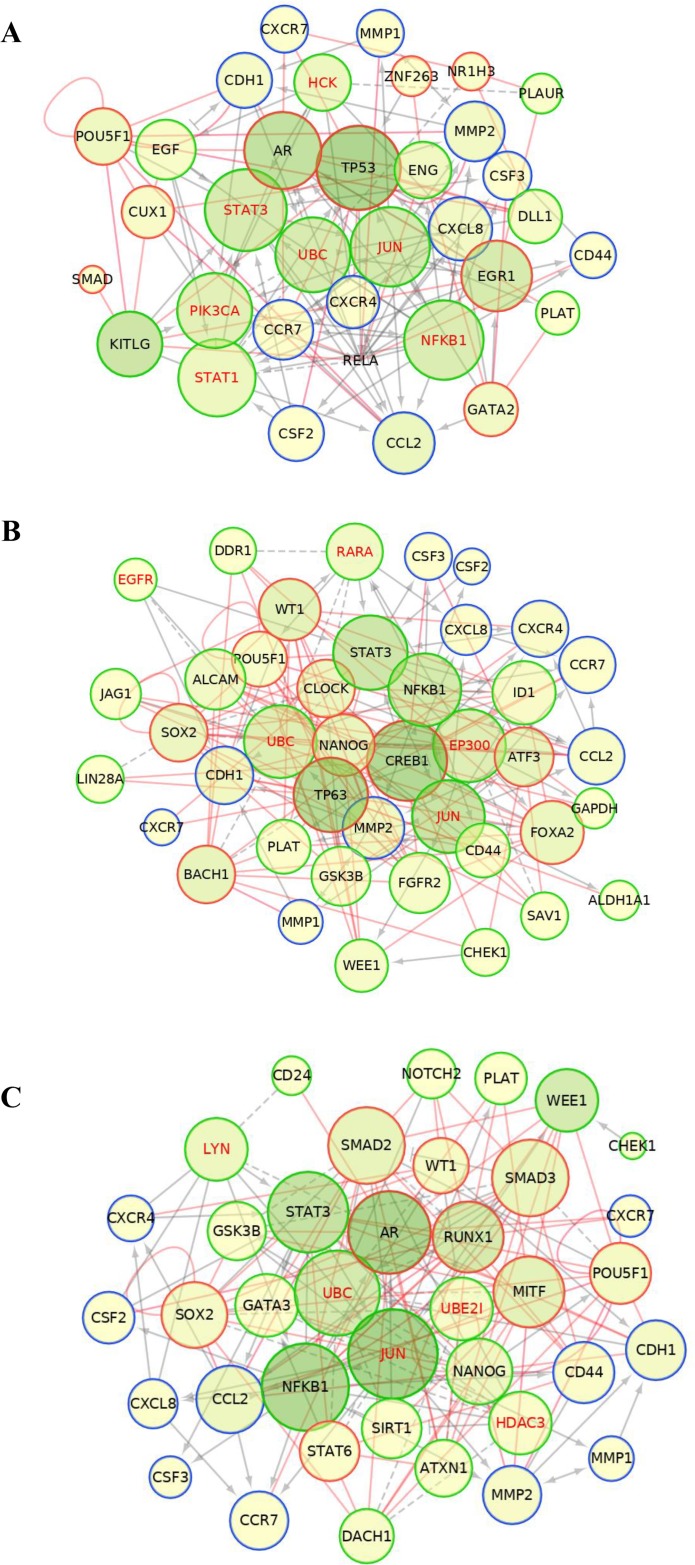
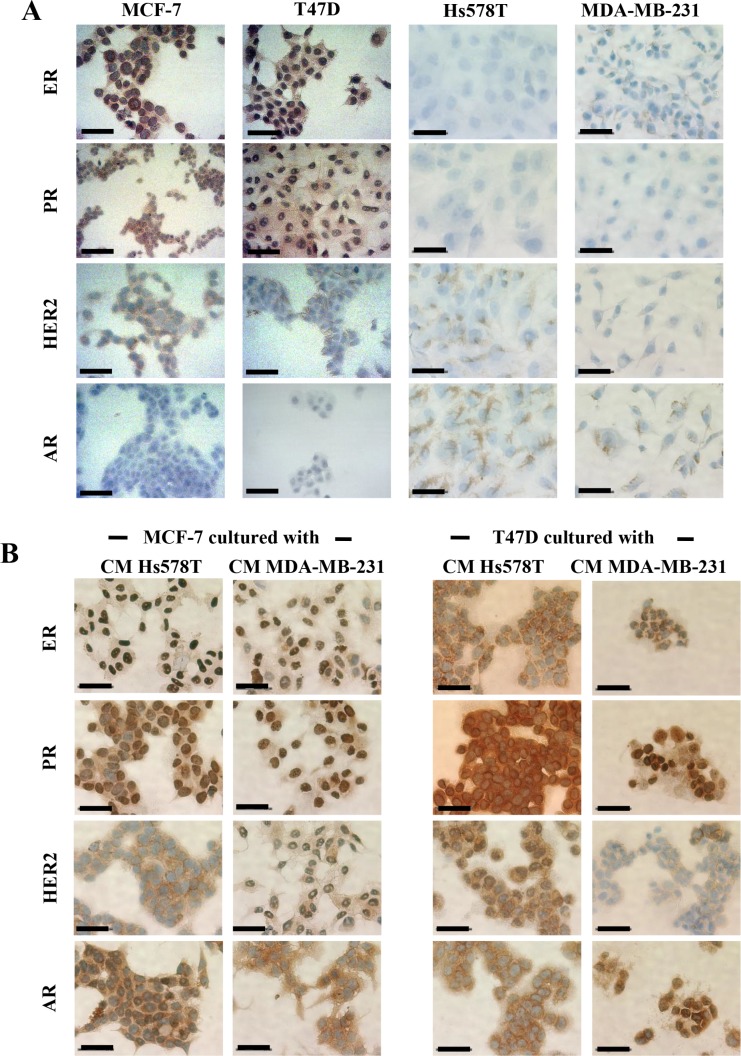
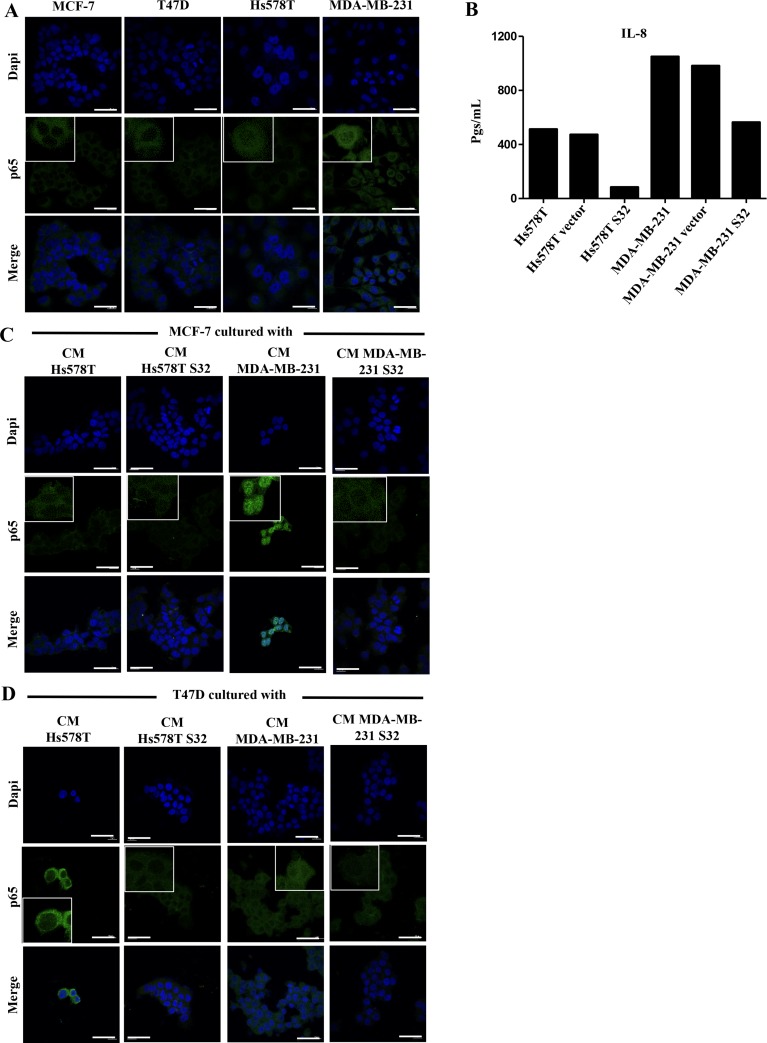
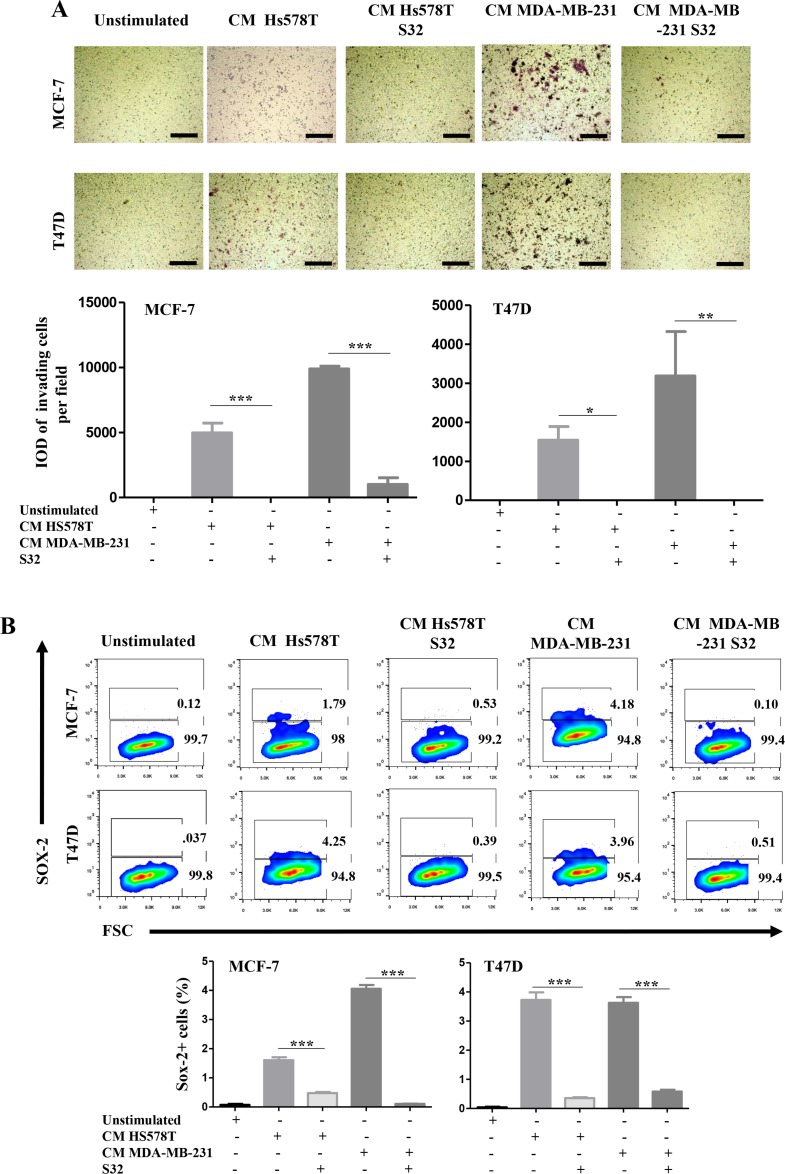
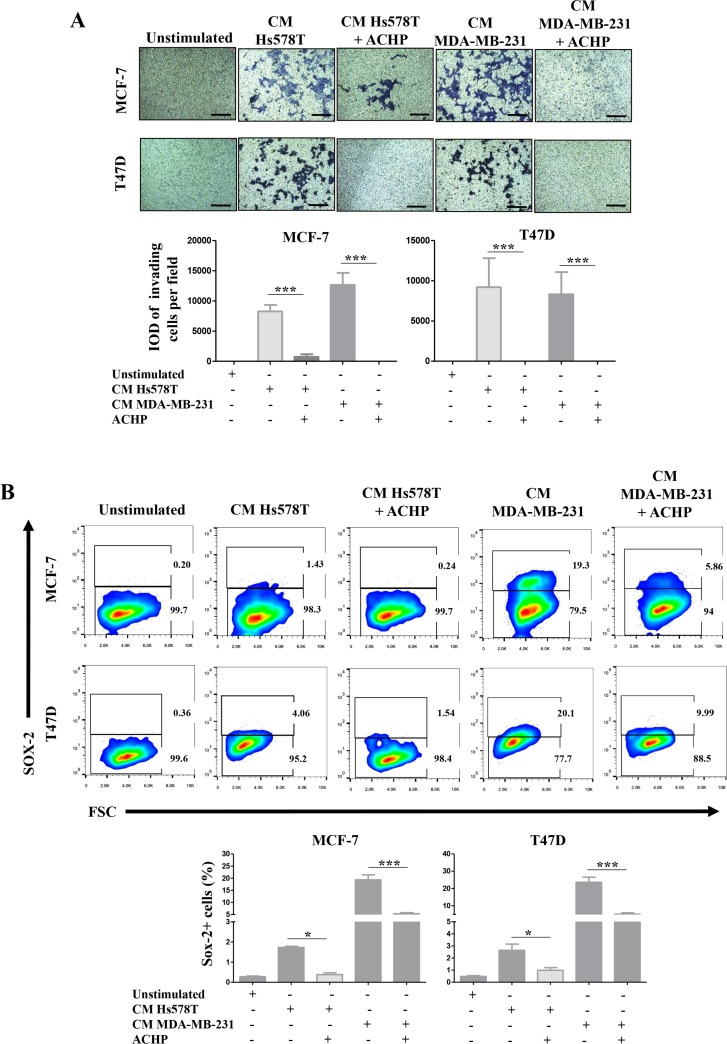
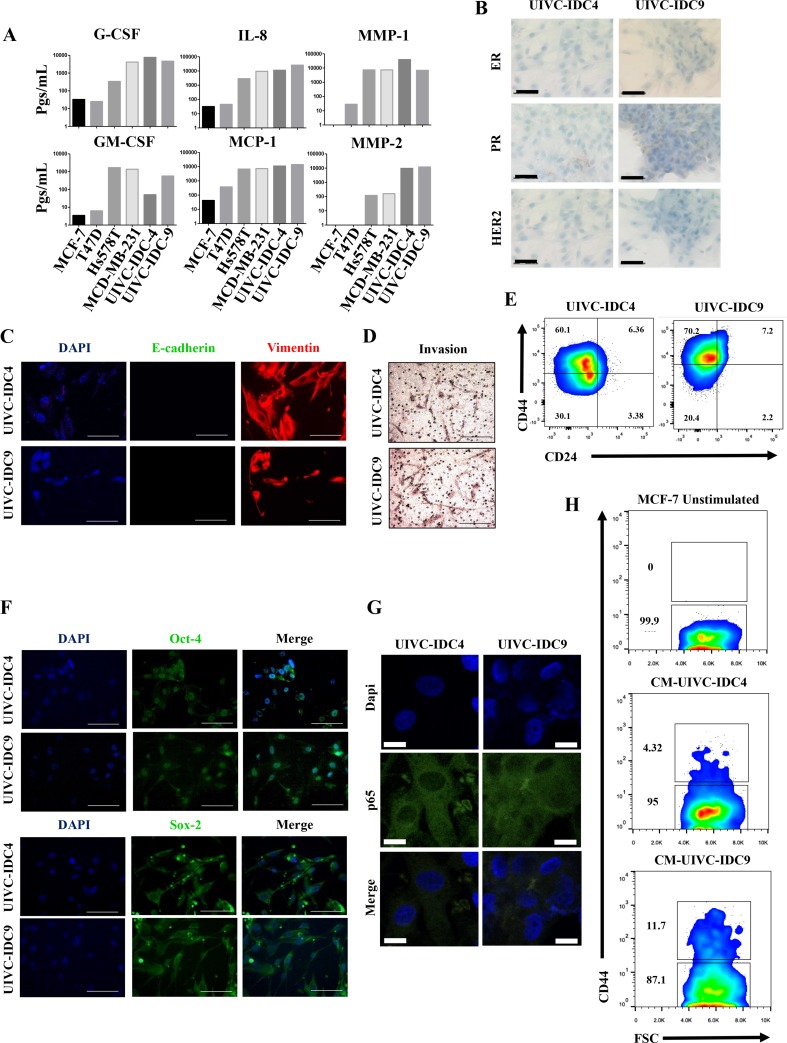
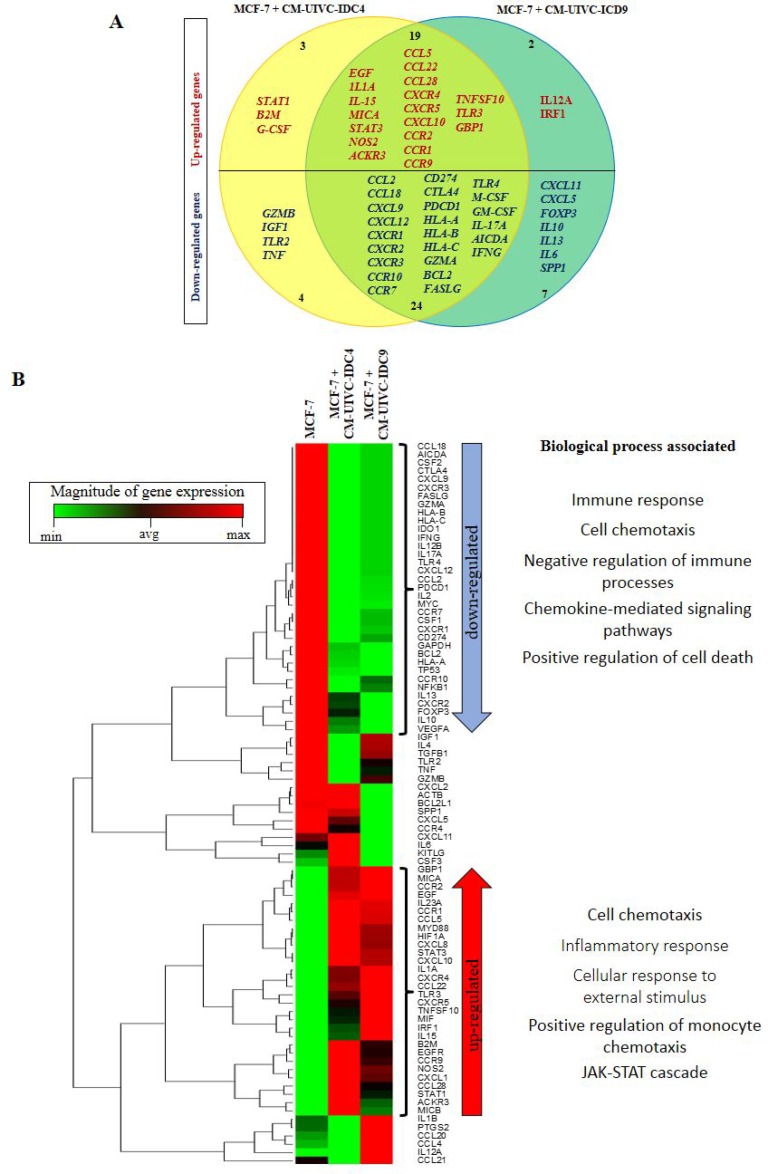
Breast cancer is a complex disease exhibiting extensive inter- and intra-tumor heterogeneity. Inflammation is a well-known driver of cancer progression, often attributed to immune cells infiltrating the tumor stroma. However, tumor cells themselves are capable to secrete a variety of inflammatory molecules, of which we understand very little about their role in intra-clonal communication. We recently reported the capacity of triple negative cell lines to induce a cancer stem cell (CSC)-like phenotype and invasion properties into luminal cells, a mechanism mediated by pro-inflammatory cytokines that up-regulated the CXCL12/CXCR4/CXCR7 chemokine signaling axis. We performed transcriptional array analyses of CSCs-associated genes and cancer-inflammatory cell crosstalk genes and built regulatory networks with the data collected. We found a specific molecular signature segregating with the induced-invasive/stemness phenotype. Regulatory network analysis pointed out to an NFκB transcriptional signature, active in aggressive triple negative cells and in induced-invasive/CSC-like luminal cells. In agreement, NFκB inhibition abolished the induction of the stemness/invasive features. These data support an NFκB dependent mechanism of intra-clonal communication responsible for tumor cell plasticity leading the acquisition of cancer aggressive features. Understanding the communication between different tumor clones would help to find better therapeutic and prophylactic targets to prevent BrC progression and relapse.

Keywords: Intra-tumor heterogeneity and intra-clonal communication; NFκB and STAT signaling pathways; cancer stem cells; invasion; tumor aggression.


Conflict of interest statement

CONFLICTS OF INTEREST The authors declare that they have no conflicts of interest.

Figures

Figure 1
Figure 1. Gene expression signature associated with cancer stem cells during the acquisition of the induced invasive/CSC-like phenotype
(A) Unsupervised hierarchical clustering and heat map of the CSC-array genes expression after MCF-7 and T47D cells (black boxes) were cultured with their regular media, their own NA-CM (blue boxes) or the CM from the HA-BrC cells (red boxes). (B) Supervised analysis using the Student's t-test of genes differentially expressed in NA-BrC cells after culturing with the NA- and HA- conditioned media. Genes shown in red were up-regulated and those in blue were down-regulated. (C) Unsupervised hierarchical clustering and heat map based on the genes found after the statistical analysis in B. Two independent biological replicates were analyzed.
Figure 2
Figure 2. ChiP-X enrichment analysis of ChEA database infers transcription factors regulating the induced invasive/stemness phenotype
Transcription factors (TF) inferred during this analysis are shown in red. These TFs are potential upstream regulators of the genes found with the CSC gene expression array (shown in green) and other molecules that we previously found experimentally, shown as additional molecules in blue [15]. This analysis was performed individually to MCF-7 cells (A), T47D cells (B) and for the genes observed with the jointed analysis of both cell lines (C).
Figure 3
Figure 3. Protein-protein interaction networks
Construction of the functional interaction (FI) networks for MCF-7 (A), T47D (B) and the jointed analysis of both cell lines (C), inferred using a list of input genes that included: the differentially expressed genes identified in the CSC array (green nodes), the potentially inferred transcriptional factors (red nodes) and the set of molecules found experimentally in reference [15] (blue nodes). Grey solid and dashed lines represent protein-protein interactions obtained from Reactome plug-in Cytoscape, and red lines represent the transcriptional regulations inferred from the TF enrichment analysis. Influence of each node was addressed through node betweenness and closeness centrality represented by the color intensity and size of the node, respectively. Nodes with greater influence are represented with larger radius and darker green.
Figure 4
Figure 4. Induced invasive/CSC-like cells do not alter their luminal phenotype but turn on expression of AR
Immunohistochemistry of ER, PR, HER2, and AR expression in (A) all BrC cell lines under basal conditions and (B) MCF-7 and T47D cells cultured with CM from HA-BrC cell lines. Positive cells are brown based on DAB chromogen. Nuclei were stained with hematoxylin (blue). The scale bars indicate 50 μm. Magnification 400×.
Figure 5
Figure 5. p65 is present in the nucleus of HA-BrC cells and its translocation to nucleus is induced in invasive/CSC-like NA-BrC cells
(A) Analysis of the constitutive cellular localization of p65 in NA- and HA-BrC cell lines by immunofluorescence (IF). (B) The concentration of IL-8 (in pgs/mL) was measured in the CM from the HA-BrC cell lines that were transiently transfected with a dominant negative IκB (HS578T S32 and MDA-MB-231 S32), and controls in which the cells were not transfected or transfected with an empty vector. p65 expression by IF in (C) MCF-7 and (D) T47D cells that were cultured with CM from HA-BrC cell lines HS578T S32 and MDA-MB-231 S32, and controls in which NFκB was not inhibited. The scale bars indicate 20 μm. Magnification 600× with inserts further amplifying the original image. Representative images are shown. Two independent biological replicates were analyzed and representative images were chosen.
Figure 6
Figure 6. The induced-invasive/stemness phenotype depends on p65 translocation
MCF-7 and T47D cells were cultured with the CM from HA-BrC cell lines in which the cells were transiently transfected with the dominant negative IκB (HS578T S32 and MDA-MB-231 S32), and controls in which NFκB was not inhibited. After 72 hours of culture (A) transwell invasion assays were performed and (B) SOX-2 expression was measured by FACS. Upper panels show representative images of invasion assays and cell density plots, while the frequency of invading cells and SOX-2 positive cells are graphed below. The data represent the mean ± SEM (Standard Error of the Mean) of 3 independent experiments, representative images are shown. *P < 0.05 and ***P < 0.001. The scale bars indicate 100 μm. Magnification 100×.
Figure 7
Figure 7. Pharmacological inhibition of NFκB activity blocks the induced-invasive/stemness phenotype
MCF-7 and T47D cells were cultured with CM from the HA-BrC cell lines in which the NFκB pathway was inhibited with ACHP or were treated with DMSO as vehicle control. After 72 hours of culture (A) transwell invasion assays were performed and (B) SOX-2 expression was measured by FACS. Upper panels show representative images of invasion assays and cell density plots, while the frequency of invading cells and SOX-2 positive cells are graphed below. The data represent the mean ± SEM of 3 independent experiments. *P < 0.05 and ***P < 0.001. The scale bars indicate 100 μm. Magnification 100×.
Figure 8
Figure 8. Primary breast cancer cultures also induced the invasive/stemness phenotype
(A) Milliplex assays were performed to determine the basal concentration of pro-inflammatory mediators and metalloproteinases (expressed in pgs/ml) in the CMs of NA-, HA-BrC cells and two primary BrC cultures. The following analyses were carried out in the primary BrC cultures: (B) expression of hormonal receptors were measured by immunocytochemistry (ICQ), (C) the epithelial to mesenchymal transition was assessed by Immunofluorescence (IF), (D) invasiveness in transwell assays, (E) expression of the stemness markers CD44 and CD24 was measured by flow cytometry, (F) expression of the stemness markers OCT-4 and SOX-2 was measured by IF, and (G) p65 cellular localization was measured by IF. (H) MCF-7 cells were cultured with the CM from both primary cell lines and CD44 was examined by flow cytometry. The data represent the mean ± SEM of 3 independent experiments, representative images are shown. The scale bars indicate 20 μm in IF images and 50 μm in ICQ images. IF images magnification of 600× and ICQ images of 400×.
Figure 9
Figure 9. Expression of cancer-inflammation crosstalk genes is induced by primary breast cancer cells
MCF-7 cells were cultured with the CM of the primary BrC cells and expression of genes associated with Cancer Inflammation and Immunity Crosstalk was analyzed by a PCR array. (A) Venn diagram indicating the overlap of expression of genes that were up- (red) or down-regulated (blue) in MCF-7 cells treated with the CM of UIVC-IDC4 (yellow) or UIVC-IDC9 (dark green) cells. (B) Unsupervised hierarchical clustering analysis and heat map according to expression patterns, and biological processes associated with the genes that were up- or down-regulated. Red and green in the heatmap diagram represent higher and lower expression, compared with the median for each particular gene. One PCR array was performed.

Similar articles

Cited by

References

    1. Bray F, Ren JS, Masuyer E, Ferlay J. Global estimates of cancer prevalence for 27 sites in the adult population in 2008. Int J Cancer. 2013;132:1133–45. https://doi.org/10.1002/ijc.27711. - DOI - PubMed
    1. Ferlay J, Soerjomataram I, Dikshit R, Eser S, Mathers C, Rebelo M, Parkin DM, Forman D, Bray F. Cancer incidence and mortality worldwide: sources, methods and major patterns in GLOBOCAN 2012. Int J Cancer. 2015;136:E359–86. https://doi.org/10.1002/ijc.29210. - DOI - PubMed
    1. Vargo-Gogola T, Rosen JM. Modelling breast cancer: one size does not fit all. Nat Rev Cancer. 2007;7:659–72. https://doi.org/10.1038/nrc2193. - DOI - PubMed
    1. van 't Veer LJ, Dai H, van de Vijver MJ, He YD, Hart AA, Mao M, Peterse HL, van der Kooy K, Marton MJ, Witteveen AT. Gene expression profiling predicts clinical outcome of breast cancer. Nature. 2002:415. https://doi.org/10.1038/415530a. - DOI - PubMed
    1. Kwa M, Makris A, Esteva FJ. Clinical utility of gene-expression signatures in early stage breast cancer. Nat Rev Clin Oncol. 2017;14:595. https://doi.org/10.1038/nrclinonc.2017.74. - DOI - PubMed

LinkOut - more resources