. 2018 Jun 13:4:6.
doi: 10.1038/s41514-018-0025-3. eCollection 2018.

A parthenogenetic quasi-program causes teratoma-like tumors during aging in wild-type C. elegans

Affiliations

A parthenogenetic quasi-program causes teratoma-like tumors during aging in wild-type C. elegans

Hongyuan Wang et al. NPJ Aging Mech Dis. .

Abstract

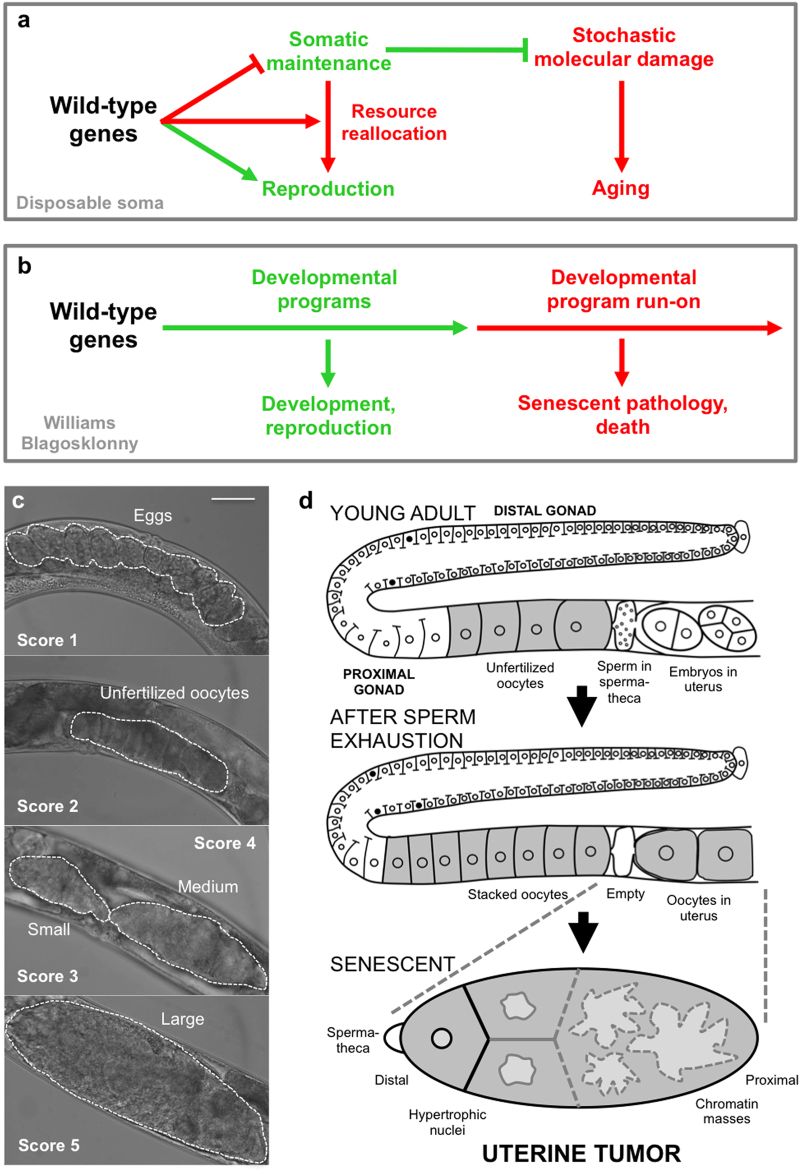
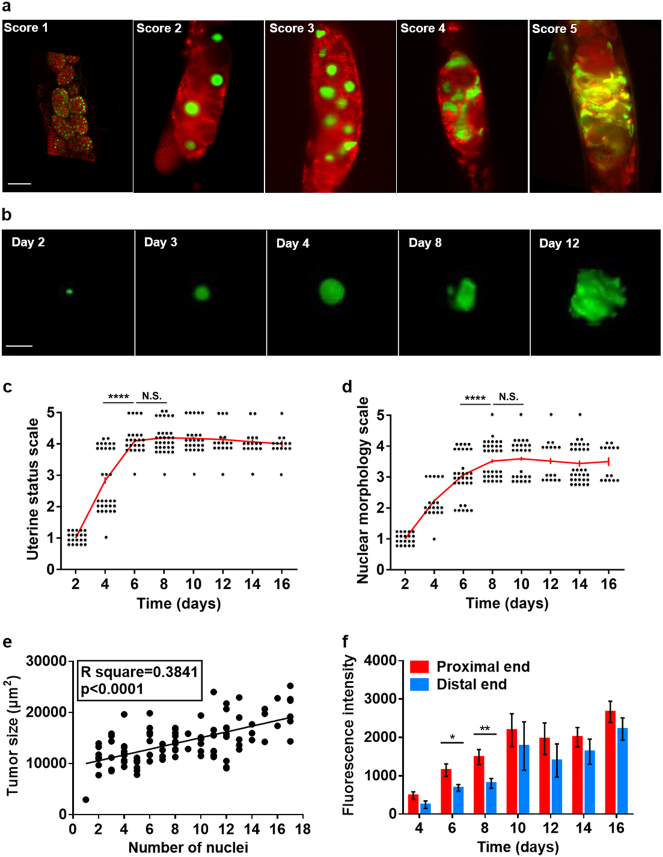
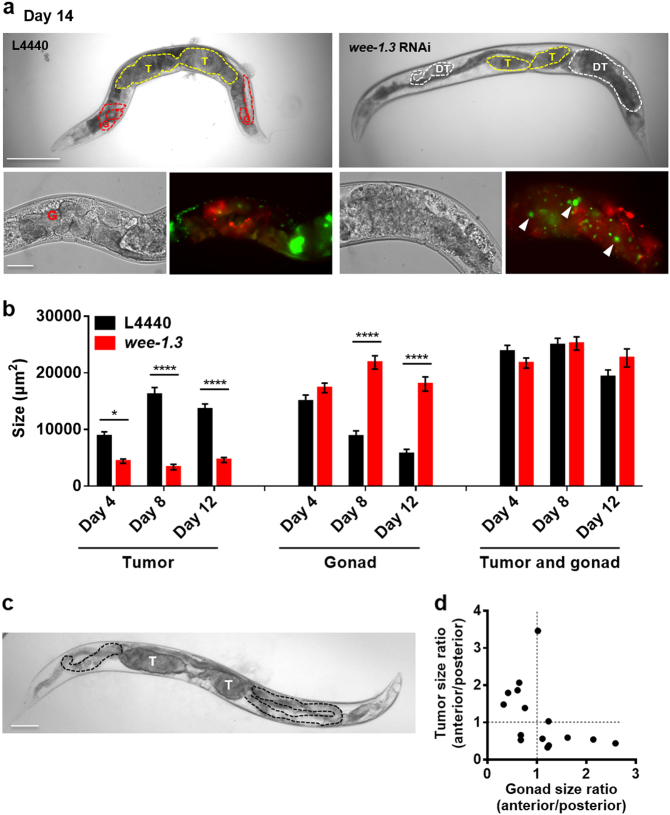
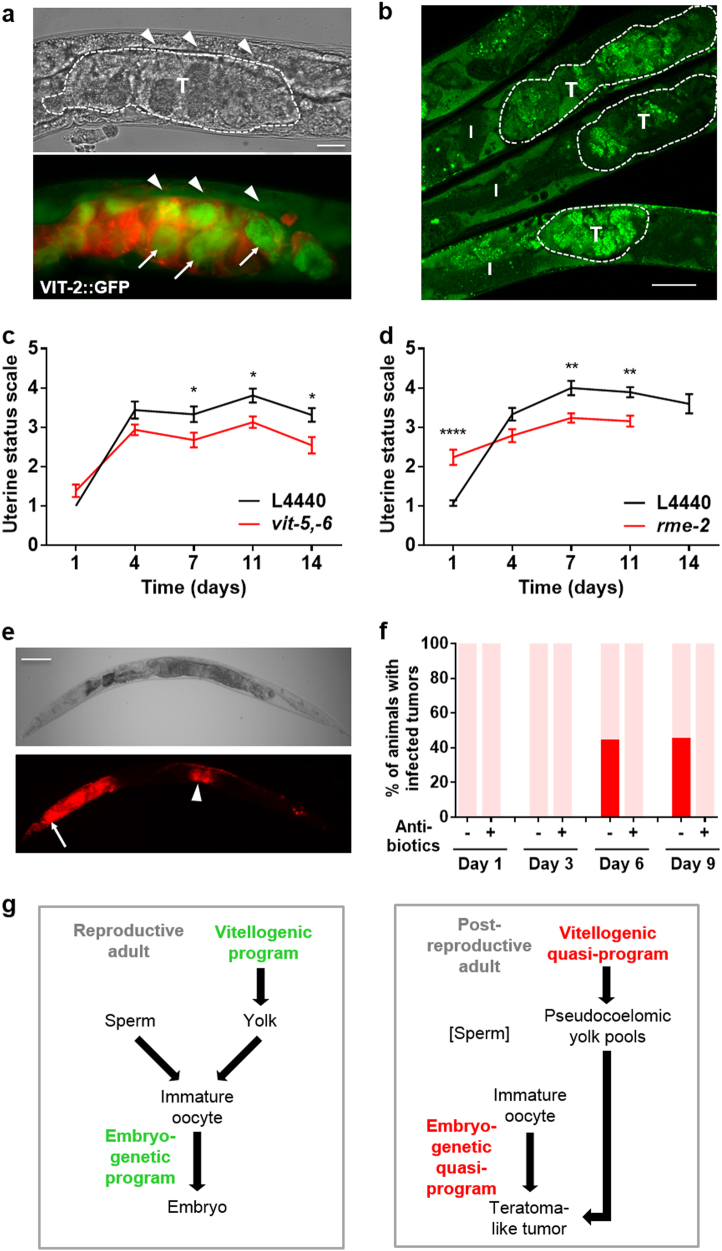
A long-standing belief is that aging (senescence) is the result of stochastic damage accumulation. Alternatively, senescent pathology may also result from late-life, wild-type gene action (i.e., antagonistic pleiotropy, as argued by Williams) leading to non-adaptive run-on of developmental programs (or quasi-programs) (as suggested more recently by Blagosklonny). In this study, we use existing and new data to show how uterine tumors, a prominent form of senescent pathology in the nematode Caenorhabditis elegans, likely result from quasi-programs. Such tumors develop from unfertilized oocytes which enter the uterus and become hypertrophic and replete with endoreduplicated chromatin masses. Tumor formation begins with ovulation of unfertilized oocytes immediately after exhaustion of sperm stocks. We show that the timing of this transition between program and quasi-program (i.e., the onset of senescence), and the onset of tumor formation, depends upon the timing of sperm depletion. We identify homology between uterine tumors and mammalian ovarian teratomas, which both develop from oocytes that fail to mature after meiosis I. In teratomas, futile activation of developmental programs leads to the formation of differentiated structures within the tumor. We report that older uterine tumors express markers of later embryogenesis, consistent with teratoma-like activation of developmental programs. We also present evidence of coupling of distal gonad atrophy to oocyte hypertrophy. This study shows how the Williams Blagosklonny model can provide a mechanistic explanation of this component of C. elegans aging. It also suggests etiological similarity between teratoma and some forms of senescent pathology, insofar as both are caused by quasi-programs.


Conflict of interest statement

The authors declare no competing interests.

Figures

Fig. 1
Fig. 1
Theories of aging and uterine tumor development. a, b Alternative models for how wild-type genes cause senescence (pathogenic action of alleles exhibiting antagonistic pleiotropy). a Disposable soma model. Wild-type genes promote reproduction at the expense of somatic maintenance processes that prevent the damage that causes aging. b Williams Blagosklonny model. Continued action of wild-type genes in later life leads to run-on of developmental programs (quasi-programs) causing development of senescent pathology. c, d Senescent uterine tumors in C. elegans hermaphrodites. c Stages of development of uterine tumors. Dotted lines delineate uterine contents. Scale bar, 50 μm. d Schematic representation of uterine tumor development, consistent with Williams Blagosklonny model. As argued in this study, the point of origin of pathophysiology is immediately after fertilization with the last sperm in the spermatheca; this is the point of transition from program to quasi-program. Red, promoting senescent pathology
Fig. 2
Fig. 2
Further characterization of senescent uterine tumors. a Nuclear hypertrophy during tumor development (representative images of different animals). Scale bar, 25 μm. b Development of nuclear hypertrophy. Scale bar, 15 μm. c Uterine tumor development during aging. Uterine status scale: class 1, normal uterus containing eggs (day 1 adult). Class 2, slightly abnormal uterine contents, but no tumor visible. Class 3, small tumor. Class 4, medium sized tumor. Class 5, large tumor, filling body cavity and squashing the intestine. d Changes in nuclear morphology during tumor aging. Nuclear morphology scale (predominant morphology in tumor): class 1, normal sized, spherical nuclei. Class 2: moderately enlarged, spherical nuclei. Class 3: very large nuclei becoming non-spherical. Class 4: very large nuclei with frequent branching. Class 5: nuclei merged into large masses of chromatin. c, d day 0 is L4 stage; each point represents one tumor, and the same individuals were scored for each parameter; Wilcoxon–Mann Whitney test, ****p < 0.0001. e Linear regression analysis of number of oocyte nuclei and tumor size. f Nuclear hypertrophy is initially more marked in the proximal half of the tumor. Measured as HIS-58::GFP fluorescence intensity (mean ± s.e.m.); unpaired t-test, *p < 0.05; **p < 0.01. Sample sizes on each day: n = 9–24
Fig. 3
Fig. 3
C. elegans uterine tumors are teratoma-like. a C. elegans uterine tumors and human ovarian teratomas are etiologically similar in that both originate from action in unfertilized immature oocytes of quasi-programs initiated after failure of meiosis II. b, c Expression of embryonic reporters in later stage uterine tumors. b Selected images of early and late stage tumors (epifluorescence microscopy). Note no fluorescence in early embryos (arrows). Expression was detected in older tumors (arrowheads). Scale bar, 50 μm. c Frequency of tumors expressing fluorescent markers at different levels (1–3 scale). Scale bar 50 μm. Score of reporter fluorescence within tumor: score 1, no fluorescence; score 2, weak fluorescence; score 3, strong fluorescence. GFP fluorescence in uterine tumors (arrowheads: fluorescence). Scorer was not blind to the treatment group. All trials, n ≥ 19. Teratoma image courtesy of E. Uthman http://web2.airmail.net/uthman/specimens/images/teratoma.html
Fig. 4
Fig. 4
Knockdown of genes required for early embryogenesis reduces tumor growth. a, b Effects of whole worm RNAi initiated at different ages on nuclear hypertrophy and tumor size (mean ± s.e.m.), measured on day 8 of adulthood. Dunnett multiple comparison test, Wilcoxon–Mann Whitney test, *p < 0.05; **p < 0.01; ***p < 0.001; ****p < 0.0001. All trials, n ≥ 17. a RNAi initiated from day 3. b RNAi initiated from L4 and day 1. c Effects of cye-1 and cdk-1 RNAi on fertility schedule (progeny and unfertilized oocytes). All trials, n ≥ 9. Data are mean ± s.e.m
Fig. 5
Fig. 5
Evidence for coupling of uterine tumor growth and distal gonad atrophy. a Distal gonad tumors resulting from wee-1.3 RNAi (CDK inhibitory kinase). Yellow dotted line delineates uterine tumors, white dotted lines distal gonad hypertrophic tumors, and red dotted lines gonad. Bottom right: The size and number of HIS-58::GFP-labeled nuclei indicate that these tumors, like uterine tumors, result from cellular hypertrophy rather than hyperplasia. Arrowhead, hypertrophic nucleus. T uterine tumor, DT distal gonad hypertrophic tumor. Scale bar, 50 μm. b Quantitation of effects of wee-1.3 RNAi on uterine and distal hypertrophic tumor size; note lack of change in combined size. Sidak multiple comparison test, *p < 0.05; ****p < 0.0001. Sample sizes: L4440, day 4, n = 12, day 8, n = 13, day 12, n = 20; wee-1.3 RNAi, day 4, n = 26, day 8, n = 14, day 12, n = 22. Data are mean ± s.e.m. c, d Asymmetry in gonad disintegration in animals with asymmetrical uterine tumor pairs. c Day 19 adult with asymmetric tumors (T), and asymmetric gonadal atrophy (delineated with black dotted line). Scale bar, 100 μm. T tumor. d Ratio of anterior tumor/posterior tumor size and gonad size within the same worm with asymmetric tumors (10 μM FUDR) on day 9 and day 10. n = 15
Fig. 6
Fig. 6
Additional uterine tumor etiologies: yolk uptake and bacterial infection. a VIT-2::GFP accumulation in uterine tumors (day 10 adult), with cell membranes marked with mCherry::PH. VIT-2::GFP accumulation in oocytes within tumors (arrows) and in yolky pools (arrowheads). T, uterine tumor. Scale bar, 25 μm. b Neutral lipid staining shows lipid accumulation within uterine tumors, delineated by dotted lines (day 8 adult, 15 μM FUDR). I intestine, T uterine tumor. Scale bar, 25 μm. c vit-5,-6 RNAi reduces tumor size (mean ± s.e.m.). Summed data from 3 trials; Sidak multiple comparison test, *p < 0.05. Sample sizes on each day: n = 19–32. d rme-2 RNAi reduces tumor size (mean ± s.e.m.). Summed data from 2 trials. **p < 0.01, ****p < 0.0001. Sample sizes on each day: n = 14–21 (rme-2 RNAi, day 14, n = 5). c, d RNAi initiated at hatching. e, f Uterine tumors can develop bacterial infections. e E. coli expressing dsRed within uterine tumors (day 10 adult, necropsy). Arrow, infected pharynx. Arrowhead, infected tumor. Scale bar, 100 μm. f Bar graph showing frequency of worms with infected tumors, without or with carbenicillin (Fisher Scientific, 4800-94-6). Pink, uninfected; red, infected. g Scheme summarizing how programs that act to promote reproduction in young adults (left) become quasi-programs to promote pathology in older adults, after sperm depletion (right). Arrows indicate a contributory effect

References

    1. Kenyon C. The genetics of ageing. Nature. 2010;464:504–512. doi: 10.1038/nature08980. - DOI - PubMed
    1. Gems D, Partridge L. Genetics of longevity in model organisms: debates and paradigm shifts. Ann. Rev. Physiol. 2013;75:621–644. doi: 10.1146/annurev-physiol-030212-183712. - DOI - PubMed
    1. Williams GC. Pleiotropy, natural selection and the evolution of senescence. Evolution. 1957;11:398–411. doi: 10.1111/j.1558-5646.1957.tb02911.x. - DOI
    1. Abrams P. Does increased mortality favor the evolution of more rapid senescence? Evolution. 1993;47:877–887. doi: 10.1111/j.1558-5646.1993.tb01241.x. - DOI - PubMed
    1. Kirkwood TBL. Evolution of ageing. Nature. 1977;270:301–304. doi: 10.1038/270301a0. - DOI - PubMed

LinkOut - more resources