. 2018 Jun 19:4:33.
doi: 10.1038/s41421-018-0032-3. eCollection 2018.

SRSF3 maintains transcriptome integrity in oocytes by regulation of alternative splicing and transposable elements

Affiliations

SRSF3 maintains transcriptome integrity in oocytes by regulation of alternative splicing and transposable elements

Dang Vinh Do et al. Cell Discov. .

Abstract

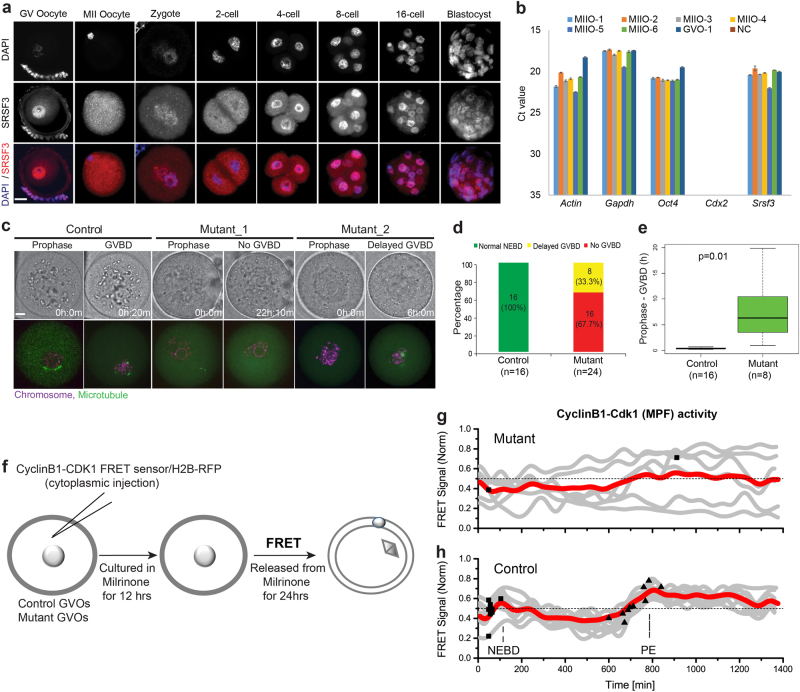
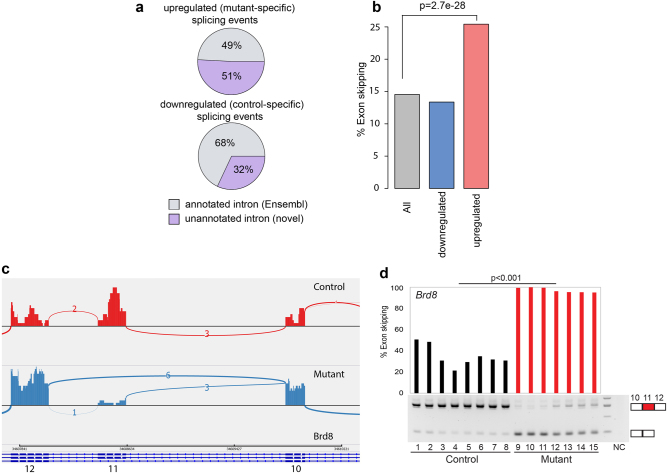
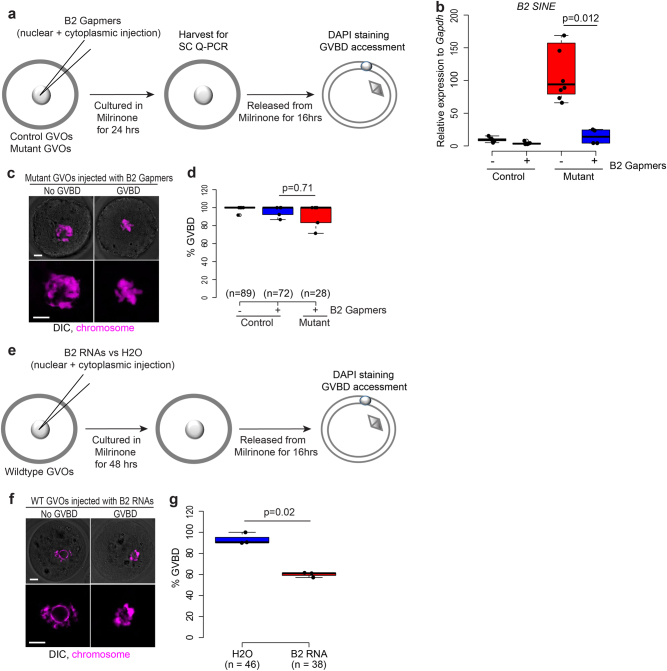
The RNA-binding protein SRSF3 (also known as SRp20) has critical roles in the regulation of pre-mRNA splicing. Zygotic knockout of Srsf3 results in embryo arrest at the blastocyst stage. However, SRSF3 is also present in oocytes, suggesting that it might be critical as a maternally inherited factor. Here we identify SRSF3 as an essential regulator of alternative splicing and of transposable elements to maintain transcriptome integrity in mouse oocyte. Using 3D time-lapse confocal live imaging, we show that conditional deletion of Srsf3 in fully grown germinal vesicle oocytes substantially compromises the capacity of germinal vesicle breakdown (GVBD), and consequently entry into meiosis. By combining single cell RNA-seq, and oocyte micromanipulation with steric blocking antisense oligonucleotides and RNAse-H inducing gapmers, we found that the GVBD defect in mutant oocytes is due to both aberrant alternative splicing and derepression of B2 SINE transposable elements. Together, our study highlights how control of transcriptional identity of the maternal transcriptome by the RNA-binding protein SRSF3 is essential to the development of fertilized-competent oocytes.


Conflict of interest statement

The authors declare that they have no conflict of interest.

Figures

Fig. 1
Fig. 1. Srsf3 knockout oocytes show a major defect in meiotic resumption.
a Immunostaining shows SRSF3 protein expression in GV oocytes, MII oocytes and preimplantation embryos. Scale bar: 100 µm. b Single cell quantitative real-time PCR shows Srsf3 mRNA expression in MII oocytes and GV oocytes. NC negative control, M2O MII oocyte, GVO GV oocyte. c Time-lapse confocal live imaging of control and mutant oocytes microinjected with H2B-RFP and EB3-mEGFP RNAs. Chromosome in magenta, microtubule in green. Scale bar: 20 µm, h hour, m minute, GVBD: nuclear envelope breakdown. d A graph shows the percentage of control and mutant oocytes undergoing normal GVBD, delayed GVBD, or no GVBD. Numbers of oocytes examined are shown under the graph. e A box plot shows timing from prophase I to GVBD in control and mutant oocytes. Numbers of oocytes examined are shown under the graph. p-value was calculated by two-tailed Student’s t-test. f Schematic illustration of Förster resonance energy transfer (FRET) experiment using a CDK1 FRET sensor to visualize CDK1 activation in control and mutant oocytes during meiosis. Milrinone was used to prevent oocytes from entering meiosis. g Gray lines are FRET curves of mutant oocytes. Red line is the mean of FRET curves of six mutant oocytes. Black squares represent the time point of GVBD. Only two mutant oocytes underwent GVBD during the course of live imaging. h Gray lines are FRET curves of control oocytes. Red line is the mean of FRET curves of ten control oocytes. Black squares represent time point of GVBD and black triangles represent the time point of the completion of polar body extrusion (PE), which is the first frame showing complete abscission of the polar body
Fig. 2
Fig. 2. Aberrant transcriptome in Srsf3 mutant oocytes.
a A heatmap shows the Spearman correlation of gene expression between control and mutant oocytes in our single cell RNA-Seq data and oocytes and early mouse preimplantation embryos in previously published single cell RNA-seq data. b PCA plot using the 5000 genes with the highest variance across all samples, axes are labeled to include the percentage of variance explained. c A heatmap showing the transcript level of key genes that promote or inhibit meiosis in control and mutant oocytes. The color indicates the expression level
Fig. 3
Fig. 3. Aberrant alternative splicing in Srsf3-mutant oocytes.
a Pie charts show percentages of annotated and unannotated splicing events in upregulated (mutant-specific) and downregulated (control-specific) splicing events. b A bar graph shows percentages of exon skipping in unannotated splicing events. All splicing events in gray, downregulated (control-specific) splicing events in blue, upregulated (mutant-specific) splicing events in red. c A representative sashimi plot shows an exon skipping event in Brd8 transcript in control and mutant oocyte. The numbers of junction reads between two connecting exon are shown in the sashimi plot. d Validation of the exon skipping on Brd8 transcript in control and mutant oocyte by semiquantitative PCR. Percentages of exon skipping calculated for eight control and seven mutant oocytes are shown on the top. Mann–Whitney test (Wilcoxon rank sum test) was used to calculate p-value
Fig. 4
Fig. 4. Antisense oligonucleotides generating Brd8- and Pdlim7-alternative splicing recapitulate the GVBD defect in Srsf3-mutant oocytes.
a Schematic representation of ASOs designed to induce exon skipping of Brd8 and Pdlim7 in wild-type oocytes. b Schematic illustration of an experiment to validate efficacies of ASOs in inducing exon skipping of Brd8 and Pdlim7 in wild-type oocytes. c, d Validation of efficacies of Brd8 (c) and Pdlim7 (d) ASOs by semiquantitative PCR. Percentage of exon skipping in individual control and mutant oocytes is shown on the top. C: control oocyte, M: mutant oocyte. Mann–Whitney test (Wilcoxon rank sum test) was used to calculate p-value. e Schematic illustration of an experiment to validate function of ASOs inducing exon skipping for Brd8 and Pdlim7 and GVBD defect in wild-type oocytes. f Representative confocal images of wild-type GV oocytes injected with Brd8 or Pdlim7 ASOs show no GVBD while oocyte injected with scramble ASO shows normal GVBD. Chromosome in magenta. Microtubule in green. Scale bar, 20 µm. g A graph shows percentages of wild-type oocytes undergoing GVBD after injected with Brd8 and Pdlim7 ASOs. p-value was calculated by Student's t-test. The data were calculated from two independent experiments. h Proposed schematic of the role of SRSF3 in regulating alternative splicing in mouse oocytes. Black and red boxes represent exons, red box is alternative spliced exon
Fig. 5
Fig. 5. Upregulated expression of B2 SINE classes in Srsf3 mutant oocytes.
a Percentage of mapped reads that overlap with repetitive elements for all single control (left) and mutant (right) oocytes. b Percentage of reads mapped to different repeat classes (100% = all reads that map to repeats) in control (left) and mutant (right) oocytes. c Upregulated retrotransposons in mutant oocytes are significantly enriched in B2_Mm1a, B2_Mm1t, and B2_Mm2 SINE classes. d A heatmap shows expression of individual repeat elements from three upregulated B2 SINE classes in control and mutant oocytes. The color indicates the expression level. Numbers of repeat elements are indicated on the right (5520 B2_Mm2 elements, 6458 B2_Mm1a elements, and 5745 B2_Mm1t elements). e Expression and sequence similarity of three B2 SINE classes that are upregulated in mutant oocytes. The plot on top panel (plot: average read count) shows the average expression for all elements from these classes. Sequence similarity shows the conservation along the SINE B2 sequences (plot: sequence similarity). The two bottom panels shows the average of mapped reads of all control and mutant samples for each element (plot: expression mutant/expression control, red indicates high number of mapped reads, white indicates low number of mapped reads). f Fraction of mutant-specific B2_Mm1a, B2_Mm1t, and B2_Mm2 elements that overlap with exons, introns, or intergenic regions of genes. Significance was estimated using Fisher’s test. g Fraction of mutant-specific B2_Mm2 elements that overlap with the first exon or last exon of genes. h Fraction of mutant-specific B2_Mm2 elements that overlap with genes on the same strand and opposite strand. i Normalized RNA-Seq data for a locus that show increased expression of intronic B2_Mm1a element in mutant oocytes. J An example of loci with increased expression of two B2_Mm2 elements that overlap with the last exon of two genes on the same strand
Fig. 6
Fig. 6. Functional validation of SINE B2 in mouse oocyte meiosis.
a Schematic illustration. Control and mutant fully grown GV oocytes were injected with a pool of four gapmers targeting the consensus sequence of all B2 SINE elements and cultured in M16 supplemented with Milrinone to prevent GVBD. Oocytes were collected at 24-h postinjection for single cell Q-PCR to measure knockdown efficiency. In different experiments, after 24-h culture in M16 supplemented with Milrinone, injected oocytes were released from Milrinone for 16-h to access GVBD efficiency by DAPI staining. b A box plot shows transcript level of B2 SINE in control and mutant oocytes injected with a pooled gapmers targeting B2 SINE sequence. Each black dot represents an individual oocyte. p-value is calculated by two-tailed Student’s t-test. c Representative confocal microscopy of mutant GV oocytes injected with B2 SINE gapmers with or without GVBD. Chromosome in magenta. Scale bar, 20 µm. d A box plot shows the percentage of control and mutant oocytes undergoing GVBD after injected with a pooled gapmers targeting B2 SINE sequence. Each black dot represents an individual experiment replicate. p-value was calculated by two-tailed Student’s t-test. e Schematic illustration. Control and mutant oocytes were injected with B2 SINE RNAs. Oocytes were culture in M16 medium supplemented with Milrinone for 48-h and released from Milrinone for 16-h to access GVBD efficiency by DAPI staining. f Representative confocal microscopy of wild-type GV oocytes injected with B2 SINE RNAs with or without GVBD. Chromosome in magenta. Scale bar, 20 µm. g A box plot shows the percentage of wild-type GV oocytes undergoing GVBD after injected with either H2O or B2 SINE RNAs

Similar articles

Cited by

References

    1. Su YQ, et al. MARF1 regulates essential oogenic processes in mice. Science. 2012;335:1496–1499. doi: 10.1126/science.1214680. - DOI - PMC - PubMed
    1. Li R, Albertini DF. The road to maturation: somatic cell interaction and self-organization of the mammalian oocyte. Nat. Rev. Mol. Cell Biol. 2013;14:141–152. doi: 10.1038/nrm3531. - DOI - PubMed
    1. Clift D, Schuh M. Restarting life: fertilization and the transition from meiosis to mitosis. Nat. Rev. Mol. Cell Biol. 2013;14:549–562. doi: 10.1038/nrm3643. - DOI - PMC - PubMed
    1. Bouniol-Baly C, et al. Differential transcriptional activity associated with chromatin configuration in fully grown mouse germinal vesicle oocytes. Biol. Reprod. 1999;60:580–587. doi: 10.1095/biolreprod60.3.580. - DOI - PubMed
    1. Licatalosi DD, Darnell RB. RNA processing and its regulation: global insights into biological networks. Nat. Rev. Genet. 2010;11:75–87. doi: 10.1038/nrg2673. - DOI - PMC - PubMed