

Bioinformatic screening for key miRNAs and genes associated with myocardial infarction
- PMID: 29928570
- PMCID: PMC5985982
- DOI: 10.1002/2211-5463.12423
Bioinformatic screening for key miRNAs and genes associated with myocardial infarction
Abstract
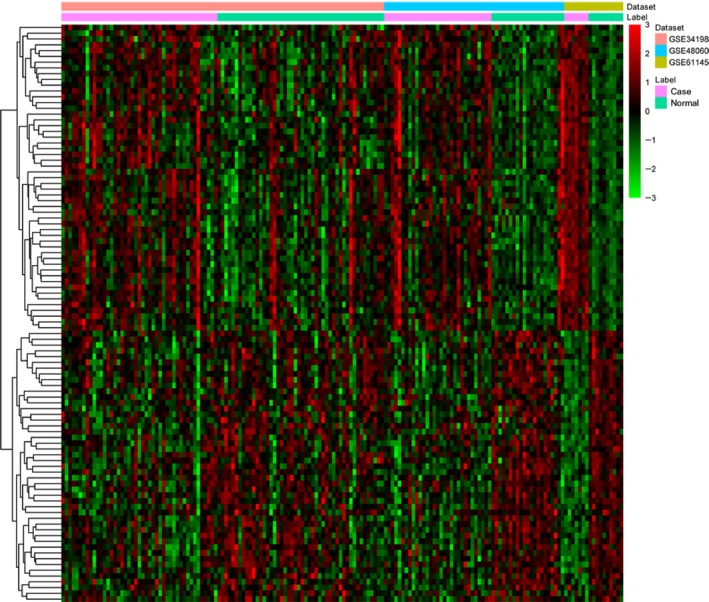
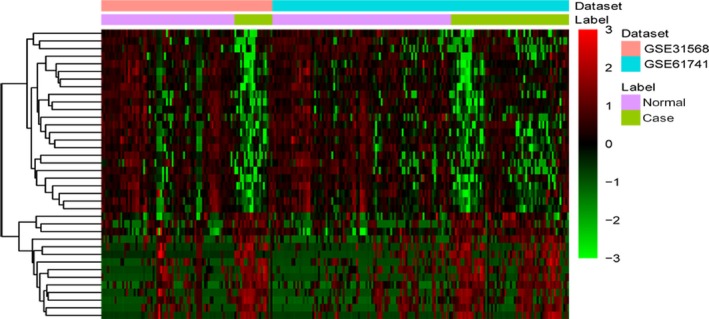
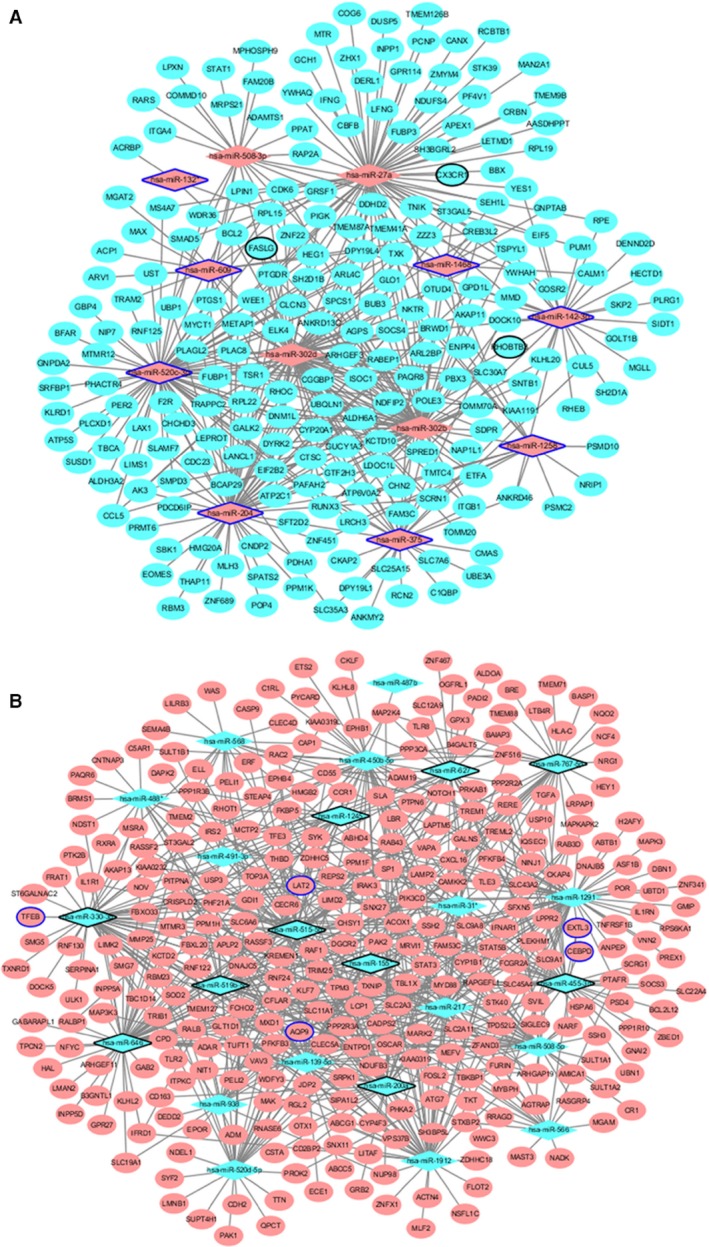
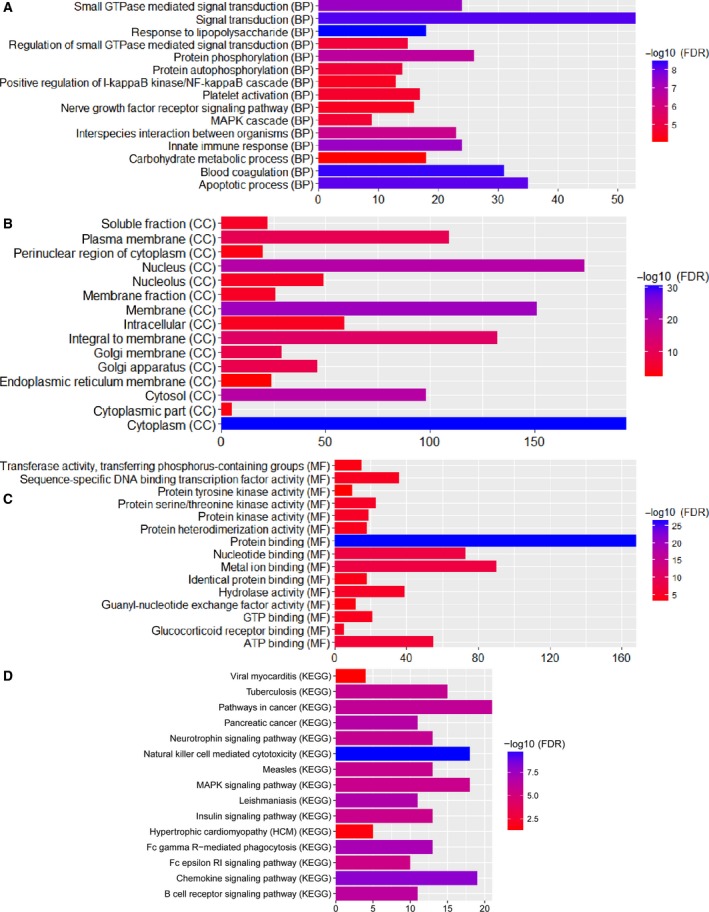
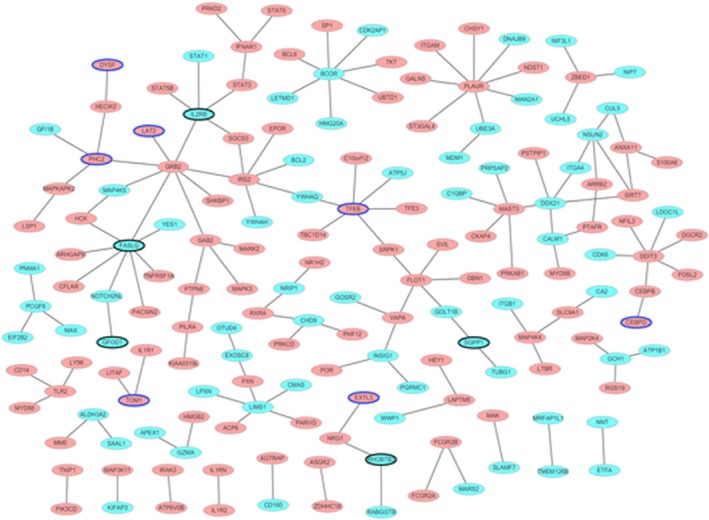
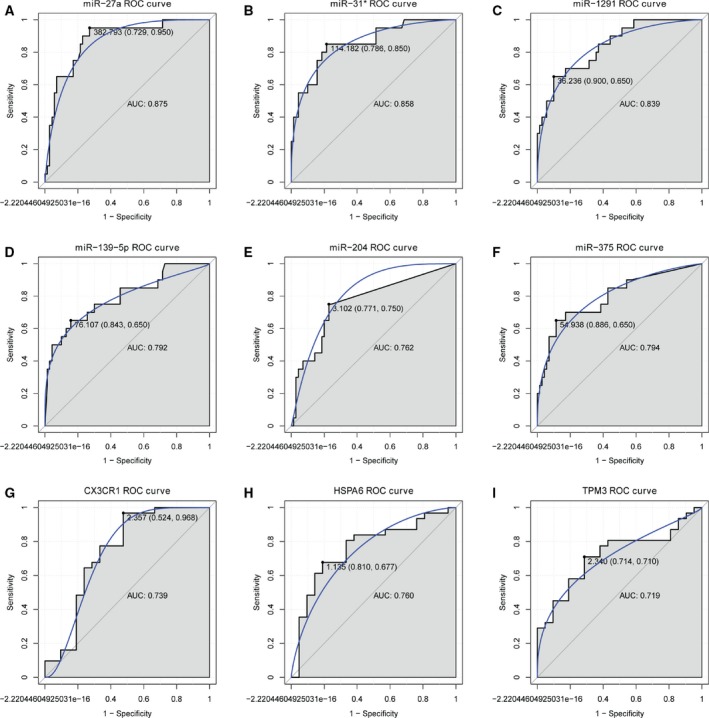
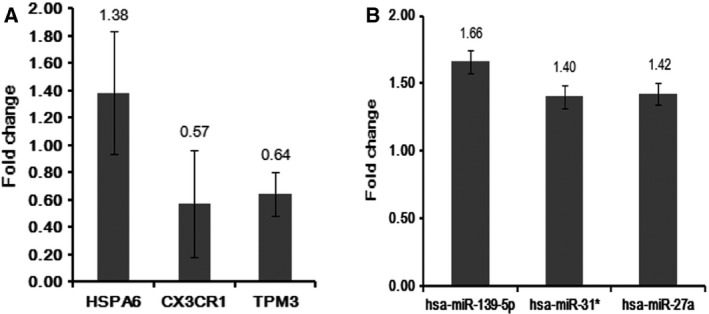
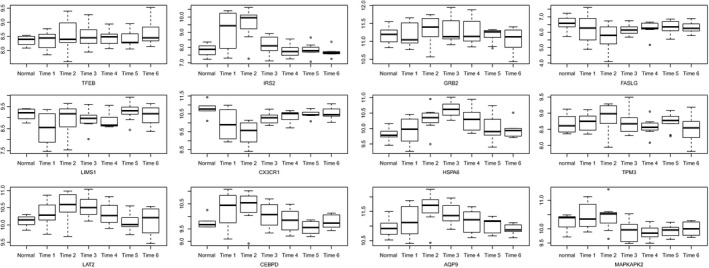
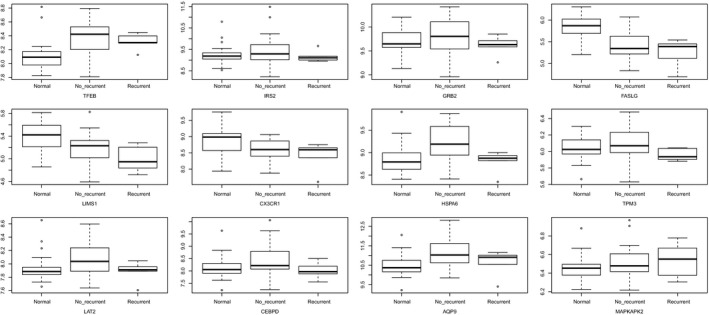
Despite significant advances in understanding of the causes of and treatment of myocardial infarction (MI) in recent years, morbidity and mortality is still high. The aim of this study was to identify miRNA and genes potentially associated with MI. mRNA and miRNA expression datasets were downloaded from the Gene Expression Omnibus database (http://www.ncbi.nlm.nih.gov/geo/). Interactions between miRNA and the expression and function of target genes were analyzed, and a protein-protein interaction network was constructed. The diagnostic value of identified miRNA and genes was assessed. Quantitative RT-PCR was applied to validate the results of the bioinformatics analysis. MiR-27a, miR-31*, miR-1291, miR-139-5p, miR-204, miR-375, and target genes including CX3CR1,HSPA6, and TPM3 had potential diagnostic value. The genes TFEB,IRS2,GRB2,FASLG,LIMS1,CX3CR1,HSPA6,TPM3,LAT2,CEBPD,AQP9, and MAPKAPK2 were associated with recovery from MI. In conclusion, the identified miRNA and genes might be associated with the pathology of MI.
Keywords: diagnostic biomarkers; miRNA‐target network; myocardial infarction; protein–protein interaction network.
Figures
Similar articles
-
Differential expression profiles of microRNAs as potential biomarkers for the early diagnosis of lung cancer.Oncol Rep. 2017 Jun;37(6):3543-3553. doi: 10.3892/or.2017.5612. Epub 2017 Apr 28. Oncol Rep. 2017. PMID: 28498428
-
Diagnostic value of strand-specific miRNA-101-3p and miRNA-101-5p for hepatocellular carcinoma and a bioinformatic analysis of their possible mechanism of action.FEBS Open Bio. 2017 Dec 20;8(1):64-84. doi: 10.1002/2211-5463.12349. eCollection 2018 Jan. FEBS Open Bio. 2017. PMID: 29321958 Free PMC article.
-
Identification of apoptosis-related microRNAs and their target genes in myocardial infarction post-transplantation with skeletal myoblasts.J Transl Med. 2015 Aug 19;13:270. doi: 10.1186/s12967-015-0603-0. J Transl Med. 2015. PMID: 26286600 Free PMC article.
-
Bioinformatic Analysis of Potential microRNAs in Ischemic Stroke.J Stroke Cerebrovasc Dis. 2016 Jul;25(7):1753-1759. doi: 10.1016/j.jstrokecerebrovasdis.2016.03.023. Epub 2016 Apr 14. J Stroke Cerebrovasc Dis. 2016. PMID: 27151415
-
Integrated analysis of microRNA and gene expression profiles reveals a functional regulatory module associated with liver fibrosis.Gene. 2017 Dec 15;636:87-95. doi: 10.1016/j.gene.2017.09.027. Epub 2017 Sep 14. Gene. 2017. PMID: 28919164
Cited by
-
Identification of Biomarkers Related to Immune Cell Infiltration with Gene Coexpression Network in Myocardial Infarction.Dis Markers. 2021 Nov 5;2021:2227067. doi: 10.1155/2021/2227067. eCollection 2021. Dis Markers. 2021. PMID: 34777632 Free PMC article.
-
Overexpression of miR-375 Protects Cardiomyocyte Injury following Hypoxic-Reoxygenation Injury.Oxid Med Cell Longev. 2020 Jan 3;2020:7164069. doi: 10.1155/2020/7164069. eCollection 2020. Oxid Med Cell Longev. 2020. PMID: 31976033 Free PMC article.
-
Screening for Regulatory Network of miRNA-Inflammation, Oxidative Stress and Prognosis-Related mRNA in Acute Myocardial Infarction: An in silico and Validation Study.Int J Gen Med. 2022 Feb 18;15:1715-1731. doi: 10.2147/IJGM.S354359. eCollection 2022. Int J Gen Med. 2022. PMID: 35210840 Free PMC article.
-
Crosstalk between Circulatory Microenvironment and Vascular Endothelial Cells in Acute Myocardial Infarction.J Inflamm Res. 2021 Oct 29;14:5597-5610. doi: 10.2147/JIR.S316414. eCollection 2021. J Inflamm Res. 2021. PMID: 34744446 Free PMC article.
-
Promoting roles of KLF5 in myocardial infarction in mice involving microRNA-27a suppression and the following GFPT2/TGF-β/Smad2/3 axis activation.Cell Cycle. 2021 May;20(9):874-893. doi: 10.1080/15384101.2021.1907512. Epub 2021 Apr 29. Cell Cycle. 2021. PMID: 33910455 Free PMC article.
References
-
- Rodriguez M, Cai WJ, Kostin S, Lucchesi BR and Schaper J (2005) Ischemia depletes dystrophin and inhibits protein synthesis in the canine heart: mechanisms of myocardial ischemic injury. J Mol Cell Cardiol 38, 723–733. - PubMed
LinkOut - more resources
Full Text Sources
Other Literature Sources
Research Materials
Miscellaneous
