. 2018 May 14;8(6):986-1000.
doi: 10.1002/2211-5463.12435. eCollection 2018 Jun.

Suppressed de novo lipogenesis by plasma membrane citrate transporter inhibitor promotes apoptosis in HepG2 cells

Affiliations

Suppressed de novo lipogenesis by plasma membrane citrate transporter inhibitor promotes apoptosis in HepG2 cells

Phornpun Phokrai et al. FEBS Open Bio. .

Abstract

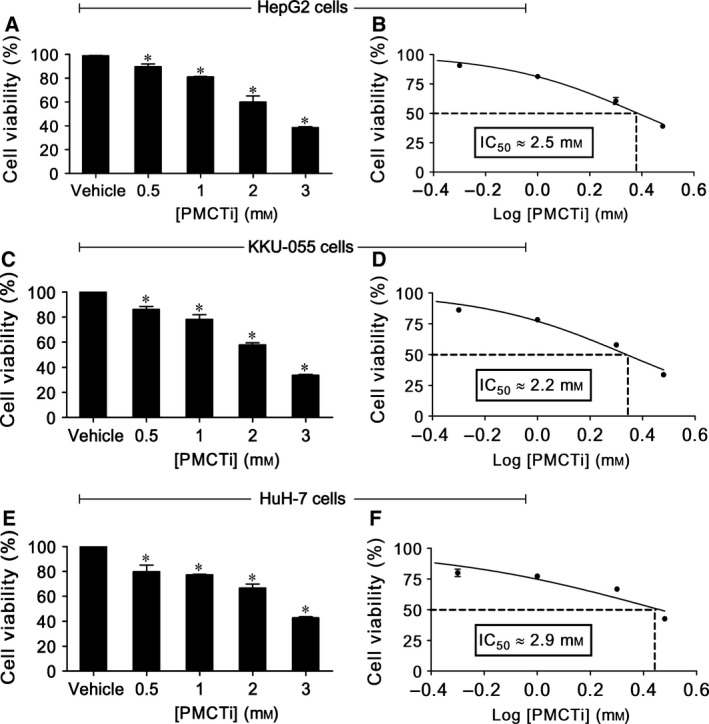
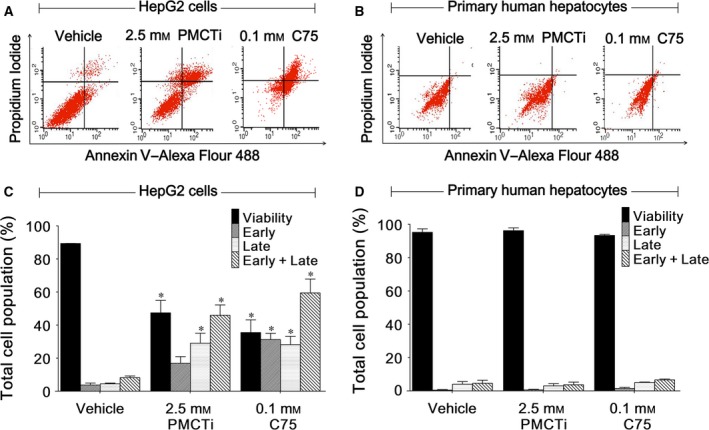
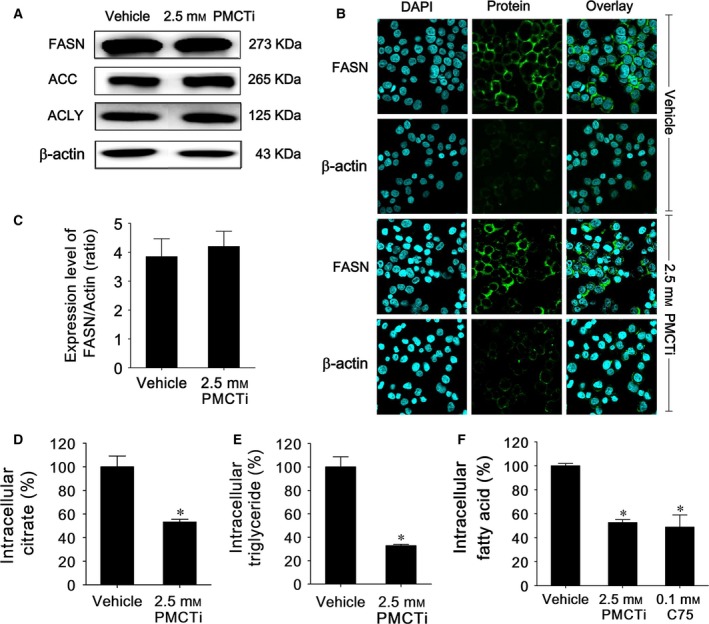
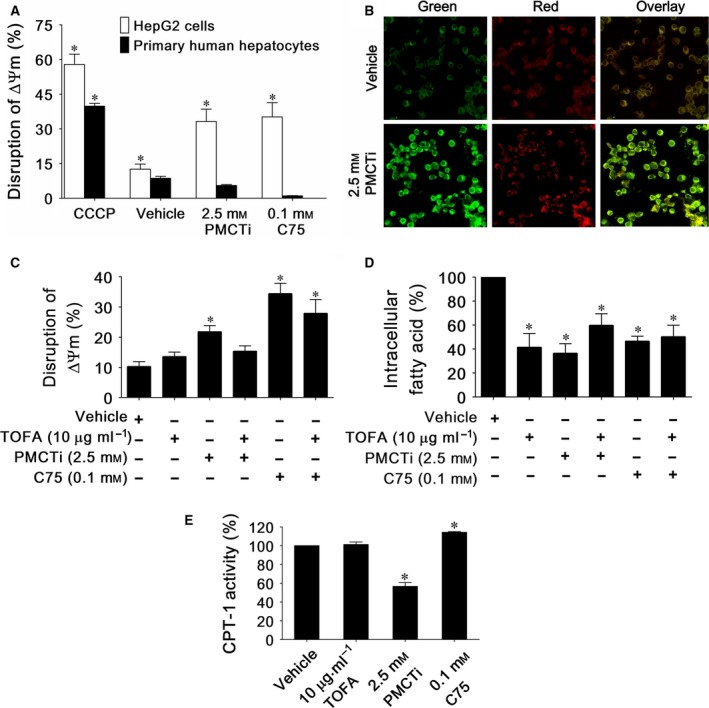
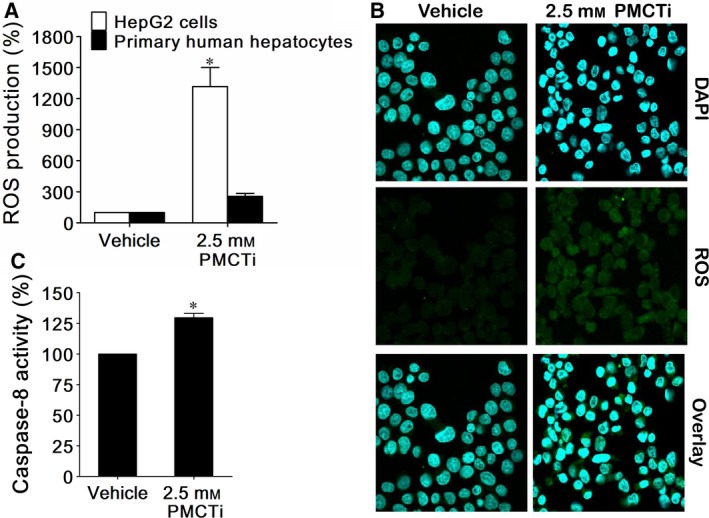
Suppression of the expression or activities of enzymes that are involved in the synthesis of de novo lipogenesis (DNL) in cancer cells triggers cell death via apoptosis. The plasma membrane citrate transporter (PMCT) is the initial step that translocates citrate from blood circulation into the cytoplasm for de novo long-chain fatty acids synthesis. This study investigated the antitumor effect of the PMCT inhibitor (PMCTi) in inducing apoptosis by inhibiting the DNL pathway in HepG2 cells. The present findings showed that PMCTi reduced cell viability and enhanced apoptosis through decreased intracellular citrate levels, which consequently caused inhibition of fatty acid and triacylglycerol productions. Thus, as a result of the reduction in fatty acid synthesis, the activity of carnitine palmitoyl transferase-1 (CPT-1) was suppressed. Decreased CPT-1 activity also facilitated the disruption of mitochondrial membrane potential (ΔΨm) leading to stimulation of apoptosis. Surprisingly, primary human hepatocytes were not affected by PMCTi. Increased caspase-8 activity as a consequence of reduction in fatty acid synthesis was also found to cause disruption of ΔΨm. In addition, apoptosis induction by PMCTi was associated with an enhanced reactive oxygen species generation. Taken together, we suggest that inhibition of the DNL pathway following reduction in citrate levels is an important regulator of apoptosis in HepG2 cells via suppression of CPT-1 activity. Thus, targeting the DNL pathway mediating CPT-1 activity by PMCTi may be a selective potential anticancer therapy.

Keywords: HepG2 cells; apoptosis; de novo lipogenesis; plasma membrane citrate transporter.


Figures

Figure 1
Figure 1
Effect of PMCTi on cell viability of cancer cells. Cells were incubated with different concentrations (0.5–3 mm) of PMCTi for 24 h. MTT assay was performed to determine the number of viable cells compared with 100% of the control (A, C, E), and IC 50 values were expressed (B, D, F). The control was defined as cells treated with a medium or 0.2% DMSO vehicle without an inhibitor. Data are presented as mean ± SEM from at least three independent experiments performed in triplicate, *P < 0.05 significantly different from the control.
Figure 2
Figure 2
Effect of PMCTi on apoptosis induction of HepG2 cells. (A,B) Representative flow cytometry scatterplots are depicted using double staining with Annexin V–Alexa Fluor 488 and propidium iodide (PI) to determine the distribution of viable, early, and late apoptotic cells in HepG2 cells and primary hepatocytes, respectively. (C,D) The percentages of cells relative to the whole cell populations (set as 100%) are expressed by bar charts showing the proportion of viable, early, late, and early plus late apoptotic cells in HepG2 cells and primary hepatocytes, respectively. C75 was used as a known apoptotic induction compound. The control was defined as cells treated with a medium or 0.2% DMSO vehicle without an inhibitor. Data are presented as mean ± SEM from at least three independent experiments performed in triplicate, *P < 0.05 significantly different from the control.
Figure 3
Figure 3
The effects of PMCTi treatment on the de novo lipogenesis pathway in HepG2 cells. (A) Lipogenic protein ACLY, ACC, and FASN expressions were detected by immunoblot, and (B) representative FASN protein expression was observed under confocal laser scanning microscopy (OLYMPUS FV1000). The control was defined as cells treated with a medium or 0.2% DMSO vehicle without an inhibitor. The band of proteins was representative of those obtained from at least three independent experiments. β‐Actin was used as an internal control for integrity with an equal amount of protein loading and transferring. (C) Bar graphs show the relative expression ratio of FASN/β‐actin. (D) Citrate, (E) fatty acid, and (F) triacylglycerol levels were detected and quantified in percentage compared with 100% of the vehicle control. Data are presented as mean ± SEM from at least three independent measurements performed in triplicate, *P < 0.05 significantly different from the control.
Figure 4
Figure 4
The effect of PMCTi inducing malonyl‐CoA accumulation leading to CPT‐1 inhibition is responsible for disruption of mitochondrial membrane potential (∆Ψm) in HepG2 cells. The ∆Ψm was evaluated by calculating the relative level of red (J‐aggregated form) to green (J‐monomeric form) fluorescence intensity from a flow cytometry analysis. (A) The percentage of disruption of ∆Ψm in HepG2 cells relative to the whole cell population is expressed in bar charts. Cells were incubated with CCCP as a positive control of the depolarization of the mitochondrial membrane. (B) The ∆Ψm of HepG2 cells treated with vehicle or PMCTi were stained with JC‐1 fluorochrome and examined by inverted confocal laser scanning microscopy. (C) From the flow cytometry experiment, pretreatment 1 h with 10 mg·mL−1 TOFA reduced disruption of ∆Ψm observed following the treatment with 12 h PMCTi. (D) The percentage of intracellular fatty acid expressed in bar charts shows a reduction in fatty acid level in cells which were pretreated with TOFA followed by the treatment with 12‐h PMCTi. (E) Bar charts represent the CPT‐1 activity expressed as percentage compared with 100% of vehicle control. Data are presented as mean ± SEM from at least three independent experiments performed in triplicate, *P < 0.05 versus control.
Figure 5
Figure 5
PMCTi increased ROS levels in HepG2 cells. After incubation of 2.5 mm of PMCTi for 24 h, (A) HepG2 cells and primary human hepatocytes were stained with CM‐H2 DCFDA, determined by flow cytometry, and expressed in percentage of ROS production compared with 100% of the control. (B) Representative imaging of ROS generation was detected under a confocal microscope. The blue channel showed DAPI‐stained nuclei, and the green channel showed CM‐H2 DCFDA‐expressed dichlorofluorescein. (C) Caspase‐8 activity was measured and expressed as percentage of the control. The control was defined as cells treated with a vehicle without an inhibitor. Data are presented as mean ± SEM, *P < 0.05 significantly different from the control.

References

    1. Zhang Y and Yang JM (2013) Altered energy metabolism in cancer: a unique opportunity for therapeutic intervention. Cancer Biol Ther 14, 81–89. - PMC - PubMed
    1. Deberardinis RJ, Sayed N, Ditsworth D and Thompson CB (2008) Brick by brick: metabolism and tumor cell growth. Curr Opin Genet Dev 18, 54–61. - PMC - PubMed
    1. Koukourakis MI, Giatromanolaki A, Winter S, Leek R, Sivridis E and Harris AL (2009) Lactate dehydrogenase 5 expression in squamous cell head and neck cancer relates to prognosis following radical or postoperative radiotherapy. Oncology 77, 285–292. - PubMed
    1. Kayser G, Kassem A, Sienel W, Schulte‐Uentrop L, Mattern D, Aumann K, Stickeler E, Werner M, Passlick B & Hausen AZ (2010) Lactate‐dehydrogenase 5 is overexpressed in non‐small cell lung cancer and correlates with the expression of the transketolase‐like protein 1. Diagn Pathol 5, 22. - PMC - PubMed
    1. Fantin VR, St‐Pierre J and Leder P (2006) Attenuation of LDH‐A expression uncovers a link between glycolysis, mitochondrial physiology, and tumor maintenance. Cancer Cell 9, 425–434. - PubMed

LinkOut - more resources