

Unraveling the dose-response puzzle of L. monocytogenes: A mechanistic approach
- PMID: 29928724
- PMCID: PMC5963320
- DOI: 10.1016/j.idm.2016.09.001
Unraveling the dose-response puzzle of L. monocytogenes: A mechanistic approach
Abstract
Food-borne disease outbreaks caused by Listeria monocytogenes continue to impose heavy burdens on public health in North America and globally. To explore the threat L. monocytogenes presents to the elderly, pregnant woman and immuno-compromised individuals, many studies have focused on in-host infection mechanisms and risk evaluation in terms of dose-response outcomes. However, the connection of these two foci has received little attention, leaving risk prediction with an insufficient mechanistic basis. Consequently, there is a critical need to quantifiably link in-host infection pathways with the dose-response paradigm. To better understand these relationships, we propose a new mathematical model to describe the gastro-intestinal pathway of L. monocytogenes within the host. The model dynamics are shown to be sensitive to inoculation doses and exhibit bi-stability phenomena. Applying the model to guinea pigs, we show how it provides useful tools to identify key parameters and to inform critical values of these parameters that are pivotal in risk evaluation. Our preliminary analysis shows that the effect of gastro-environmental stress, the role of commensal microbiota and immune cells are critical for successful infection of L. monocytogenes and for dictating the shape of the dose-response curves.
Keywords: Bi-stable; Dose-response; Guinea pig; L. monocytogenes; Mechanistic model.
Figures
- 1)
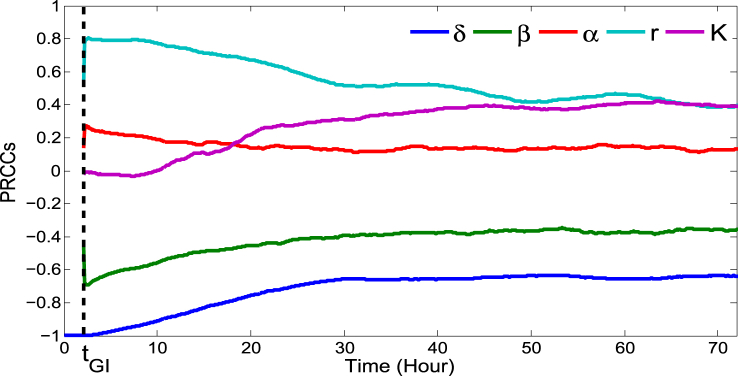
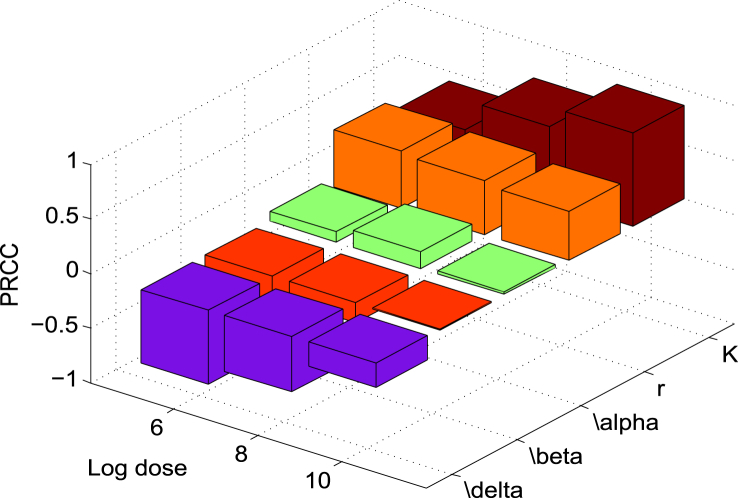
According to Fig. 4, δ is the most sensitive parameter at the beginning of the infection and it remains among the top sensitive parameters during the infection. It is even more sensitive at a lower initial dose (e.g. 106 CFU) (see Fig. 5). Recall that δ is the killing rate of bacteria in the stomach caused by the stomach acid. Being large, δ can reduce the initial dose of ingested bacteria below the threshold before they move down to the small intestine. Thus, large δ can effectively block the bacterial dissemination into the small intestine and across the body. Small δ, on the other hand, may allow sufficient amount of bacteria passing to the small intestine where the bacteria may colonize if not killed by the immune cells and commensals. Since δ acts on the bacteria during the first few hours of infection, the sensitivity declines quickly there after.
- 2)
The growth rate r plays an important role in the survival of the L. monocytogenes. Its magnitude clearly influences the population size initially, but the sensitivity of r decreases over the time as the population approaches the steady state and stabilizes (see Fig. 4). Furthermore, if r is sufficiently large then the L. monocytogenes population can survive for a longer period of time. On the other hand, with a small growth rate, L. monocytogenes may not survive against host defenses.
- 3)
The survival of L. monocytogenes is sensitive to the carrying capacity K in connection with the maximum level of the population and increases with the progression of time (Fig. 4). Since the carrying capacity has little effect on the initial growth or the survival of L. monocytogenes at the early stage of infection, it is not influential at the beginning of the infection. However, if the bacteria survives for a long time and continues to grow then K dominates the population, playing a more significant role. Fig. 5 also indicates that K is more sensitive at a higher inoculation dose. This is reasonable since the population more quickly reaches the carrying capacity with a higher initial dose.
- 4)
The killing rate, β, of L. monocytogenes in the intestine is sensitive, with negative PRCC, similar to δ and r in magnitude. The population that survives in the stomach and reaches the small intestine is killed by the host's immune cells at the rate of β. Thus β, relative to our modeling context, corresponds to the final defense posed by the host. A weak defense (immune) system, with a small β, could allow the bacteria to grow. But, a strong immune system can clear the bacteria from the small intestine before they colonize. In terms of Fig. 5, we see that for lower doses β plays a more significant role as the immune system has a higher chance of suppressing the bacterial population.
- 5)
The saturating constant, α, is the least sensitive among the model parameters. In the absence of α (i.e. α = 0) the bacteria may die out due to the host defense, but a positive value of α could help the bacteria survive. Note that in Fig. 5, the PRCC value of α seems to have maximum for initial doses near 108 CFU. While this result is not completely clear, due to the relative low sensitivity of α we defer an in depth analysis.
Similar articles
-
Advancing risk assessment: mechanistic dose-response modelling of Listeria monocytogenes infection in human populations.R Soc Open Sci. 2018 Aug 1;5(8):180343. doi: 10.1098/rsos.180343. eCollection 2018 Aug. R Soc Open Sci. 2018. PMID: 30225020 Free PMC article.
-
Risk of fetal mortality after exposure to Listeria monocytogenes based on dose-response data from pregnant guinea pigs and primates.Risk Anal. 2009 Nov;29(11):1495-505. doi: 10.1111/j.1539-6924.2009.01308.x. Risk Anal. 2009. PMID: 19886944
-
Significant shift in median guinea pig infectious dose shown by an outbreak-associated Listeria monocytogenes epidemic clone strain and a strain carrying a premature stop codon mutation in inlA.Appl Environ Microbiol. 2011 Apr;77(7):2479-87. doi: 10.1128/AEM.02626-10. Epub 2011 Feb 4. Appl Environ Microbiol. 2011. PMID: 21296943 Free PMC article.
-
Achieving continuous improvement in reductions in foodborne listeriosis--a risk-based approach.J Food Prot. 2005 Sep;68(9):1932-94. doi: 10.4315/0362-028x-68.9.1932. J Food Prot. 2005. PMID: 16161698 Review.
-
Animal models for oral transmission of Listeria monocytogenes.Front Cell Infect Microbiol. 2014 Feb 11;4:15. doi: 10.3389/fcimb.2014.00015. eCollection 2014. Front Cell Infect Microbiol. 2014. PMID: 24575393 Free PMC article. Review.
Cited by
-
Integrating Whole-Genome Sequencing Data Into Quantitative Risk Assessment of Foodborne Antimicrobial Resistance: A Review of Opportunities and Challenges.Front Microbiol. 2019 May 21;10:1107. doi: 10.3389/fmicb.2019.01107. eCollection 2019. Front Microbiol. 2019. PMID: 31231317 Free PMC article. Review.
-
Modeling Invasion of Campylobacter jejuni into Human Small Intestinal Epithelial-Like Cells by Bayesian Inference.Appl Environ Microbiol. 2020 Dec 17;87(1):e01551-20. doi: 10.1128/AEM.01551-20. Print 2020 Dec 17. Appl Environ Microbiol. 2020. PMID: 33067190 Free PMC article.
-
Advancing risk assessment: mechanistic dose-response modelling of Listeria monocytogenes infection in human populations.R Soc Open Sci. 2018 Aug 1;5(8):180343. doi: 10.1098/rsos.180343. eCollection 2018 Aug. R Soc Open Sci. 2018. PMID: 30225020 Free PMC article.
-
Competitive growth kinetics of Campylobacter jejuni, Escherichia coli O157:H7 and Listeria monocytogenes with enteric microflora in a small-intestine model.J Appl Microbiol. 2022 Feb;132(2):1467-1478. doi: 10.1111/jam.15294. Epub 2021 Sep 23. J Appl Microbiol. 2022. PMID: 34498377 Free PMC article.
References
-
- Allerberger F., Wagner M. Listeriosis: A resurgent foodborne infection. Clinical Microbiology and Infection. 2010;16(1):16–23. - PubMed
-
- Arino J., Wang L., Wolkowicz G.S.K. An alternative formulation for a delayed logistic equation. Journal of Theoretical Biology. 2006;241(1):109–119. - PubMed
-
- Arpaia N. Acetate dampens inflammatory cytokines in iec keeping peace with the microbiome : Acetate dampens inflammatory cytokine production in intestinal epithelial cells. Immunology and Cell Biology. 2014;92(7):561–562. - PubMed
-
- Artis D. Epithelial-cell recognition of commensal bacteria and maintenance of immune homeostasis in the gut. Nature Reviews Immunology. 2008;8(6):411–420. - PubMed
-
- Augustin J.C., Zuliani V., Cornu M., Guillier L. Growth rate and growth probability of Listeria monocytogenes in dairy, meat and seafood products in suboptimal conditions. Journal of Applied Microbiology. 2005;99(5):1019–1042. - PubMed
LinkOut - more resources
Full Text Sources
Other Literature Sources
