

doi: 10.1016/j.idm.2017.03.001.
eCollection 2017 May.
A primer on stochastic epidemic models: Formulation, numerical simulation, and analysis
Affiliations
- PMID: 29928733
- PMCID: PMC6002090
- DOI: 10.1016/j.idm.2017.03.001
Item in Clipboard
A primer on stochastic epidemic models: Formulation, numerical simulation, and analysis
Infect Dis Model.
.
Abstract
Some mathematical methods for formulation and numerical simulation of stochastic epidemic models are presented. Specifically, models are formulated for continuous-time Markov chains and stochastic differential equations. Some well-known examples are used for illustration such as an SIR epidemic model and a host-vector malaria model. Analytical methods for approximating the probability of a disease outbreak are also discussed.
Keywords: 60H10; 60J28; 92D30; Branching process; Continuous-time Markov chain; Minor outbreak; Stochastic differential equation.
Figures
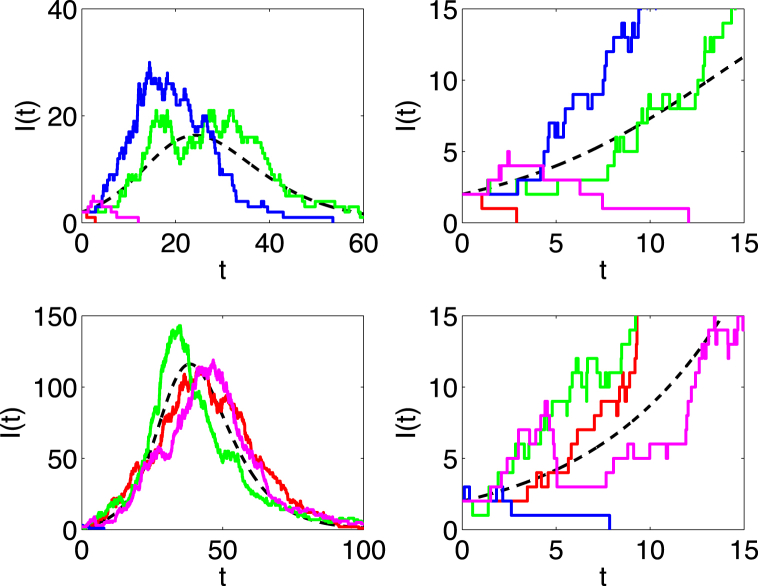
The dashed curve is the ODE solution of in the SIR model and the other curves are four sample paths of the SIR CTMC model. Parameter values are , , and either (top graphs) or (bottom graphs). The initial conditions are and . The graphs on the right are a close-up view on the time interval of the graphs on the left. The value is the estimate for the probability of a minor outbreak. On average, one sample path out of four hits zero, given and .
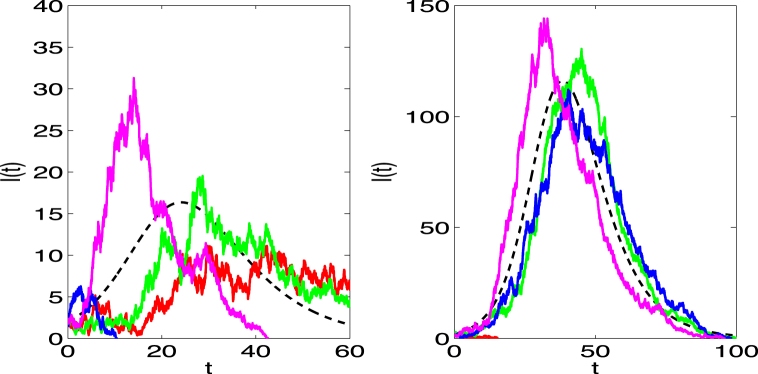
The dashed curve is the ODE solution of in the SIR model and the other solid curves are four sample paths of the SIR SDE model. Parameter values and initial conditions are the same as for the CTMC model in Fig. 1 for (left) and (right).
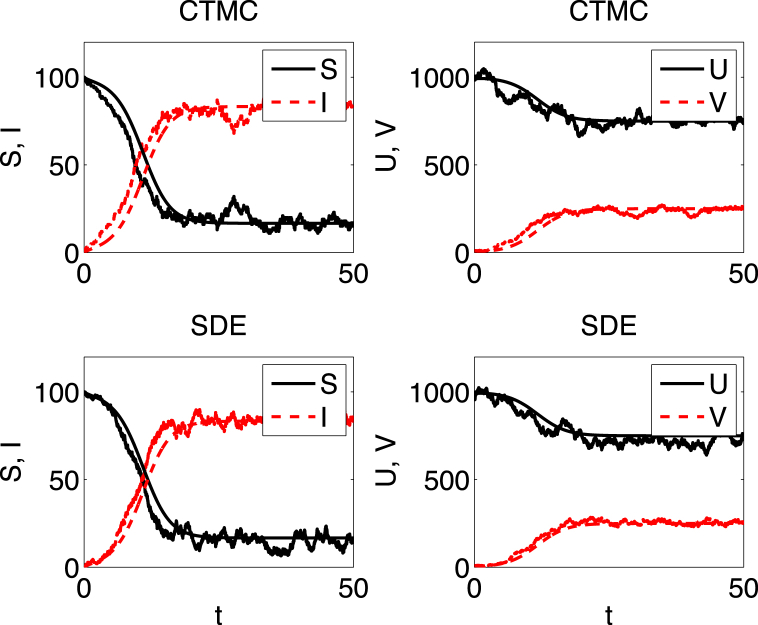
The smooth curve in each figure is the solution of the host-vector ODE model. The other curves are one sample path of the CTMC model (top two figures) and one sample path of the SDE model (bottom two figures). The parameters are , , , , and . Initial conditions are , , and The value of with and . The probability of extinction in the CTMC is approximately . The stable endemic equilibrium in the ODE model is = (16.7, 83.3, 750, 250).
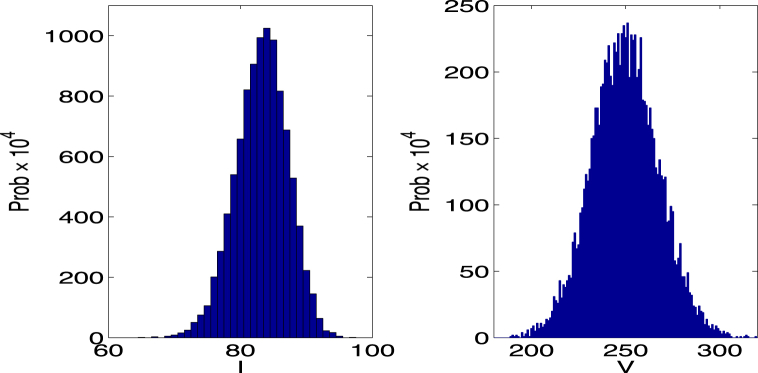
The two histograms (computed from 10,000 sample paths of the host-vector SDE model) approximate the probability density for I and V at . Parameter values are the same as in Fig. 3 but with initial conditions sufficiently large such that the probability of hitting zero is close to zero. The computed mean values and standard deviations are , , , and . The mean values are close to the endemic equilibrium values of the host-vector ODE model: .
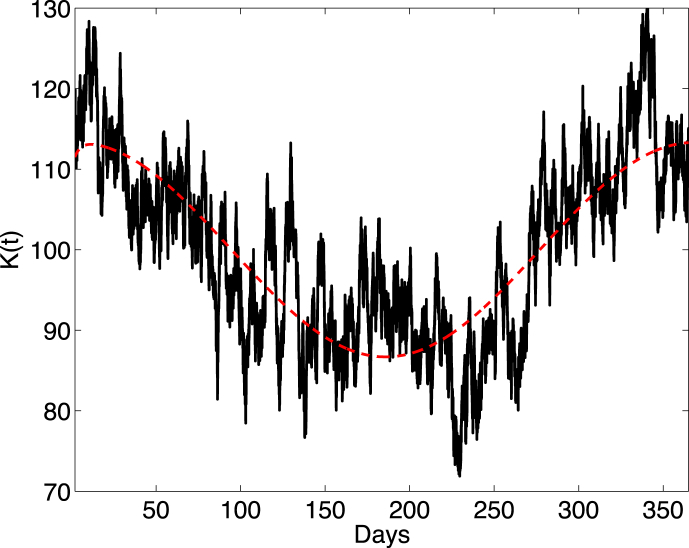
The smooth curve is the ODE solution of (Wiener process neglected in (17)) and the random curve is one sample path of the SDE model (17). Parameter values are , , , , and . The initial condition is
References
-
- Allen E. Springer; Dordrecht, The Netherlands: 2007. Modeling with Itô stochastic differential equations.
-
- Allen L.J.S. An introduction to stochastic epidemic models. In: Brauer F., van den Driessche P., Wu J., editors. Mathematical epidemiology. Vol. 1945. Springer; Berlin: 2008. pp. 81–130. (Lecture notes in mathematics). Ch. 3.
-
- Allen L.J.S. 2nd Ed. CRC Press; Boca Raton, Fl: 2010. An introduction to stochastic processes with applications to biology.
-
- Allen L.J.S. Springer International Pub.; Cham, Switzerland: 2015. Stochastic population and epidemic models. Persistence and extinction.
-
- Allen E. Environmental variability and mean-reverting processes. Discrete and Continuous Dynamical Systems Series B. 2016;21(7):2073–2089.
LinkOut - more resources
Full Text Sources
Other Literature Sources
