. 2018 Oct;596(19):4693-4707.
doi: 10.1113/JP275911. Epub 2018 Aug 7.

Apparent calcium dependence of vesicle recruitment

Affiliations

Apparent calcium dependence of vesicle recruitment

Andreas Ritzau-Jost et al. J Physiol. 2018 Oct.

Abstract

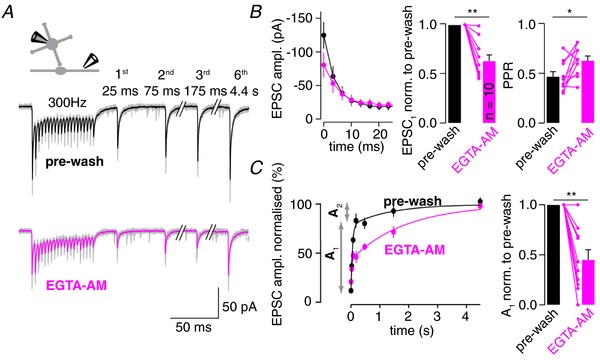
Key points: Synaptic transmission relies on the recruitment of neurotransmitter-filled vesicles to presynaptic release sites. Increased intracellular calcium buffering slows the recovery from synaptic depression, suggesting that vesicle recruitment is a calcium-dependent process. However, the molecular mechanisms of vesicle recruitment have only been investigated at some synapses. We investigate the role of calcium in vesicle recruitment at the cerebellar mossy fibre to granule cell synapse. We find that increased intracellular calcium buffering slows the recovery from depression following physiological stimulation. However, the recovery is largely resistant to perturbation of the molecular pathways previously shown to mediate calcium-dependent vesicle recruitment. Furthermore, we find two pools of vesicles with different recruitment speeds and show that models incorporating two pools of vesicles with different calcium-independent recruitment rates can explain our data. In this framework, increased calcium buffering prevents the release of intrinsically fast-recruited vesicles but does not change the vesicle recruitment rates themselves.

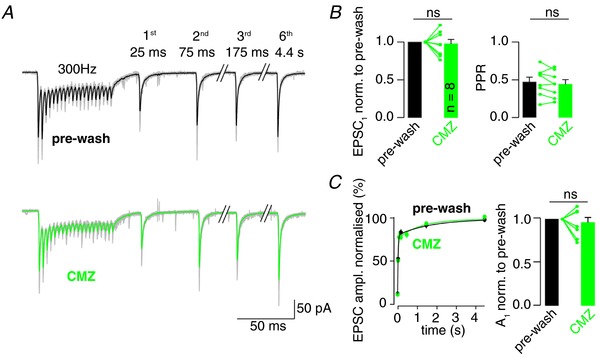
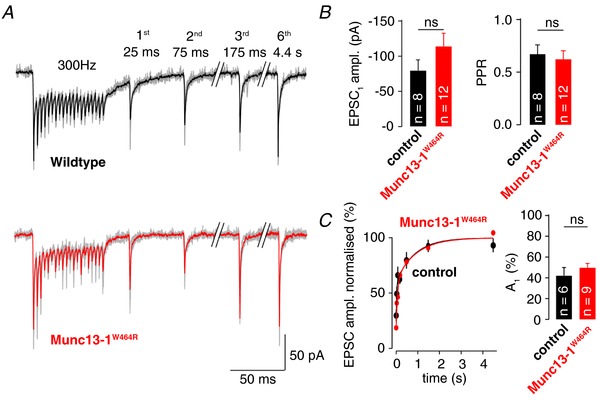
Abstract: During sustained synaptic transmission, recruitment of new transmitter-filled vesicles to the release site counteracts vesicle depletion and thus synaptic depression. An elevated intracellular Ca2+ concentration has been proposed to accelerate the rate of vesicle recruitment at many synapses. This conclusion is often based on the finding that increased intracellular Ca2+ buffering slows the recovery from synaptic depression. However, the molecular mechanisms of the activity-dependent acceleration of vesicle recruitment have only been analysed at some synapses. Using physiological stimulation patterns in postsynaptic recordings and step depolarizations in presynaptic bouton recordings, we investigate vesicle recruitment at cerebellar mossy fibre boutons. We show that increased intracellular Ca2+ buffering slows recovery from depression dramatically. However, pharmacological and genetic interference with calmodulin or the calmodulin-Munc13 pathway, which has been proposed to mediate Ca2+ -dependence of vesicle recruitment, barely affects vesicle recovery from depression. Furthermore, we show that cerebellar mossy fibre boutons have two pools of vesicles: rapidly fusing vesicles that recover slowly and slowly fusing vesicles that recover rapidly. Finally, models adopting such two pools of vesicles with Ca2+ -independent recruitment rates can explain the slowed recovery from depression upon increased Ca2+ buffering. Our data do not rule out the involvement of the calmodulin-Munc13 pathway during stronger stimuli or other molecular pathways mediating Ca2+ -dependent vesicle recruitment at cerebellar mossy fibre boutons. However, we show that well-established two-pool models predict an apparent Ca2+ -dependence of vesicle recruitment. Thus, previous conclusions of Ca2+ -dependent vesicle recruitment based solely on increased intracellular Ca2+ buffering should be considered with caution.

Keywords: Synapse; calcium buffering; short-term plasticity; vesicle recruitment.


Figures

Figure 1
Figure 1. EGTA‐AM slows recovery from synaptic depression
A, example EPSC trains elicited by 20 axonal stimulations at 300 Hz before (pre‐wash) and after wash‐in of EGTA‐AM (100 μm) via the bath perfusion in a single experiment (individual traces in grey, average before and after wash‐in in black and magenta, respectively). Trains were followed by stimuli at different time points addressing recovery from synaptic depression. Inset: illustration of a whole‐cell patch clamp recording from a GC and extracellular stimulation of a mossy fibre axon. B, Left: average time‐course of the first eight EPSC amplitudes within the train before and after EGTA‐AM wash‐in. Middle: average amplitude of initial train EPSC (EPSC1) after EGTA‐AM application normalized to the pre‐wash amplitude. Right: PPR before and after EGTA‐AM wash‐in. C, Left: average recovery of EPSC amplitudes following 300 Hz stimulation before and after EGTA‐AM wash‐in superimposed with bi‐exponential fits. The fast initial and slower second recovery components of the pre‐wash data are indicated by labelled arrows (A 1 and A 2). Right: average reduction of the amplitude of A 1 by EGTA‐AM normalized to the pre‐wash A 1. Colour code in (B) and (C) as in (A); dots in (B) and (C), as well as all bar graphs, denote the mean ± SEM; lines and dots in bar graphs depict individual experiments; Wilcoxon signed‐rank test, * P < 0.05, ** P < 0.01; n = 10 for (B) and (C), where n indicates the number of recordings from different cells.
Figure 2
Figure 2. A membrane‐permeable calmodulin blocker does not alter synaptic recovery
A, example 300 Hz EPSC trains and recovery EPSCs before (pre‐wash) and after bath application of CMZ (10 μm) in a single experiment (individual traces in grey, average for pre‐wash and CMZ in black and green, respectively). B, Left: average amplitude of EPSC1 after CMZ application normalized to the pre‐wash amplitude. Right: PPR before and after CMZ wash‐in. C, Left: average recovery of EPSC amplitudes following 300 Hz stimulation before and after CMZ wash‐in superimposed with bi‐exponential fits. Right: average reduction of the fast component of the bi‐exponential fit (A 1) by CMZ normalized to the corresponding value before wash‐in. Colour code in (B) and (C) as in (A); dots in (C), as well as all bar graphs, denote the mean ± SEM; lines and dots in bar graphs depict effect in single experiments; Wilcoxon signed‐rank test, ns indicates P > 0.05; n = 8 for (B) and (C), where n indicates the number of recordings from different cells.
Figure 3
Figure 3. Interference with the calmodulin‐Munc13‐1 pathway does not alter synaptic recovery
A, example EPSC trains evoked at 300 Hz with recovery EPSCs in control and Munc13‐1W464R mice (single experiments, individual traces in grey, mean traces for wild‐type and Munc13 mutants in black and red, respectively). B, Left: average amplitude of EPSC1 in control and Munc13‐1W464R mice. Right: PPR in control and Munc13‐1W464R mice. C, Left: average recovery of EPSC amplitudes following 300 Hz train stimulation and bi‐exponential fits to the average recovery time courses in control and Munc13‐1W464R mice. Right: average fractional amplitude of the fast component of the bi‐exponential fit (A 1) for control and Munc13‐1W464R mice. Colour code in (B) and (C) as in (A); dots in (C), as well as all bar graphs, denote the mean ± SEM; Mann–Whitney U test; ns indicates P > 0.05; n = 8 and 12 for control and Munc13‐1W464R mice, where n indicates the number of recordings from different cells; for analysis of A 1 in (C), two recordings for control and three for Munc13‐1W464R mice were excluded because the recovery time course was mono‐exponential.
Figure 4
Figure 4. Paired pre‐ and postsynaptic recordings reveal two pools of vesicle with different, calmodulin‐independent recruitment speeds
A, example voltage command for cMFB (V m), Ca2+ currents in cMFB (I Ca), EPSCs in GC (I post) and cumulative release rate (N ves) during paired 3 ms depolarizations with an interstimulus interval (ISI) of 30 ms. Left inset: illustration of a simultaneous whole‐cell patch clamp recording from GC and cMFB. Inset in N ves: superposition of N ves during the first and second 3 ms depolarization (scale bar = 500 μs). B, superposition of N ves during the first (left) and second (right) 3 ms depolarization for different ISIs as indicated by colour code. C, average Ca2+ current amplitude (I Ca), average total number of released vesicles (N) and average number of rapidly released vesicles (N 1) plotted vs. ISIs for control peptide (20 μm, black) and MLCK peptide (20 μm, green). N and N 1 are normalized to the values of the first 3 ms depolarization; n = 7 and 5 for recordings with the control and MLCK peptide, respectively, where n is the number of paired recordings.
Figure 5
Figure 5. A simple two‐pool model predicts an apparent Ca2+‐dependence of vesicle recruitment
A, illustration of simple model assuming two pools of vesicles (N low pr and N high pr) displaying high and low release probability (p r). N high pr vesicles are slowly recruited from N low pr vesicles and N low pr are rapidly recruited from a supply pool (not shown). Increasing presynaptic Ca2+ buffering (EGTA) reduces the release probability of N low pr more than that of N high pr vesicles. In some models, EGTA blocks facilitation of release probabilities. B, release probabilities of low‐ and high‐p r vesicles (top) and EPSC amplitudes normalized to the first EPSC amplitude (bottom, dots indicate recorded data adopted from Fig. 1) during 300 Hz stimulation. Predictions of the model described in (A) are shown as lines (solid black line for model with pre‐wash; solid magenta line for a model including EGTA and facilitation unaffected by EGTA; dashed magenta line for a model with EGTA fully blocking facilitation). C, average experimental (Fig. 1) and simulated reduction of EPSC1 amplitude (left) and PPR (right). D, release probabilities of low‐ and high‐p r vesicles (top) and normalized EPSC amplitudes (bottom) recorded during the end of the train and the initial recovery (left) and during the entire recovery (right) superimposed with the predictions of the models described in (A) (colour code as in B). E, average reduction of the fast recovery component (A 1) recorded (Fig. 1) and predicted by the models described in (A). Dots in (B) and (D), as well as all bar graphs, denote the mean ± SEM; solid bars depict recorded data, model prediction as open bars; * P < 0.05, ** P < 0.01 as in Fig. 1.
Figure 6
Figure 6. A 3‐D model also predicts an apparent Ca2+‐dependent recruitment
A, illustration of the 3‐D model with two types of vesicles and Ca2+ channel to vesicle distances of 6.5 and 15 nm, respectively. The vesicles close to Ca2+ channels experience higher local Ca2+ transients and therefore have a higher p r. The recruitment rates are, as in the simple two‐pool model, Ca2+‐independent, slow for close vesicles and fast for remote vesicles. To simulate the EGTA‐AM data, EGTA at a concentration of 20 mm with realistic Ca2+ binding and unbinding rates was added to the simulation. B, release probabilities of low‐ and high‐p r vesicles (top) and EPSC amplitudes normalized to the first EPSC amplitude (bottom) during 300 Hz stimulation superimposed with the predictions of the 3‐D model described in (A) (dots indicate recorded data adopted from Fig. 1; black solid line for model with pre‐wash condition; solid magenta line for EGTA condition). C, experimental and simulated reduction of EPSC1 amplitude (left) and PPR (right). D, release probabilities of low‐ and high‐p r vesicles (top) and normalized EPSC amplitudes (bottom) during the end of the train and the initial recovery (left) and the entire recovery (right) superimposed with the predictions of the 3‐D model (colour code as in B). E, recorded average reduction of the fast recovery component (A 1) and prediction of the 3‐D model described in (A). Dots in (B) and (D), as well as all bar graphs, denote the mean ± SEM; recorded data are depicted as solid bars, model prediction as open bars, * P < 0.05, ** P < 0.01.

Comment in

References

    1. Atluri PP & Regehr WG (1998). Delayed release of neurotransmitter from cerebellar granule cells. J Neurosci 18, 8214–8227. - PMC - PubMed
    1. Babai N, Bartoletti TM & Thoreson WB (2010). Calcium regulates vesicle replenishment at the cone ribbon synapse. J Neurosci 30, 15866–15877. - PMC - PubMed
    1. Böhme MA, Beis C, Reddy‐Alla S, Reynolds E, Mampell MM, Grasskamp AT, Lützkendorf J, Bergeron DD, Driller JH, Babikir H, Göttfert F, Robinson IM, O'Kane CJ, Hell SW, Wahl MC, Stelzl U, Loll B, Walter AM & Sigrist SJ (2016). Active zone scaffolds differentially accumulate Unc13 isoforms to tune Ca2+ channel‐vesicle coupling. Nat Neurosci 19, 1311–1320. - PubMed
    1. Borst JG & Soria van Hoeve J (2012). The calyx of Held synapse: from model synapse to auditory relay. Annu Rev Physiol 74, 199–224. - PubMed
    1. Chen Z, Das B, Nakamura Y, DiGregorio DA & Young SM, Jr (2015). Ca2+ channel to synaptic vesicle distance accounts for the readily releasable pool kinetics at a functionally mature auditory synapse. J Neurosci 35, 2083–2100. - PMC - PubMed

Publication types

LinkOut - more resources