

Transverse cardiac slicing and optical imaging for analysis of transmural gradients in membrane potential and Ca2+ transients in murine heart
- PMID: 29928770
- PMCID: PMC6117587
- DOI: 10.1113/JP276239
Transverse cardiac slicing and optical imaging for analysis of transmural gradients in membrane potential and Ca2+ transients in murine heart
Abstract
Key points: A robust cardiac slicing approach was developed for optical mapping of transmural gradients in transmembrane potential (Vm ) and intracellular Ca2+ transient (CaT) of murine heart. Significant transmural gradients in Vm and CaT were observed in the left ventricle. Frequency-dependent action potentials and CaT alternans were observed in all ventricular regions with rapid pacing, with significantly greater incidence in the endocardium than epicardium. The observations demonstrate the feasibility of our new approach to cardiac slicing for systematic analysis of intrinsic transmural and regional gradients in Vm and CaT.
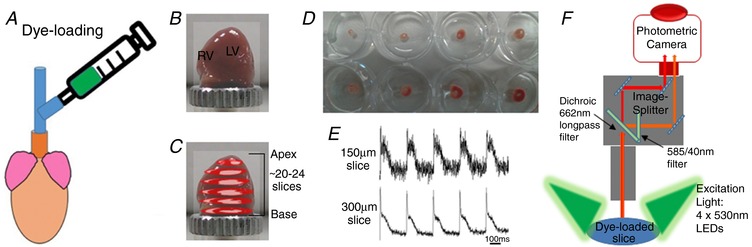
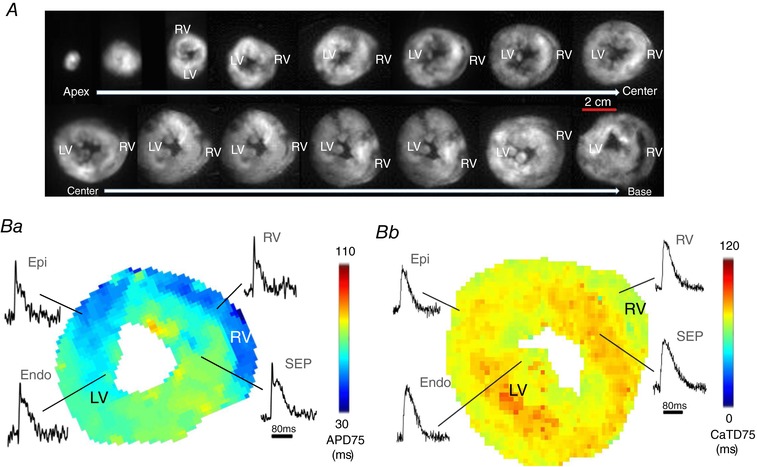
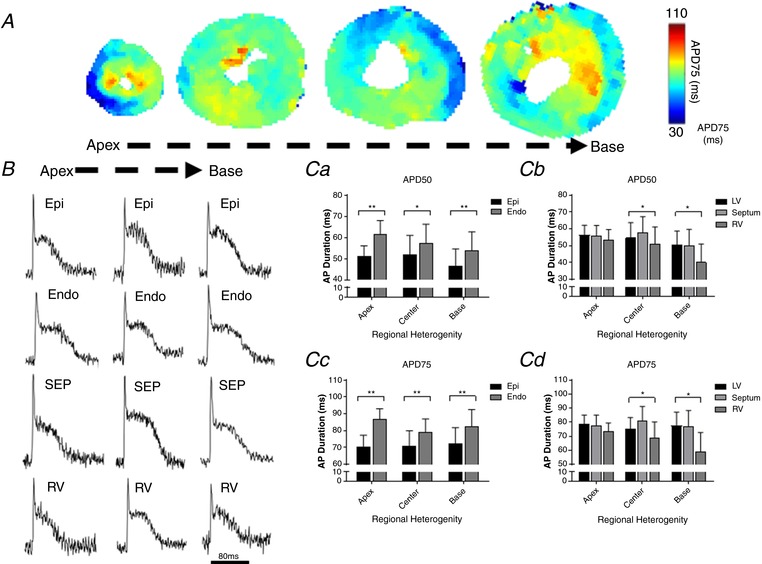
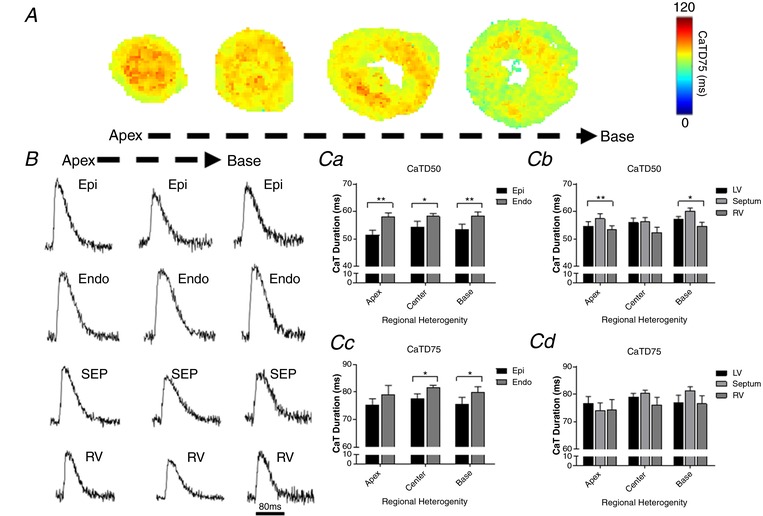
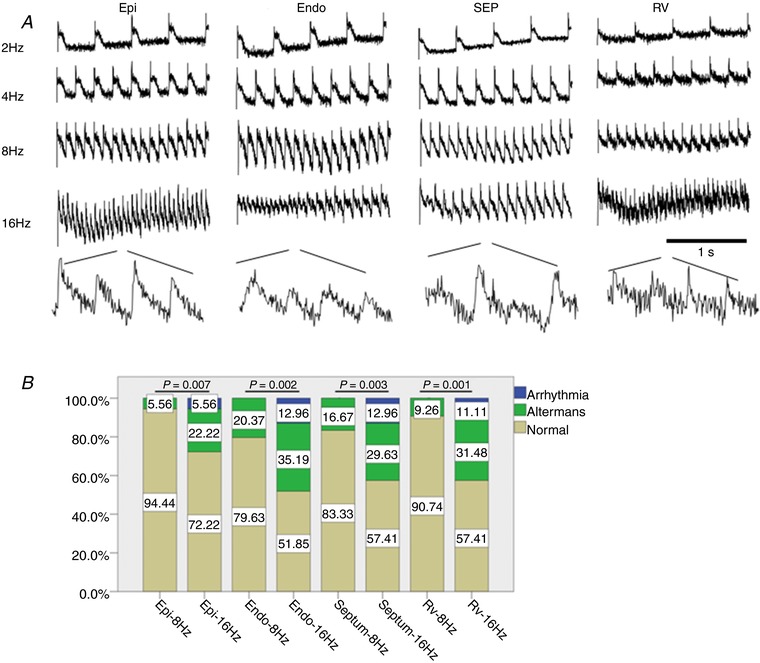
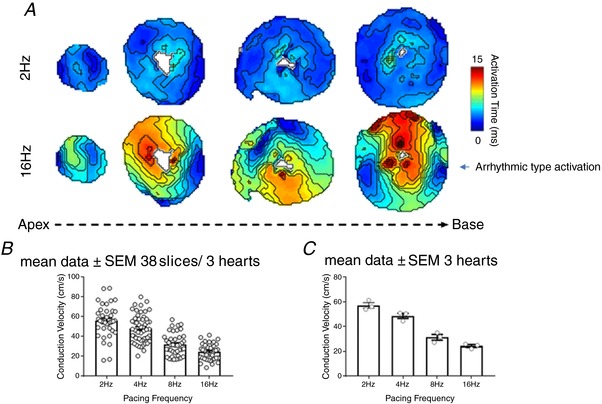
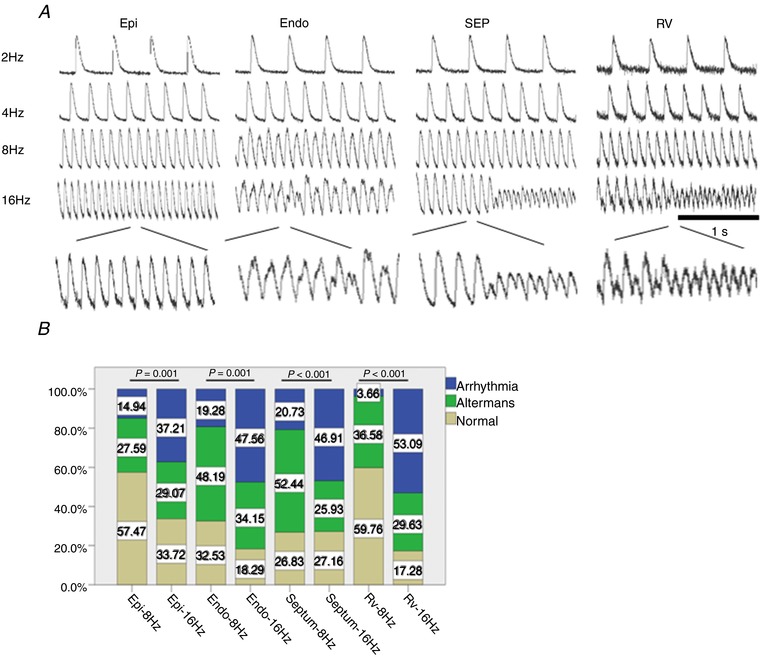
Abstract: Transmural and regional gradients in membrane potential and Ca2+ transient in the murine heart are largely unexplored. Here, we developed and validated a robust approach which combines transverse ultra-thin cardiac slices and high resolution optical mapping to enable systematic analysis of transmural and regional gradients in transmembrane potential (Vm ) and intracellular Ca2+ transient (CaT) across the entire murine ventricles. The voltage dye RH237 or Ca2+ dye Rhod-2 AM were loaded through the coronary circulation using a Langendorff perfusion system. Short-axis slices (300 μm thick) were prepared from the entire ventricles (from the apex to the base) by using a high-precision vibratome. Action potentials (APs) and CaTs were recorded with optical mapping during steady-state baseline and rapid pacing. Significant transmural gradients in Vm and CaT were observed in the left ventricle, with longer AP duration (APD50 and APD75 ) and CaT duration (CaTD50 and CaTD75 ) in the endocardium compared with that in the epicardium. No significant regional gradients were observed along the apico-basal axis of the left ventricle. Interventricular gradients were detected with significantly shorter APD50 , APD75 and CaTD50 in the right ventricle compared with left ventricle and ventricular septum. During rapid pacing, AP and CaT alternans were observed in most ventricular regions, with significantly greater incidence in the endocardium in comparison with epicardium. In conclusion, these observations demonstrate the feasibility of our new approach to cardiac slicing for systematic analysis of intrinsic transmural and regional gradients in Vm and CaT in murine ventricular tissue.
Keywords: cardiac slices; electrophysiological heterogeneity; murine heart; optical imaging.
© 2018 The Authors. The Journal of Physiology published by John Wiley & Sons Ltd on behalf of The Physiological Society.
Figures
Comment in
-
The best thing since sliced bread? Optical mapping of transverse cardiac slices in the mouse heart.J Physiol. 2018 Sep;596(17):3825-3826. doi: 10.1113/JP276669. Epub 2018 Jul 21. J Physiol. 2018. PMID: 29974471 Free PMC article. No abstract available.
Similar articles
-
A Protocol for Transverse Cardiac Slicing and Optical Mapping in Murine Heart.Front Physiol. 2019 Jun 25;10:755. doi: 10.3389/fphys.2019.00755. eCollection 2019. Front Physiol. 2019. PMID: 31293436 Free PMC article.
-
Intramural optical mapping of V(m) and Ca(i)2+ during long-duration ventricular fibrillation in canine hearts.Am J Physiol Heart Circ Physiol. 2012 Mar 15;302(6):H1294-305. doi: 10.1152/ajpheart.00426.2011. Epub 2012 Jan 20. Am J Physiol Heart Circ Physiol. 2012. PMID: 22268104 Free PMC article.
-
Brief endocardial surge of Ca²⁺ transient but monotonic suppression of action potential occurs during acute ischemia in canine ventricular tissue.Heart Rhythm. 2013 Aug;10(8):1201-8. doi: 10.1016/j.hrthm.2013.05.021. Epub 2013 May 29. Heart Rhythm. 2013. PMID: 23727277
-
Transmural heterogeneity of repolarization and Ca2+ handling in a model of mouse ventricular tissue.Am J Physiol Heart Circ Physiol. 2010 Aug;299(2):H454-69. doi: 10.1152/ajpheart.00907.2009. Epub 2010 Jun 4. Am J Physiol Heart Circ Physiol. 2010. PMID: 20525874 Free PMC article.
-
Transmural dispersion of repolarization and arrhythmogenicity: the Brugada syndrome versus the long QT syndrome.J Electrocardiol. 1999;32 Suppl:158-65. doi: 10.1016/s0022-0736(99)90074-2. J Electrocardiol. 1999. PMID: 10688320 Review.
Cited by
-
Cardiomyocyte functional screening: interrogating comparative electrophysiology of high-throughput model cell systems.Am J Physiol Cell Physiol. 2019 Dec 1;317(6):C1256-C1267. doi: 10.1152/ajpcell.00306.2019. Epub 2019 Oct 2. Am J Physiol Cell Physiol. 2019. PMID: 31577512 Free PMC article.
-
Living myocardial slices: Advancing arrhythmia research.Front Physiol. 2023 Jan 13;14:1076261. doi: 10.3389/fphys.2023.1076261. eCollection 2023. Front Physiol. 2023. PMID: 36711023 Free PMC article. Review.
-
Optimizing the discovery and assessment of therapeutic targets in heart failure with preserved ejection fraction.ESC Heart Fail. 2021 Oct;8(5):3643-3655. doi: 10.1002/ehf2.13504. Epub 2021 Aug 2. ESC Heart Fail. 2021. PMID: 34342166 Free PMC article. Review.
-
Basic Research Approaches to Evaluate Cardiac Arrhythmia in Heart Failure and Beyond.Front Physiol. 2022 Feb 7;13:806366. doi: 10.3389/fphys.2022.806366. eCollection 2022. Front Physiol. 2022. PMID: 35197863 Free PMC article. Review.
-
Myocardial slices come to age: an intermediate complexity in vitro cardiac model for translational research.Cardiovasc Res. 2020 Jun 1;116(7):1275-1287. doi: 10.1093/cvr/cvz341. Cardiovasc Res. 2020. PMID: 31868875 Free PMC article. Review.
References
-
- Asano Y, Takashima S, Asakura M, Shintani Y, Liao Y, Minamino T, Asanuma H, Sanada S, Kim J, Ogai A, Fukushima T, Oikawa Y, Okazaki Y, Kaneda Y, Sato M, Miyazaki J, Kitamura S, Tomoike H, Kitakaze M & Hori M (2004). Lamr1 functional retroposon causes right ventricular dysplasia in mice. Nat Genet 36, 123–130. - PubMed
-
- Baker LC, London B, Choi BR, Koren G & Salama G (2000). Enhanced dispersion of repolarization and refractoriness in transgenic mouse hearts promotes reentrant ventricular tachycardia. Circ Res 86, 396–407. - PubMed
-
- Barclay CJ ( 2005). Modelling diffusive O2 supply to isolated preparations of mammalian skeletal and cardiac muscle. J Muscle Res Cell Motil 26, 225–235. - PubMed
Publication types
MeSH terms
Grants and funding
LinkOut - more resources
Full Text Sources
Other Literature Sources
Miscellaneous