. 2018 Sep;596(17):4253-4267.
doi: 10.1113/JP275902. Epub 2018 Jul 19.

Altered synaptic and firing properties of cerebellar Purkinje cells in a mouse model of ARSACS

Affiliations

Altered synaptic and firing properties of cerebellar Purkinje cells in a mouse model of ARSACS

Visou Ady et al. J Physiol. 2018 Sep.

Erratum in

  • Corrigendum.
    [No authors listed] [No authors listed] J Physiol. 2019 Jul;597(13):3503. doi: 10.1113/JP278333. Epub 2019 Jun 6. J Physiol. 2019. PMID: 31257620 No abstract available.

Abstract

Key points: Autosomal recessive spastic ataxia of Charlevoix-Saguenay (ARSACS) is an early-onset neurodegenerative human disease characterized in part by ataxia and Purkinje cell loss in anterior cerebellar lobules. A knock-out mouse model has been developed that recapitulates several features of ARSACS. Using this ARSACS mouse model, we report changes in synaptic input and intrinsic firing in cerebellar Purkinje cells, as well as in their synaptic output in the deep cerebellar nuclei. Changes in firing are observed in anterior lobules that later exhibit Purkinje cell death, but not in posterior lobules that do not. Our results show that both synaptic and intrinsic alterations in Purkinje cell properties likely contribute to disease manifestation in ARSACS; these findings resemble pathophysiological changes reported in several other ataxias.

Abstract: Autosomal recessive spastic ataxia of Charlevoix-Saguenay (ARSACS) is an early-onset neurodegenerative disease that includes a pronounced and progressive cerebellar dysfunction. ARSACS is caused by an autosomal recessive loss-of-function mutation in the Sacs gene that encodes the protein sacsin. To better understand the cerebellar pathophysiology in ARSACS, we studied synaptic and firing properties of Purkinje cells from a mouse model of ARSACS, Sacs-/- mice. We found that excitatory synaptic drive was reduced onto Sacs-/- Purkinje cells, and that Purkinje cell firing rate, but not regularity, was reduced at postnatal day (P)40, an age when ataxia symptoms were first reported. Firing rate deficits were limited to anterior lobules that later display Purkinje cell death, and were not observed in posterior lobules where Purkinje cells are not lost. Mild firing deficits were observed as early as P20, prior to the manifestation of motor deficits, suggesting that a critical level of cerebellar dysfunction is required for motor coordination to emerge. Finally, we observed a reduction in Purkinje cell innervation onto target neurons in the deep cerebellar nuclei (DCN) in Sacs-/- mice. Together, these findings suggest that multiple alterations in the cerebellar circuit including Purkinje cell input and output contribute to cerebellar-related disease onset in ARSACS.

Keywords: action potential; cerebellum; deep cerebellar nuclei; synaptic currents.


Figures

Figure 1
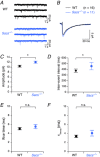
Figure 1. Altered glutamatergic input to Purkinje cells in P60 Sacs−/− mice
A, sample traces of AMPA‐mediated miniature current recordings from representative WT (top, black) and Sacs−/− Purkinje cells (bottom, blue). B, superimposed average traces of AMPA‐mediated mEPSCs from WT and Sacs−/− Purkinje cells. C, an increase of average mEPSC amplitude is observed. D, this is accompanied by an increase of the inter‐event interval in Sacs−/− Purkinje cells in comparison to WT. E and F, neither the rise time (E) nor the decay time constant (τdecay; F) is significantly different in WT or Sacs−/− Purkinje cells. WT: N = 3, n = 16; Sacs−/−: N = 4, n = 11. n.s., P > 0.05; * P < 0.05.
Figure 2
Figure 2. Reduced firing rate of anterior Purkinje cells in P40 Sacs−/− mice
A, schematic representation showing anterior lobule recording site (in grey) and animal age. B, sample spike trains from representative WT (top, black) and Sacs−/− (bottom, blue) Purkinje cells from anterior lobule III. C, frequency histogram of Purkinje cell firing is shifted left in Sacs−/− mice compared to WT, with no high‐frequency Purkinje cells present in Sacs−/− cerebellum. D, firing rate in Sacs−/− Purkinje cells is significantly lower than WT. E, however, no changes in the coefficient of variation (CV) of interspike intervals is observed in Sacs−/− mice. F, acute blockade of fast excitatory and inhibitory synaptic inputs onto Purkinje cells (Synaptic blockers) did not significantly affect spontaneous firing in WT or Sacs−/− mice (P > 0.05). WT: N = 11, n = 71; Sacs−/−: N = 9, n = 51 for A–E; WT: N = 7, n = 29; Sacs−/−: N = 6, n = 19 for F. n.s., P > 0.05; *** P < 0.001.
Figure 3
Figure 3. Reduced firing rate of P20 anterior Sacs−/− Purkinje cells precedes ataxia onset
A, schematic representation showing recordings made from anterior lobules at P20 (in grey). B, histogram showing distribution of firing rates is similar in WT (open bars) and Sacs−/− (blue) Purkinje cells. C and D, nonetheless, there is a small reduction in the average firing rate of Sacs−/− Purkinje cells (C) without a change in the CV of interspike interval (D). E and F, motor coordination defects evaluated by rotarod assays (E) and the latency to cross a balance beam (F) are not yet detectable in Sacs−/− mice. WT: N = 3, n = 31; Sacs−/−: N = 5, n = 38 for A–D; WT: N = 8; Sacs−/−: N = 8 for E and F. n.s., P > 0.05; *** P < 0.005.
Figure 4
Figure 4. Action potential waveforms are not different in Sacs−/− Purkinje cells
A, schematic representation showing anterior lobule recording site (in grey) and animal age. B, sample intracellular action potential waveforms recorded from WT (top, black) and Sacs−/− (bottom, blue) Purkinje cells from anterior lobules. C, sample action potential from WT Purkinje cell showing spike property measurements action potential (AP) peak and half‐width, as well as after‐hyperpolarization (AHP) amplitude. DF, AP peak (D), half‐width (E) and AHP amplitude (F) are not significantly different for spikes measured from Sacs−/− Purkinje cells and WT. WT: N = 5, n = 10; Sacs−/−: N = 6, n = 10. n.s., P > 0.05.
Figure 5
Figure 5. 4‐AP does not affect firing properties in Sacs−/− mice
We acutely applied 5 μM (left) and 10 μM (right) 4‐AP to WT (before: open bar; after: grey) and Sacs−/− mice (before: bright blue; after: light blue), and found no significant changes in frequency for either WT or Sacs−/− Purkinje cells (5 μM: N = 2, n = 6 WT; N = 2, n = 8 Sacs−/− Purkinje cells; 10 μM: N = 4, n = 9 WT; N = 5, n = 15 Sacs−/− Purkinje cells). These concentrations of 4‐AP have been shown to affect Purkinje cell firing rate in other mouse models of ataxia, likely through the action of Kv1 type channels (Alviña & Khodakhah, 2010b). n.s., P > 0.05.
Figure 6
Figure 6. Changes in the input–output function of Sacs−/− Purkinje cells reflect inability to sustain high‐frequency firing
A, schematic representation showing anterior lobule recording site (in grey) and animal age. B, sample traces from WT (black) and Sacs−/− (blue) Purkinje cells showing evoked action potential firing for a given current injection, as indicated in inset (left, nA). C, summary input−output curve data reveal that Sacs−/− (blue) Purkinje cells show reduced firing frequency with higher current injection amplitudes compared to WT (black). D, in agreement, the highest frequency firing each cell achieves is reduced in Sacs−/− Purkinje cells compared to WT (frequency measured for 0.24 pA current injection). E, however, the maximum instantaneous firing rate is not altered. WT: N = 8, n = 10; Sacs−/−: N = 8, n = 13 for injections up to 0.1 nA; WT: N = 3, n = 5; Sacs−/−: N = 4, n = 8 for all other current injections, including data in D and E. n.s., P > 0.05; * P < 0.05; ** P < 0.01.
Figure 7
Figure 7. Unaltered firing properties of posterior lobule Purkinje cells in P40 Sacs−/− mice
A, schematic representation showing posterior lobule recording site (in grey). B, frequency histogram shows both WT (unfilled columns) and Sacs−/− (blue columns) Purkinje cells fire at frequencies below 120 Hz. C and D, average firing rate (C) and CV of interspike interval (D) are not significantly different between Sacs−/− and WT Purkinje cells. WT: N = 5, n = 56; Sacs−/−: N = 8, n = 59. n.s., P > 0.05.
Figure 8
Figure 8. Ratio of Purkinje cell positive GABAergic puncta is high and unchanged in Sacs−/− DCN
A, representative images showing VGAT‐positive GABAergic puncta (yellow, left) with calbindin‐positive Purkinje‐cell puncta (magenta, middle) apposed to a large DCN neuron, and merged image showing colabelled puncta (white, right) with occasional VGAT‐positive, calbindin‐negative puncta highlighted with asterisk. Scale bar, 15 μm. B, the proportion of calbindin‐positive GABAergic puncta is high on WT DCN large neurons, and is unchanged in Sacs−/− DCN. N = 4 for both WT and Sacs−/−; n.s., P > 0.05.
Figure 9
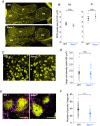
Figure 9. Reduction of Purkinje cell puncta on large neurons in the deep cerebellar nuclei (DCN) in Sacs−/− mice
A, representative images of deep cerebellar nuclei labelled with NeuN (yellow) with individual dentate (DN), fastigial (FN) and interposed (IN) nuclei indicated in dashed lines from WT (top) and Sacs−/− (bottom) mice. Scale bar, 200 μm. B, neither the FN (left) nor the IN (right) showed significant differences in volume in Sacs−/− mice (N = 4 for WT; N = 3 for Sacs−/− mice). C, representative image showing neurons labelled with NeuN (yellow) from WT (left) and Sacs−/− (right) mouse DCN. Only large neurons with >15 μm diameter were included for this and subsequent measurements. Scale bar, 15 μm. D, density of large‐diameter cells was not significantly different in WT or Sacs−/− mice (N = 4 for WT and Sacs−/− mice). E, representative images showing Purkinje cell (calbindin‐positive) puncta (magenta) on large cells (NeuN positive, yellow) in WT (left) and Sacs−/− (right) mouse DCN. Scale bar, 15 μm. F, the number of Purkinje cell positive puncta made onto DCN large cells was significantly reduced. WT: N = 4; Sacs−/−: N = 4. n.s., P > 0.05; *** P < 0.001.

Similar articles

Cited by

References

    1. Ady V & Watt AJ (2017). New old drug(s) for spinocerebellar ataxias. J Physiol 595, 5–6. - PMC - PubMed
    1. Alviña K & Khodakhah K (2010a). KCa channels as therapeutic targets in episodic ataxia type‐2. J Neurosci 30, 7249–7257. - PMC - PubMed
    1. Alviña K & Khodakhah K (2010b). The therapeutic mode of action of 4‐aminopyridine in cerebellar ataxia. J Neurosci 30, 7258–7268. - PMC - PubMed
    1. Arancillo M, White JJ, Lin T, Stay TL & Sillitoe RV (2015). In vivo analysis of Purkinje cell firing properties during postnatal mouse development. J Neurophysiol 113, 578–591. - PMC - PubMed
    1. Bouchard JP, Barbeau A, Bouchard R & Bouchard RW (1978). Autosomal recessive spastic ataxia of Charlevoix‐Saguenay. Can J Neurol Sci 5, 61–69. - PubMed

Publication types

Supplementary concepts

Grants and funding

LinkOut - more resources