. 2018 Aug:68:25-33.
doi: 10.1016/j.dnarep.2018.04.008. Epub 2018 May 5.

Nitric oxide induced S-nitrosation causes base excision repair imbalance

Affiliations

Nitric oxide induced S-nitrosation causes base excision repair imbalance

Marcus C Parrish et al. DNA Repair (Amst). 2018 Aug.

Abstract

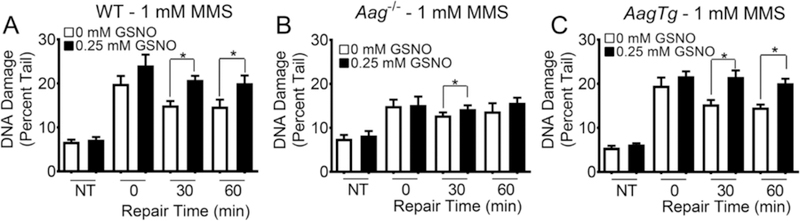
It is well established that inflammation leads to the creation of potent DNA damaging chemicals, including reactive oxygen and nitrogen species. Nitric oxide can react with glutathione to create S-nitrosoglutathione (GSNO), which can in turn lead to S-nitrosated proteins. Of particular interest is the impact of GSNO on the function of DNA repair enzymes. The base excision repair (BER) pathway can be initiated by the alkyl-adenine DNA glycosylase (AAG), a monofunctional glycosylase that removes methylated bases. After base removal, an abasic site is formed, which then gets cleaved by AP endonuclease and processed by downstream BER enzymes. Interestingly, using the Fluorescence-based Multiplexed Host Cell Reactivation Assay (FM-HCR), we show that GSNO actually enhances AAG activity, which is consistent with the literature. This raised the possibility that there might be imbalanced BER when cells are challenged with a methylating agent. To further explore this possibility, we confirmed that GSNO can cause AP endonuclease to translocate from the nucleus to the cytoplasm, which might further exacerbate imbalanced BER by increasing the levels of AP sites. Analysis of abasic sites indeed shows GSNO induces an increase in the level of AP sites. Furthermore, analysis of DNA damage using the CometChip (a higher throughput version of the comet assay) shows an increase in the levels of BER intermediates. Finally, we found that GSNO exposure is associated with an increase in methylation-induced cytotoxicity. Taken together, these studies support a model wherein GSNO increases BER initiation while processing of AP sites is decreased, leading to a toxic increase in BER intermediates. This model is also supported by additional studies performed in our laboratory showing that inflammation in vivo leads to increased large-scale sequence rearrangements. Taken together, this work provides new evidence that inflammatory chemicals can drive cytotoxicity and mutagenesis via BER imbalance.

Keywords: AAG; Base excision repair; DNA alkylation; GSNO; S-Nitrosation.


Conflict of interest statement

Conflict of interest statement

The authors declare that there are no conflicts of interest.

Figures

Fig. 1.
Fig. 1.
BER and MGMT repair processes. (A) Simplified schematic of the Base Excision Repair pathway. The BER pathway is initiated by alkyladenine glycosylase (AAG), which excises the damaged base (black) leaving an abasic site. AP endonuclease-1 cleaves the phosphate-sugar backbone producing a 3′OH and a 5′-deoxyribose phosphate (5′-dRP). Polymerase β (POLβ) uses its dRPase activity to remove the dRP and inserts the correct base. Ligase 3 (LIG3) seals the backbone with XRCC1 acting as a scaffold. All repair intermediates shown in the gray box are detected through CometChip analysis. (B) Nitric oxide (red) can react with glutathione (GSH) to produce S-nitrosoglutathione (GSNO). (C) O6MeG methyltransferase (MGMT) repairs O6MeG by transferring the methyl lesion (blue) to its cysteine. (D) GSNO can transfer the nitric oxide moiety (red) to the active site cysteine of MGMT to form the inactive SNO-MGMT.
Fig. 2.
Fig. 2.
GSNO exposure induces an increase in repair intermediates in MMS challenged cells. (A and B) CometChip analysis of WT MEFs exposed to GSNO and 0.5 mM MMS (A) and 0 mM MMS (B). Not treated MEF data (NT) in (A) is the same as the zero minute repair in (B). Each data point represents mean ± SEM for three independent experiments; *p < 0.05 for paired Student’s t-test.
Fig. 3.
Fig. 3.
GSNO exposure induces increased AAG activity. (A) Simplified schematic of the hypoxanthine reporter (Hx) of the FM-HCR assay. Cells transfected with the Hx reporter will display high fluorescence if RNA polymerase incorrectly inserts a cytosine in the transcript (top). If the Hx is repaired/cleaved, cells will not fluoresce (bottom). (B) Hx reporter assay tested in WT MEFs, Aag−/− MEFs, and constitutively active Aag, AagTg MEFs. (C and D) Hx Reporter assay tested in WT (C) and AagTg (D) MEFs exposed to GSNO. Each data point represents mean ± SEM for three independent experiments; *p < 0.05 for paired Student’s t-test.
Fig. 4.
Fig. 4.
GSNO exposed Aag−/− MEFs display minimal increase MMS-induced BER intermediates. CometChip analysis of WT (A), Aag−/− (B), and AagTg (C) MEFs exposed to 0 or 0.25 mM GSNO and challenged with 1 mM MMS. NT refers to cells not challenged with MMS, lysed at 0min. Each data point represents mean ± SEM for seven independent experiments; *p < 0.05 for paired Student’s t-test.
Fig. 5.
Fig. 5.
GSNO affects activity and localization of BER proteins and reduces cell viability after MMS challenge. (A) Simplified schematic of the tetrahydrofuran (THF) reporter of the FM-HCR assay. If unrepaired, THF will block transcription and inhibit fluorescence (top). If THF is fully repaired, cells will display higher fluorescence (bottom). (B) THF reporter assay in WT MEFs exposed to GSNO. (C) Representative immunofluorescent stains for APE-1 (yellow) and nuclei (Blue) of WT MEFs exposed to 0 mM (top) and 0.25 mM (bottom) GSNO. White box indicates inset image. Arrows indicate cells. (D) Blinded visual quantification of cells with APE-1 in the cytoplasm exposed to GSNO. (E) Abasic site analysis of GSNO exposed cells. NT = non-treated cells challenged with MMS and lysed at 0 min. Other bars show treatment with indicated concentrations of GSNO and 1 mM MMS. 60 min samples were allowed to repair abasic sites for 60 min at 37 °C in media with indicated GSNO concentration. Data is relative to NT. (F) Analysis of the colony forming assay of MEFs exposed to GSNO. Each bar represents the ratio of the surviving fraction of the MMS challenged cells to the non-MMS challenged cells at each GSNO concentration. Each data point represents mean ± SEM for three independent experiments; *p < 0.05 for paired Student’s t-test.

Similar articles

Cited by

References

    1. Hoeijmakers JH, DNA damage, aging, and cancer, N. Engl. J. Med 361 (15) (2009) 1475–1485. - PubMed
    1. Fu D, Calvo JA, Samson LD, Balancing repair and tolerance of DNA damage caused by alkylating agents, Nat. Rev. Cancer 12 (2) (2012) 104–120. - PMC - PubMed
    1. Lindahl T, Wood RD, Quality control by DNA repair, Science 286 (5446) (1999) 1897–1905. - PubMed
    1. Prasad R, Shock DD, Beard WA, Wilson SH, Substrate channeling in mammalian base excision repair pathways: passing the baton, J. Biol. Chem 285 (52) (2010) 40479–40488. - PMC - PubMed
    1. Calvo JA, Allocca M, Fake KR, Muthupalani S, Corrigan JJ, Bronson RT, et al., Parpl protects against Aag-dependent alkylation-induced nephrotoxicity in a sex-dependent manner, Oncotarget 7 (29) (2016) 44950–44965. - PMC - PubMed

Publication types

LinkOut - more resources