. 2018 Oct:119:26-36.
doi: 10.1016/j.envint.2018.06.007. Epub 2018 Jun 18.

Biomarkers of exposure to SVOCs in children and their demographic associations: The TESIE Study

Affiliations

Biomarkers of exposure to SVOCs in children and their demographic associations: The TESIE Study

Kate Hoffman et al. Environ Int. 2018 Oct.

Abstract

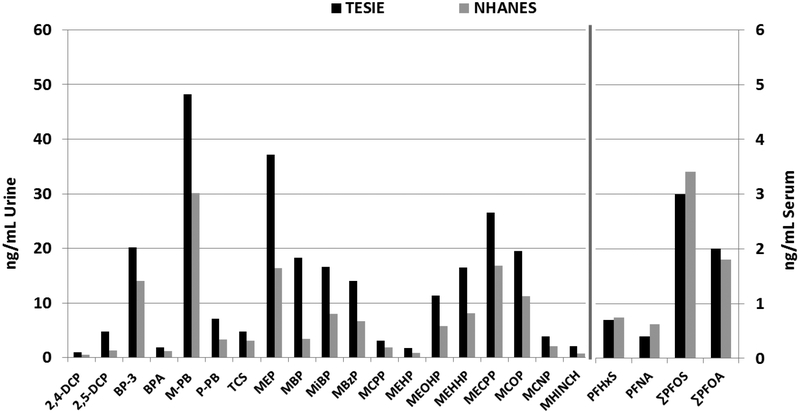
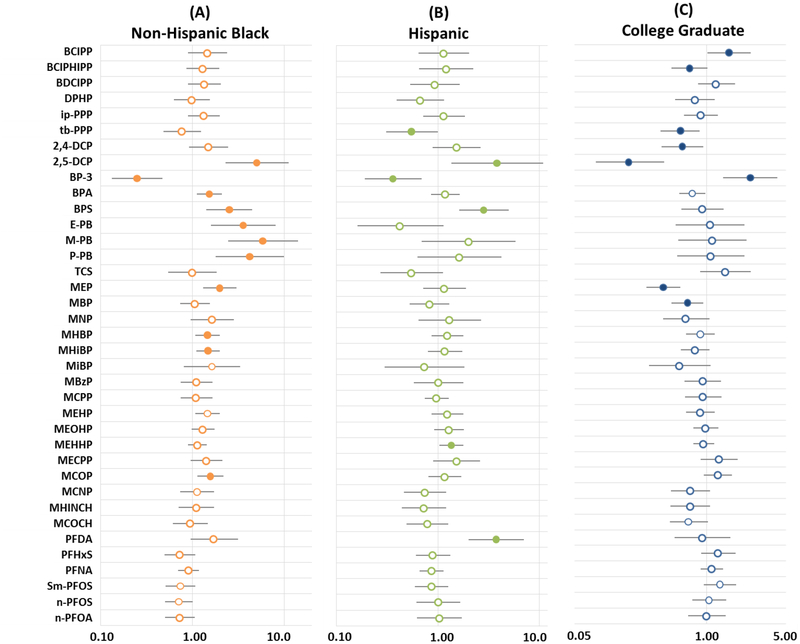
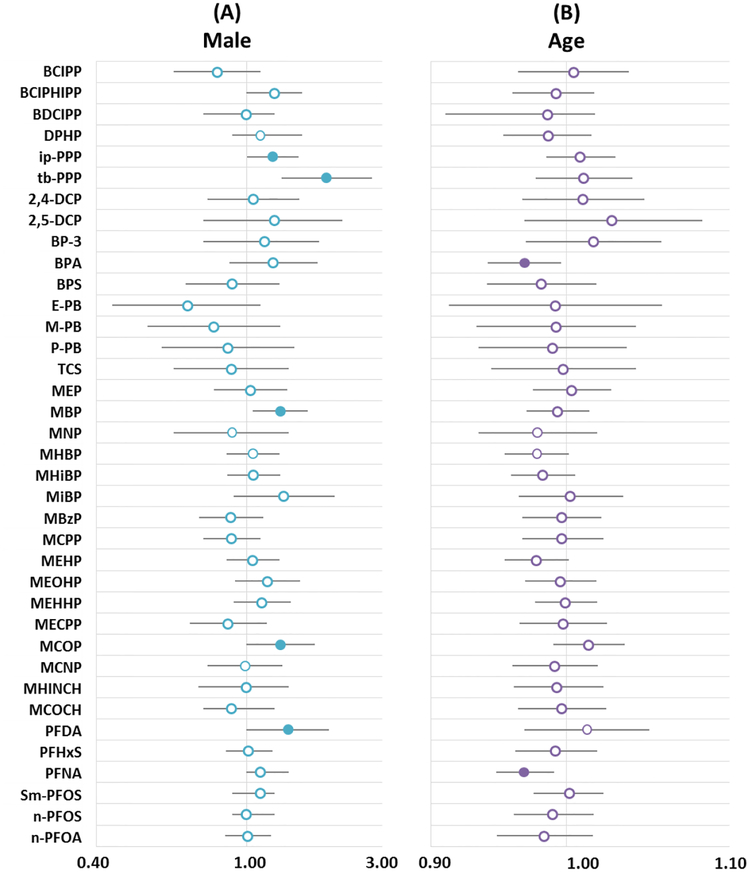
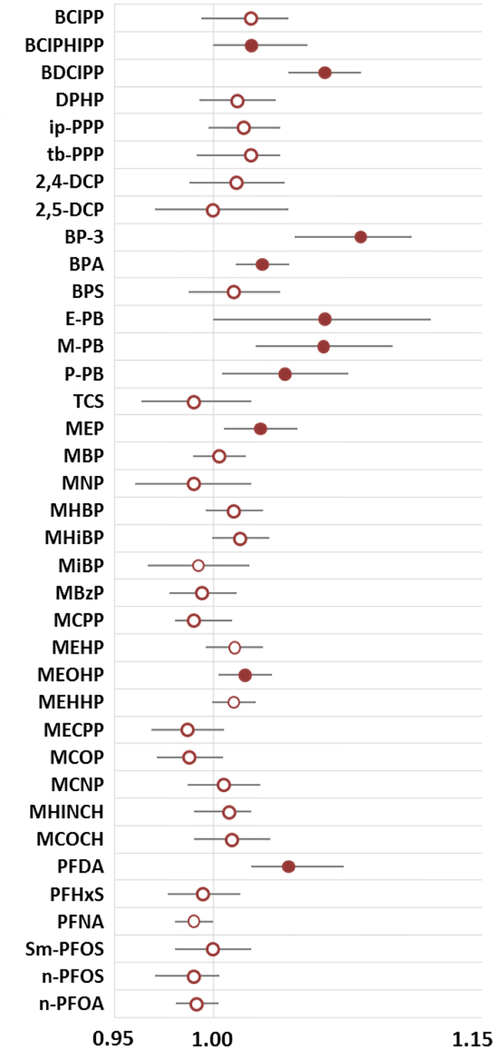
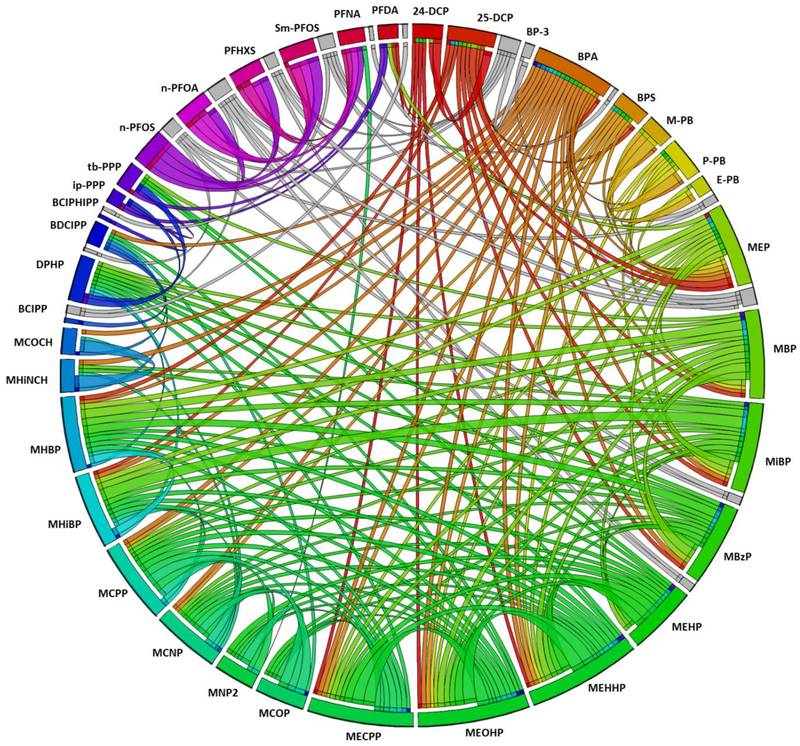
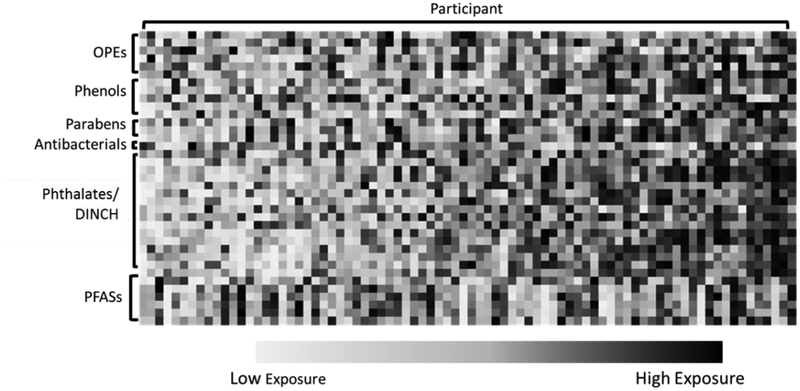
Semi-volatile organic compounds (SVOCs) are used extensively in consumer and personal care products; electronics; furniture; and building materials and are detected in most indoor environments. As a result, human exposure to mixtures of SVOCs is wide-spread. However, very few studies have measured biomarkers of exposure to multiple SVOC classes, and exposure determinants have not been thoroughly explored, particularly for young children. In this study, we investigated biomarkers of exposure to SVOCs among children (age 3-6 years), who may experience higher exposures and be more susceptible to adverse health outcomes than other age groups. We enrolled 203 participants in the Toddlers Exposure to SVOCs in Indoor Environments (TESIE) study (181 provided urine samples and 90 provided serum samples).We quantified 44 biomarkers of exposure to phthalates, organophosphate esters (OPEs), parabens, phenols, antibacterial agents and per- and polyfluoroalkyl substances (PFASs); we detected 29 of the 44 biomarkers in >95% of samples, and many biomarkers were detected at higher median concentrations than those previously reported in the U.S. general population. Demographic characteristics were associated with differences in concentrations. In general, non-Hispanic white race and higher maternal education were associated with lower concentrations, even after adjusting for other potential confounding variables. Our results suggest that outdoor temperature at the time of biospecimen collection may be a particularly important and under-evaluated predictor of biomarker concentrations; statistically significant relationships were observed between 10 biomarkers and outdoor temperature at the time of collection. A complex correlation structure was also observed among the biomarkers assessed. By and large, statistically significant correlations between biomarkers of exposure to phthalates, parabens, phenols, and OPEs were positive. Conversely, although PFASs were positively correlated with one another, they tended to be negatively correlated with other biomarkers where significant associations were observed. Taken together, our results provide evidence that the assessments of SVOC-associated health impacts should focus on chemical mixtures.

Keywords: Children; Exposure; Semi-volatile organic compounds (SVOCs).


Figures

Figure 1:
Figure 1:
Comparison of median biomarker concentrations between TESIE and two subsamples of 2013–2014 NHANES children age 3–5 years (122 children for urinary metabolites [36] and 118 for serum PFASs [34]).
Figure 2:
Figure 2:
Estimated multiplicative change in biomarker concentration by maternal characteristics. Change for (A) non-Hispanic black and (B) Hispanic children compared to non-Hispanic white children and (C) for the children of college graduates compared to children of mothers with less education. Values >1 indicate elevated concentration relative to the reference group. All analyses adjusted for child age and sex; maternal race/ethnicity and education; and average outdoor temperature at the time of collection. Filled circles are used where p<0.05 and bars indicate 95% confidence intervals.
Figure 3:
Figure 3:
Estimated multiplicative change in biomarker concentration. (A) Multiplicative change in biomarker concentrations among male children as compared to female children and (B) change for each month increase in age. All analyses adjusted for child age and sex; maternal race/ethnicity and education; and average outdoor temperature at the time of collection. Filled circles are used where p<0.05 and bars indicate 95% confidence intervals.
Figure 4:
Figure 4:
Estimated multiplicative change in biomarker concentration for a one degree Celsius in average high temperature during the sample collection period. All analyses adjusted for child age and sex and for maternal race/ethnicity and education. Filled circles are used where p<0.05 and bars indicate 95% confidence intervals.
Figure 5:
Figure 5:
Circos plot displaying Spearman correlations between biomarkers. Correlations are represented by ribbons (i.e., lines) between variables with the width of the ribbon corresponding to the strength of the correlation such that a wider band represents a stronger correlation. Rainbow colored bands are used for positive correlations (using a different color for each biomarker) and negative correlations are shown in gray scale. Only Spearman correlations >0.25 or <−0.25 and statistically significant at p<0.05 are displayed.
Figure 6:
Figure 6:
Biomarker ranking relative to the cohort average for the 80 TESIE participants with both serum and urinary biomarker measurements. Each column depicts rankings for single a participant and each row depicts one biomarker. Blue colors indicate below average concentrations and pink indicates above average concentrations.

References

    1. Weschler CJ and Nazaroff WW, Semivolatile organic compounds in indoor environments. Atmospheric Environment, 2008. 42(40): p. 9018–9040.
    1. Hoffman K, et al., Temporal Trends in Exposure to Organophosphate Flame Retardants in the United States. Environmental Science & Technology Letters, 2017. 4(3): p. 112–118. - PMC - PubMed
    1. Calafat AM, et al., Polyfluoroalkyl chemicals in the U.S. population: data from the National Health and Nutrition Examination Survey (NHANES) 2003–2004 and comparisons with NHANES 1999–2000. Environ Health Perspect, 2007. 115(11): p. 1596–602. - PMC - PubMed
    1. Silva MJ, et al., Urinary levels of seven phthalate metabolites in the U.S. population from the National Health and Nutrition Examination Survey (NHANES) 1999–2000. Environ Health Perspect, 2004. 112(3): p. 331–8. - PMC - PubMed
    1. Ye X, et al., Urinary concentrations of 2,4-dichlorophenol and 2,5-dichlorophenol in the U.S. population (National Health and Nutrition Examination Survey, 2003–2010): trends and predictors. Environ Health Perspect, 2014. 122(4): p. 351–5. - PMC - PubMed

Publication types

LinkOut - more resources