. 2018 Jun 22;19(1):236.
doi: 10.1186/s12859-018-2246-7.

Gene length corrected trimmed mean of M-values (GeTMM) processing of RNA-seq data performs similarly in intersample analyses while improving intrasample comparisons

Collaborators, Affiliations

Gene length corrected trimmed mean of M-values (GeTMM) processing of RNA-seq data performs similarly in intersample analyses while improving intrasample comparisons

Marcel Smid et al. BMC Bioinformatics. .

Abstract

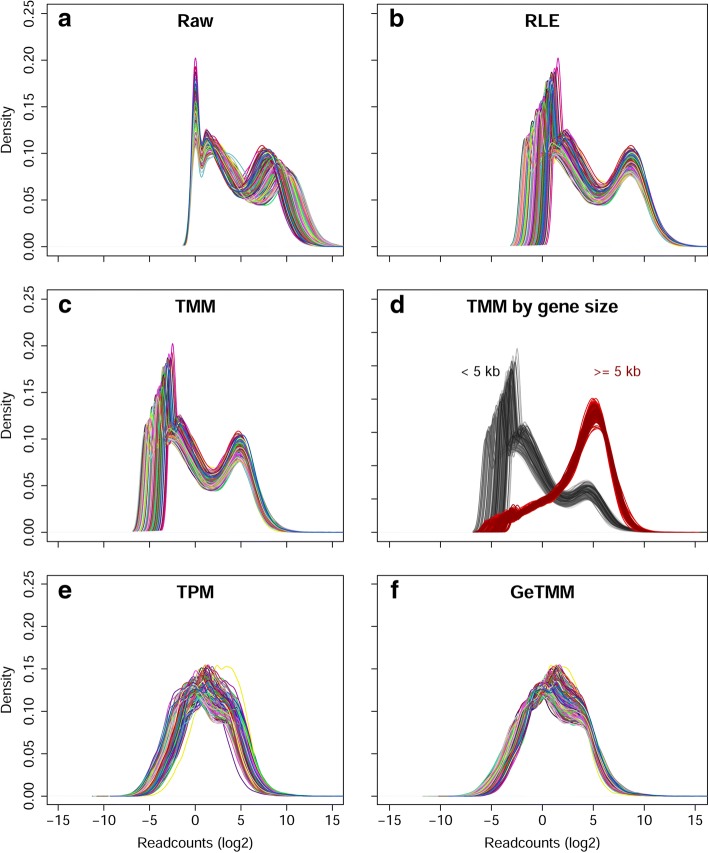
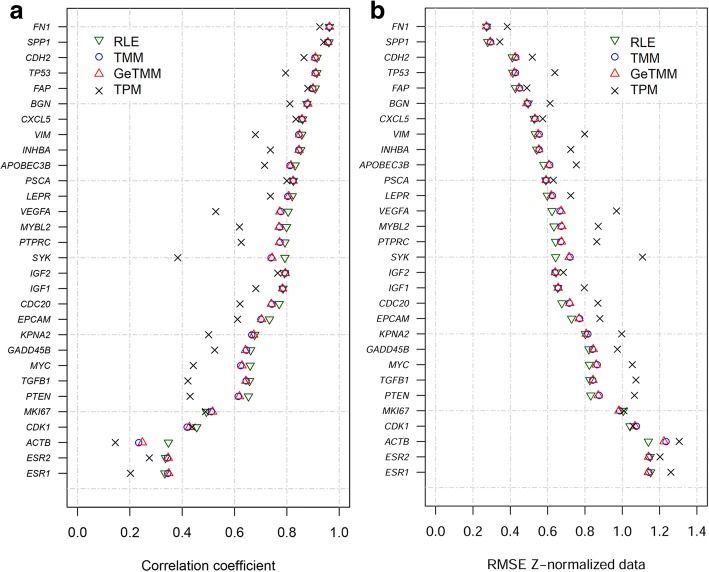
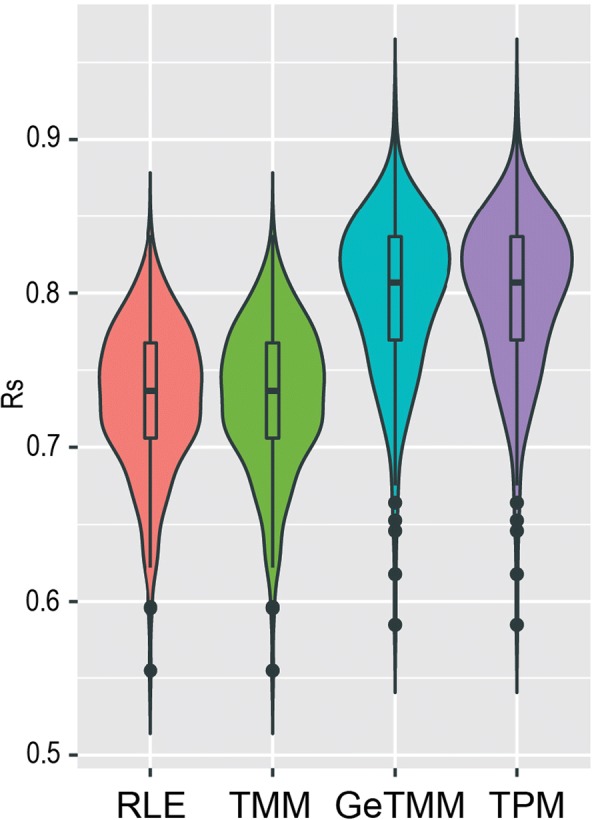
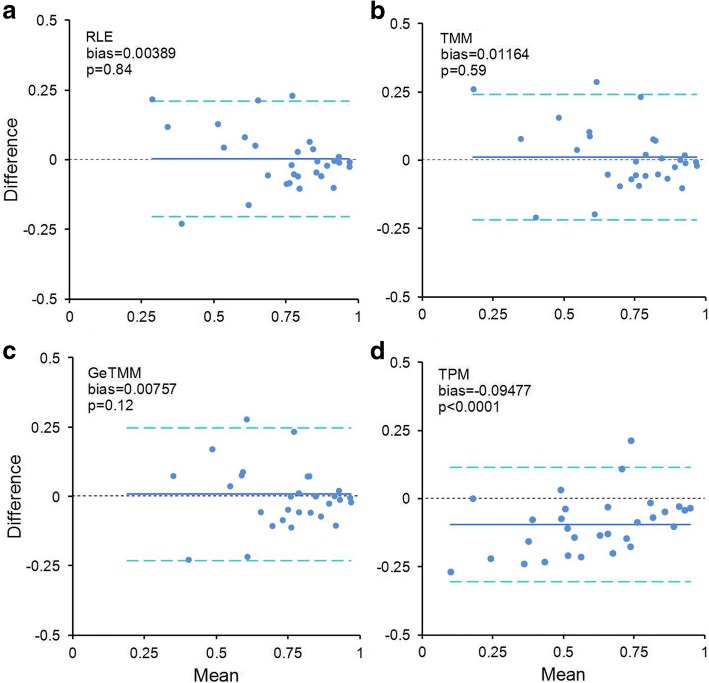
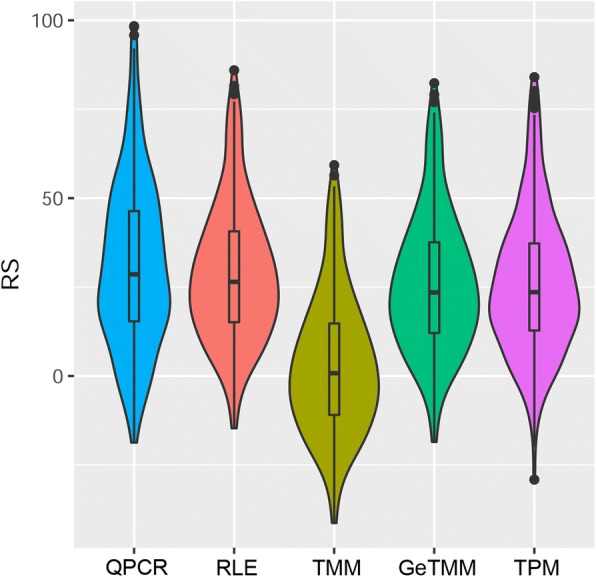
Background: Current normalization methods for RNA-sequencing data allow either for intersample comparison to identify differentially expressed (DE) genes or for intrasample comparison for the discovery and validation of gene signatures. Most studies on optimization of normalization methods typically use simulated data to validate methodologies. We describe a new method, GeTMM, which allows for both inter- and intrasample analyses with the same normalized data set. We used actual (i.e. not simulated) RNA-seq data from 263 colon cancers (no biological replicates) and used the same read count data to compare GeTMM with the most commonly used normalization methods (i.e. TMM (used by edgeR), RLE (used by DESeq2) and TPM) with respect to distributions, effect of RNA quality, subtype-classification, recurrence score, recall of DE genes and correlation to RT-qPCR data.

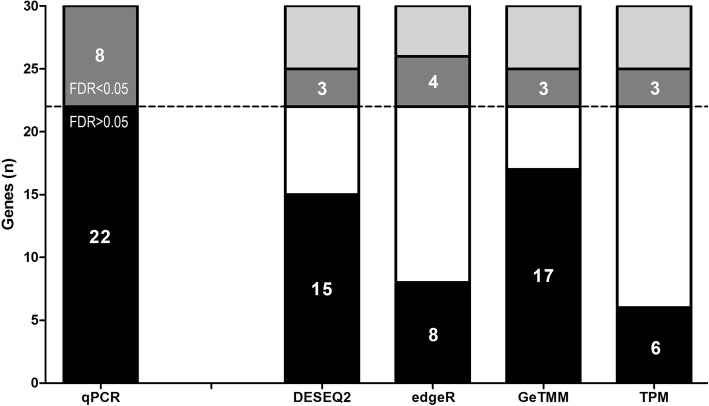
Results: We observed a clear benefit for GeTMM and TPM with regard to intrasample comparison while GeTMM performed similar to TMM and RLE normalized data in intersample comparisons. Regarding DE genes, recall was found comparable among the normalization methods, while GeTMM showed the lowest number of false-positive DE genes. Remarkably, we observed limited detrimental effects in samples with low RNA quality.

Conclusions: We show that GeTMM outperforms established methods with regard to intrasample comparison while performing equivalent with regard to intersample normalization using the same normalized data. These combined properties enhance the general usefulness of RNA-seq but also the comparability to the many array-based gene expression data in the public domain.

Keywords: Colorectal Cancer; DESeq2; GeTMM; Normalization methods; RNA sequencing; TPM; edgeR.


Conflict of interest statement

Ethics approval and consent to participate

All patients gave written informed consent for the collection and use of both clinical data and tumor tissue (Institutional Review Board Erasmus MC University Medical Center; MEC-2007-088).

Consent for publication

Not applicable.

Competing interests

The authors declare that they have no competing interests.

Figures

Fig. 1
Fig. 1
normalization using GeTMM method with n = number of genes and i = given gene i
Fig. 2
Fig. 2
Density plot by normalization method. Each line corresponds to the distribution of expression levels in a sample. X-axis shows log2 of read counts. a-f respectively show the distribution without normalization, and normalization according to several methods, as indicated
Fig. 3
Fig. 3
Correlation and RMSE to RT-qPCR data of 30 genes. a Correlation coefficients (x-axis) and b RMSE (x-axis) of 30 genes comparing RNA-seq normalization methods to RT-qPCR generated data
Fig. 4
Fig. 4
Boxplots of read counts per exon. a shows the expression levels in read counts per 100 bp for each exon in CDK1 (NB no additional normalization was performed). The whiskers extend to 1.5 IQR (interquartile range) above the third, or below the first quartile, with the median indicated by a horizontal line in the box. The notch indicates the 95% confidence interval of the median. b shows the same data for the MKI67 gene
Fig. 5
Fig. 5
Violin plots of rank correlation by method. Spearman rank correlation coefficients of 263 samples by correlating each method with RT-qPCR generated data
Fig. 6
Fig. 6
Bland-Altman plots comparing samples with high and low RIN values. a-d: for each normalization method, a group of 76 samples with low RIN values (< 7) was used to correlate expression data of 30 genes to RT-qPCR generated data. The same was performed for an equally sized high RIN sample group (> 9) and the correlation coefficients were compared. X-axis shows the mean correlation, the y-axis the difference (high RIN – low RIN). The blue line indicates the bias (mean of all differences), the dashed light-blue lines show the 95% limits of agreement, the dashed black line at zero is the identity line (indicating no difference). The p-value is derived from a one-sample t-test
Fig. 7
Fig. 7
Number of DE genes between left and right sided tumors per normalization method. RT-qPCR generated data were used as benchmark, showing 8 genes with FDR < 0.05 (dark-grey) and 22 genes FDR > 0.05 (black). For the RNA-seq normalization methods, black indicate true negatives (FDR > 0.05, matches with RT-qPCR), white indicate false positives (FDR < 0.05, not matching RT-qPCR), grey indicate true positives (FDR < 0.05, matches RT-qPCR) and light-grey indicate false negatives (FDR > 0.05, not matching RT-qPCR)
Fig. 8
Fig. 8
Violin plots of the recurrence score. The Oncotype DX ® Recurrence Score (RS) of 263 samples by method

References

    1. Mortazavi A, Williams BA, McCue K, Schaeffer L, Wold B. Mapping and quantifying mammalian transcriptomes by RNA-Seq. Nat Methods. 2008;5:621–628. doi: 10.1038/nmeth.1226. - DOI - PubMed
    1. Robinson MD, Oshlack A. A scaling normalization method for differential expression analysis of RNA-seq data. Genome Biol. 2010;11:R25. doi: 10.1186/gb-2010-11-3-r25. - DOI - PMC - PubMed
    1. Anders S, Huber W. Differential expression analysis for sequence count data. Genome Biol. 2010;11:R106. doi: 10.1186/gb-2010-11-10-r106. - DOI - PMC - PubMed
    1. Love MI, Huber W, Anders S. Moderated estimation of fold change and dispersion for RNA-seq data with DESeq2. Genome Biol. 2014;15:550. doi: 10.1186/s13059-014-0550-8. - DOI - PMC - PubMed
    1. Bullard JH, Purdom E, Hansen KD, Dudoit S. Evaluation of statistical methods for normalization and differential expression in mRNA-Seq experiments. BMC Bioinformatics. 2010;11:94. doi: 10.1186/1471-2105-11-94. - DOI - PMC - PubMed

Publication types