

Naringin ameliorates the high glucose-induced rat mesangial cell inflammatory reaction by modulating the NLRP3 Inflammasome
- PMID: 29929501
- PMCID: PMC6014005
- DOI: 10.1186/s12906-018-2257-y
Naringin ameliorates the high glucose-induced rat mesangial cell inflammatory reaction by modulating the NLRP3 Inflammasome
Abstract
Background: The Nucleotide binding and oligomerization domain-like receptorfamily pyrin domain-containing 3 (NLRP3)-inflammasome plays an important role in various diseases, including a variety of kidney diseases. Naringin exhibits anti-inflammatory and anti-oxidation effects among others, but its specific mechanisms are not clear. We investigated the expression of the NLRP3-inflammasome under high-glucose conditions, assessed the effects of naringin on that process, and further elucidated the role of naringin in the pathogenesis of diabetic kidney disease(DKD).
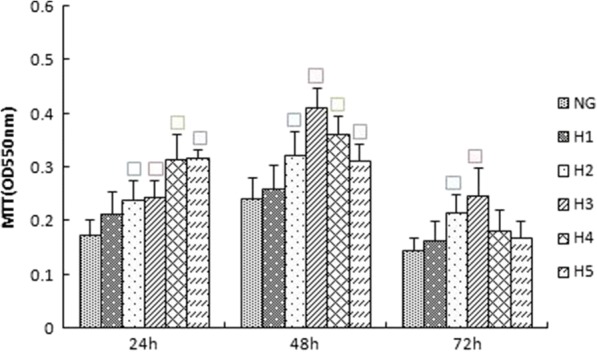
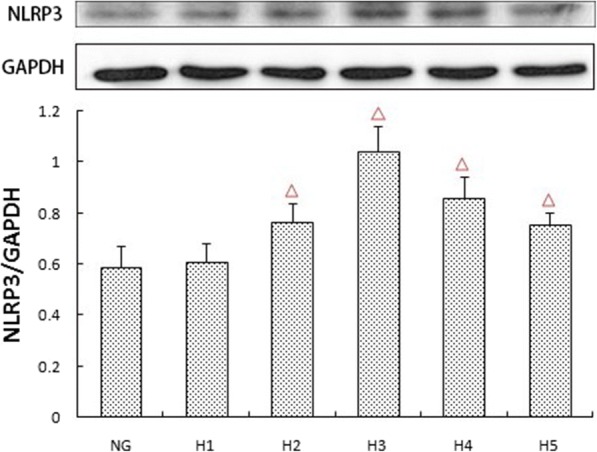
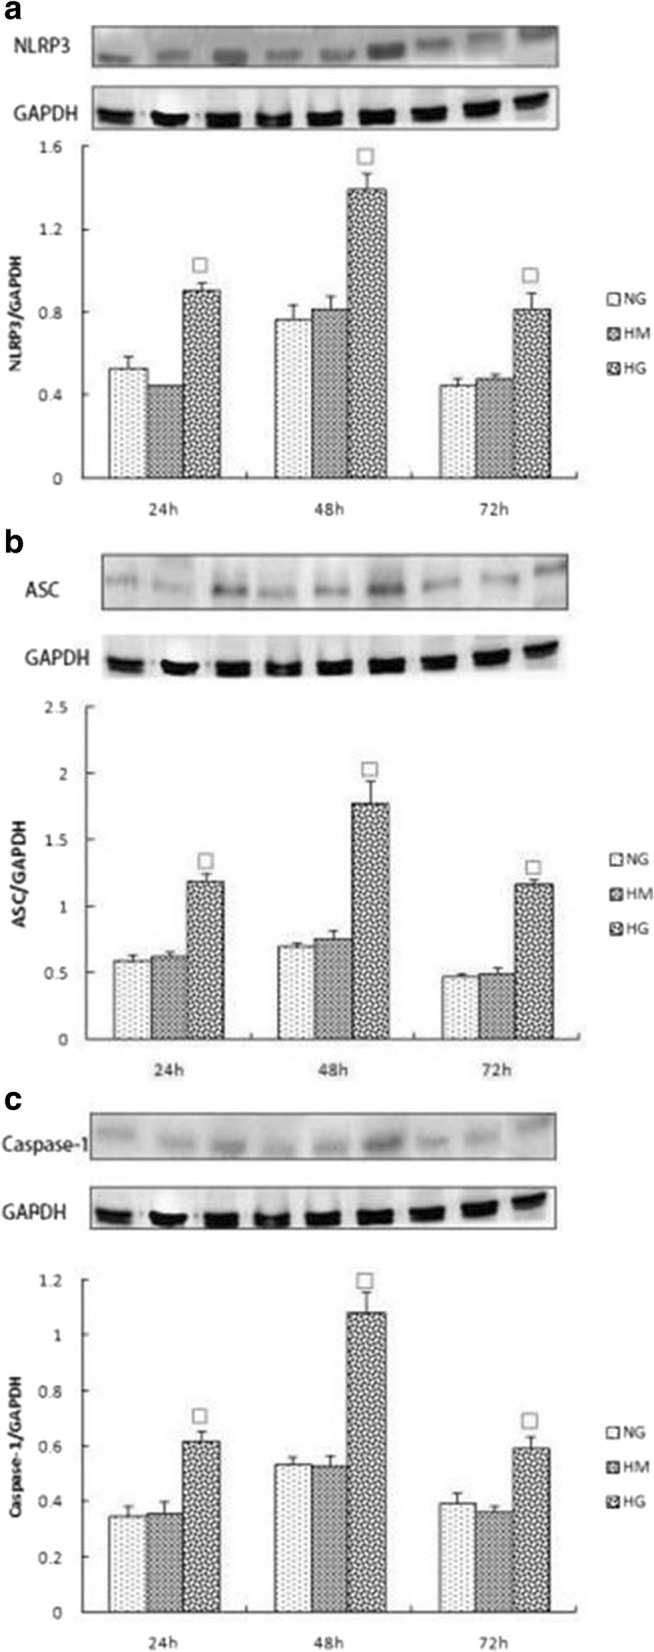
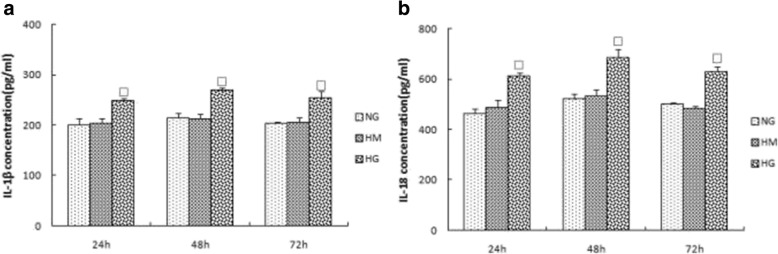
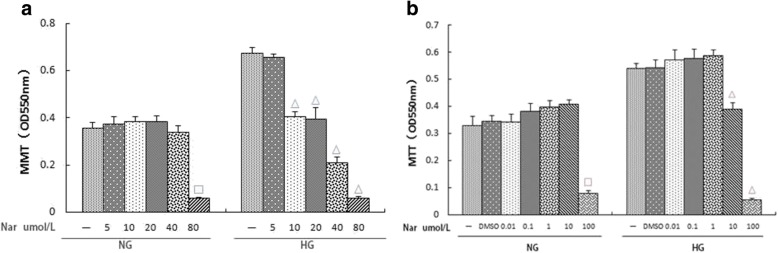
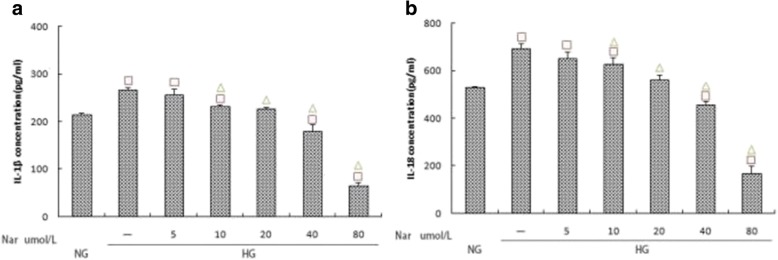
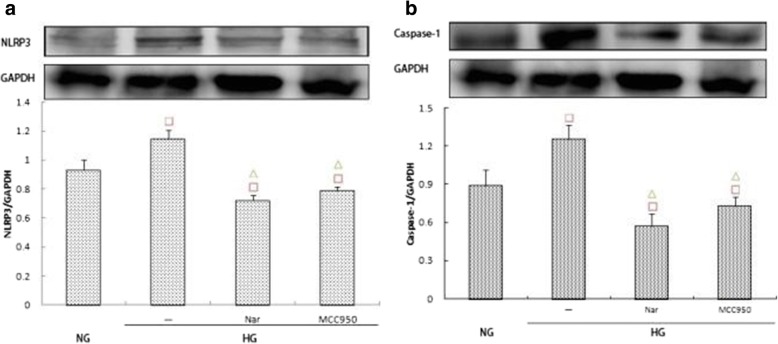
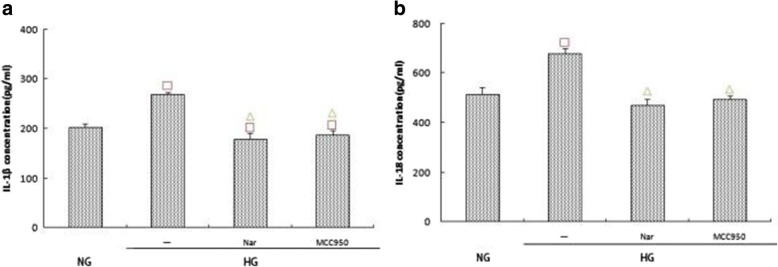
Methods: To assess the therapeutic potential of naringin and the mechanisms involved, we cultured rat glomerular mesangial cells and grouped them according to different glucose concentrations, different action times, different concentrations of MCC950, and different concentrations of naringin.The cell proliferation was measured by MTT assay. The expression of Interleukin-1β(IL-1β) and Interleukin18 (IL-18) in the cell supernatant were detected by ELISA. The expression and activity of NLPR3, apoptosis-associated speck-like protein containing a caspase recruitment domain (ASC) and Caspase-1 were detected by Western Blot.
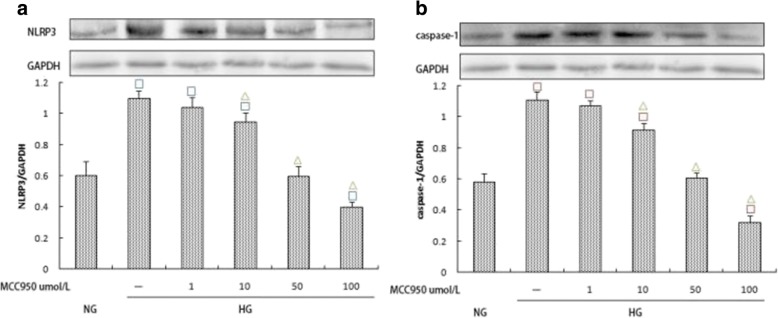
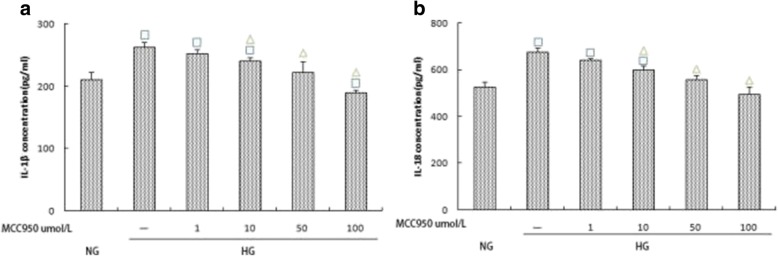
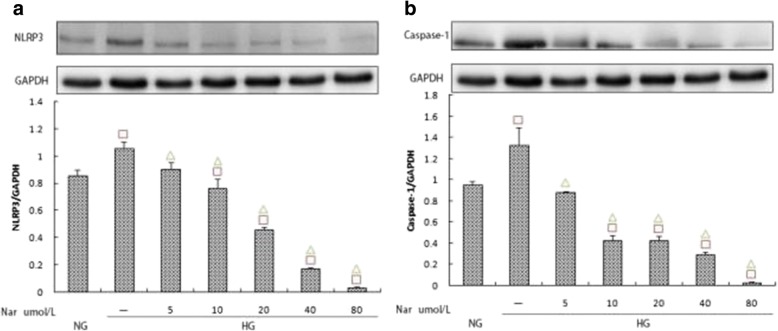
Results: The expressions of NLRP3, ASC, caspase-1, IL-1β, and IL-18 in rat glomerular mesangial cells were significantly higher in the high glucose (HG) group than in the control normal glucose (NG) group and exhibited time-dependence activity. The expression levels of NLRP3, caspase-1, IL-1β, and IL-18 in different treatment groups were significantly lower compared with the HG group after 48 h of MCC950 pre-treatment (p < 0.05). Pre-treatment with naringin produced the same results. Naringin also inhibited the proliferation of cells.
Conclusions: The NLRP3-inflammasome potentially plays a role in the process of activation and inflammation of glomerular mesangial cells as induced by high-glucose conditions. Naringin inhibited the proliferation of cells that were induced by high glucose. Further, it reduced the expression of inflammatory factors that are mediated by NLRP3 through the NLRP3-caspase-1-IL-1β/IL-18 signaling pathway, which makes naringin a potentially novel treatment for DKD disease.
Keywords: Diabetes mellitus; Diabetic kidney disease; NLRP3 inflammasome; NLRP3-caspase-1-IL-1β/IL-18 signaling pathway; Naringin.
Conflict of interest statement
Ethics approval and consent to participate
Not applicable.
Consent for publication
Not applicable.
Competing interests
The authors declare that they have no competing interests.
Publisher’s Note
Springer Nature remains neutral with regard to jurisdictional claims in published maps and institutional affiliations.
Figures
Similar articles
-
Hydrogen-Rich Saline Attenuated Subarachnoid Hemorrhage-Induced Early Brain Injury in Rats by Suppressing Inflammatory Response: Possible Involvement of NF-κB Pathway and NLRP3 Inflammasome.Mol Neurobiol. 2016 Jul;53(5):3462-3476. doi: 10.1007/s12035-015-9242-y. Epub 2015 Jun 20. Mol Neurobiol. 2016. PMID: 26091790
-
Liquiritigenin attenuates high glucose-induced mesangial matrix accumulation, oxidative stress, and inflammation by suppression of the NF-κB and NLRP3 inflammasome pathways.Biomed Pharmacother. 2018 Oct;106:976-982. doi: 10.1016/j.biopha.2018.07.045. Epub 2018 Jul 14. Biomed Pharmacother. 2018. PMID: 30119269
-
Salidroside alleviates high glucose-induced oxidative stress and extracellular matrix accumulation in rat glomerular mesangial cells by the TXNIP-NLRP3 inflammasome pathway.Chem Biol Interact. 2017 Dec 25;278:48-53. doi: 10.1016/j.cbi.2017.10.012. Epub 2017 Oct 12. Chem Biol Interact. 2017. PMID: 29031534
-
Negative regulators and their mechanisms in NLRP3 inflammasome activation and signaling.Immunol Cell Biol. 2017 Aug;95(7):584-592. doi: 10.1038/icb.2017.23. Epub 2017 Mar 30. Immunol Cell Biol. 2017. PMID: 28356568 Review.
-
[Advances in mechanisms for NLRP3 inflammasomes regulation].Yao Xue Xue Bao. 2016 Oct;51(10):1505-12. Yao Xue Xue Bao. 2016. PMID: 29924571 Review. Chinese.
Cited by
-
Beneficial effects of flavonoids on cardiovascular diseases by influencing NLRP3 inflammasome.Inflammopharmacology. 2023 Aug;31(4):1715-1729. doi: 10.1007/s10787-023-01249-2. Epub 2023 Jun 1. Inflammopharmacology. 2023. PMID: 37261627 Review.
-
Potential therapeutic use of plant flavonoids in AD and PD.Heliyon. 2022 Nov 7;8(11):e11440. doi: 10.1016/j.heliyon.2022.e11440. eCollection 2022 Nov. Heliyon. 2022. PMID: 36387565 Free PMC article. Review.
-
The immune-inflammation factor is associated with diabetic nephropathy: evidence from NHANES 2013-2018 and GEO database.Sci Rep. 2024 Aug 1;14(1):17760. doi: 10.1038/s41598-024-68347-1. Sci Rep. 2024. PMID: 39085362 Free PMC article.
-
Protective effect of yacon leaves extract (Smallanthus sonchifolius (Poepp.) H. Rob) through antifibrosis, anti-inflammatory, and antioxidant mechanisms toward diabetic nephropathy.Res Pharm Sci. 2023 Mar 10;18(3):336-345. doi: 10.4103/1735-5362.371589. eCollection 2023 May-Jun. Res Pharm Sci. 2023. PMID: 37593160 Free PMC article.
-
Targeting programmed cell death in diabetic kidney disease: from molecular mechanisms to pharmacotherapy.Mol Med. 2024 Dec 20;30(1):265. doi: 10.1186/s10020-024-01020-5. Mol Med. 2024. PMID: 39707216 Free PMC article. Review.
References
MeSH terms
Substances
Grants and funding
LinkOut - more resources
Full Text Sources
Other Literature Sources
Miscellaneous
