. 2018 Jul 27;361(6400):eaat5691.
doi: 10.1126/science.aat5691. Epub 2018 Jun 21.

Three-dimensional intact-tissue sequencing of single-cell transcriptional states

Affiliations

Three-dimensional intact-tissue sequencing of single-cell transcriptional states

Xiao Wang et al. Science. .

Abstract

Retrieving high-content gene-expression information while retaining three-dimensional (3D) positional anatomy at cellular resolution has been difficult, limiting integrative understanding of structure and function in complex biological tissues. We developed and applied a technology for 3D intact-tissue RNA sequencing, termed STARmap (spatially-resolved transcript amplicon readout mapping), which integrates hydrogel-tissue chemistry, targeted signal amplification, and in situ sequencing. The capabilities of STARmap were tested by mapping 160 to 1020 genes simultaneously in sections of mouse brain at single-cell resolution with high efficiency, accuracy, and reproducibility. Moving to thick tissue blocks, we observed a molecularly defined gradient distribution of excitatory-neuron subtypes across cubic millimeter-scale volumes (>30,000 cells) and a short-range 3D self-clustering in many inhibitory-neuron subtypes that could be identified and described with 3D STARmap.


Conflict of interest statement

Competing interests: The design, steps, and applications of STARmap are covered in pending patent application material from Stanford University; all methods, protocols, and sequences are freely available to nonprofit institutions and investigators.

Figures

Fig. 1.
Fig. 1.. STARmap principles: in situ RNA sequencing for spatial transcriptomics within the 3D tissue environment.
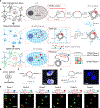
(A) STARmap overview schematic. After brain tissue is prepared (mouse brain protocols are available in the supplementary materials, materials and methods), the custom SNAIL probes that encounter and hybridize to intracellular mRNAs (dashed lines) within the intact tissue are enzymatically replicated as cDNA amplicons. The amplicons are constructed in situ with an acrylic acid N-hydroxysuccinimide moiety modification (blue) and then copolymerized with acrylamide to embed within a hydrogel network (blue wavy lines), followed by clearance of unbound lipids and proteins (fig. S2). Each SNAIL probe contains a gene-specific identifier segment (red) that is read-out through in situ sequencing with two-base encoding for error correction (SEDAL) (fig. S3). Last, highly multiplexed RNA quantification in three dimensions reveals gene expression and cell types in space. (B) SNAIL logic. A pair of primer and padlock probes amplifies target-specific signals and excludes noise known to commonly arise from nonspecific hybridization of a single probe. (C and D) Only adjacent binding of primer and padlock probes leads to signal amplification. mRNA A represents Gapdh, and mRNA B represents Actb. Both fluorescent images show Gapdh (gray) mRNA and cell nuclei (blue) labeling in mouse brain slice; there is an absence of labeling with mismatched primer and padlock (right). Scale bar, 10 µm. (E) In situ sequencing of DNA amplicons in the tissue-hydrogel complex via SEDAL, the sequencing-by-ligation method devised for STARmap. For each cycle, the reading probes (gray line without star-symbol label) contain an incrementally increasing-length run of degenerate bases (N representing an equal mixture of A, T, C, and G) with phosphate at the 5′ end (5′P) to set the reading position; the decoding probes (gray line with star-symbol label) are labeled by fluorophores with color coding for the dinucleotide at the 3′ end. Only if both probes are perfectly complementary to the DNA template (black lower sequence) can the two kinds of probes then be ligated to form a stable product with a high melting temperature, allowing later imaging after unligated probes are washed away. After each imaging cycle, probes are stripped away from the robust tissue-hydrogel by using 60% formamide so that the next cycle can begin. X, unknown base to be read; red underline, decoded sequence; Ch1 to Ch4, fluorescence channels. Scale bar, 2 µm.
Fig. 2.
Fig. 2.. STARmapping cell types in V1.
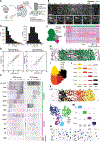
(A) Experimental design. Mice were dark housed, before sacrifice, for 4 days and then either kept in the dark or exposed to light for 1 hour. V1 was coronally sectioned, and RNAs of 112 cell type markers and 48 activity-regulated genes were quantified by means of STARmap. (B) Raw fluorescence images of in-process STARmap with the full view of cycle 1 (top) and zoomed views across all six cycles (bottom). Full field: 1.4 by 0.3 mm, scale bar, 100 µm; zoomed region: 11.78 by 11.78 µm, scale bar, 2 µm; Channel, color code for the four fluorescence channels; L1 to L6, the six neocortical layers; cc, corpus callosum; HPC, hippocampus. (C) Histograms. Shown are detected reads (DNA amplicons) per cell (left), and genes per cell (right). (D) Quantitative reproducibility of biological replicates, whether in the light or dark condition: log2 (amplicon quantity) for 160 genes across the whole imaging region plotted. Rep1, expression value in first replicate; rep2, expression value in second replicate. (E) Validation of STARmap. (Left) in situ images from Allen Institute of Brain Science (AIBS). (Right) RNA pattern of individual genes extracted from 160-gene STARmap, which reliably reproduced the spatial gene expression pattern from AIBS. (F) Uniform manifold approximation plot (UMAP), a nonlinear dimensionality reduction technique used to visualize the similarity of cell transcriptomes in two dimensions, showing consistent clustering of major cell types across 3142 cells pooled from four biological replicates:2199 excitatory neurons, 324 inhibitory neurons, and 619 non-neuronal cells. (G) Gene expression heatmap for 112 cell-type markers aligned with each cell cluster, showing clustering by inhibitory, excitatory, or non-neuronal cell types. Expression for each gene is z-scored across all genes in each cell. (H) Representative cell-resolved spatial map in neocortex and beyond. Cell types are color-coded as in (F). (I to N) Clustering of excitatory and inhibitory subtypes. [(I) and (L)] UMAP plots, [(J) and (M)] bar plots of representative genes (mean ± 95% confidence interval expression across all cells in that cluster, with each bar scaled to the maximum mean expression across all clusters), and [(K) and (N)] in situ spatial distribution of [(I) to (K)] excitatory and [(L) to (N)] inhibitory neurons. The number of cells in each cluster was as follows: eL2/3, 589; eL4, 649; eL5, 393; eL6, 368; PV neurons, 111; VIP neurons, 46; SST neurons, 46; and NPY neurons, 56. Inclusion of cells in clusters was guided entirely by amplicon representation in each cell without using spatial information; excitatory cell clusters were then named according to the spatial layering observed for that cluster, whereas inhibitory cell clusters were named according to the dominant cell-type amplicon based on the strong segregation of amplicon markers.
Fig. 3.
Fig. 3.. STARmapping behavioral experience: Detecting and quantifying cell type–specific regulation of ARGs.
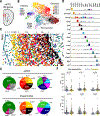
(A) Validation. Shown is spatial expression pattern in the visual cortex of prototypical ARGs known as immediate early genes. Sacrifice was in darkness or after 1 hour of light exposure. (B and C) Volcano plots of log fold-change in gene expression between light and dark conditions in inhibitory and excitatory cell types. Genes with significantly increased or decreased expression (false discovery rate–adjusted P < 0.05, Wilcoxon rank-sum test) are labeled in green, and the most significantly changed genes (P < 0.05 and fold change > 2) are labeled in red. Many ARGs showed cell-type specificity, pointing to discovery of unanticipated cell type–specific logic of excitation-transcription coupling. (D) Violin plot of Egr2 expression by cell type. ****P < 0.0001, n.s. not significant, Wilcoxon rank-sum test; red-labeled cell types, fold change >2.
Fig. 4.
Fig. 4.. STARmapping cell types and neural activity in mPFC.
(A) Diagram of targeted region (red box) containing primarily prelimbic cortex (PrL) within mPFC. (B) UMAP visualization of all inhibitory (VIP, Reln, SST, Lhx6, and NPY), excitatory (eL2/3, eL5–1, eL5–2, eL5–3, eL6–1, and eL6–2), and non-neuronal (Astro, Oligo, Smc, and Endo) cell types. (C) Spatial visualization of cell type layout in mPFC, using the same color scheme as in (B). (D) Barplot of representative genes per cluster (mean ± 95% confidence interval), with each bar scaled to the maximum mean expression for that gene across clusters. (E) Piecharts showing the relative proportion of each major and minor cell type in both mPFC and visual cortex. (F) Violin plots of Fos gene induction in different excitatory cell types in mPFC in response to cocaine. The mice were sacrificed after 1 hour of cocaine or saline injection. Expr, normalized expression; n.s., not significant; *P < 0.05, ***P < 0.001, ****P < 0.0001, likelihood ratio test. Astro, astrocytes; Oligo, oligodendrocytes; Smc, smooth muscle cells; Endo, endothelial cells.
Fig. 5.
Fig. 5.. Simultaneous mapping of 1020 genes in V1 by STARmap.
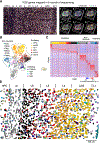
(A) Input fluorescence data. (Left) Maximum-intensity projection of the first sequencing round for 1020 gene experiment, showing all four channels simultaneously. Yellow square, zoom region. Scale bar, 100 µm. (Right) Zoom into a single cell showing spatial arrangement of amplicons in three dimensions across six sequencing rounds. (B) Joint UMAP plot showing all excitatory (HPC, eL2/3, eL4, eL5, eL6–1, and eL6–2), non-neuronal (Smc, Other, Olig, Micro, Endo, and Astro), and inhibitory (PVALB, SST, VIP, and NPY) cell types. (C) Plot of all differentially expressed genes across every cluster, with P < 10−12 and log fold change > 1.5. (D) Spatial map of all excitatory, non-neuronal, and inhibitory cell types in visual cortex using the same color code of (B). HPC, hippocampus; Smc, smooth muscle cells; Other, other unclassified cells; Oligo, oligodendrocytes; Micro, microglia; Endo, endothelia cells; Astro, astrocytes.
Fig. 6.
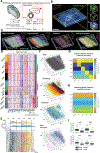
Fig. 6.. 3D architecture of cell types in visual cortex volumes.
(A) Volumetric STARmapping via sequential SEDAL gene readout. Using a modified STARmap procedure (fig. S16) and cyclic gene readout (four genes in each cycle), large tissue volumes can be rapidly mapped at single-cell resolution without oversampling each amplicon. (B) Validation showing specific STARMAP labeling of YFP-expressing neurons (from transgenic Thy1::YFP mouse line) in 3D cortical volume. Scale bar, 0.5 mm. (C) Representative labeling of (left) major cell types, (left center) layer-specific markers, (right center) inhibitory markers, and (right) activity-regulated genes acquired over multiple rounds in visual cortex STARmap volumes. (D) Per-cell expression matrix of 28 genes from 32,845 single cells from one volume clustered into multiple excitatory, inhibitory, and non-neuronal cell types, z-scored across genes for each cell in order to normalize for mean differences in total signal between cells. Columns are sorted by order of sequencing rounds as conducted, in groups of four. (E) (Top) Spatial histograms of excitatory, inhibitory, and non-neuronal cell types, using same color labels as (D). Cells were counted in 5-µm bins in a 2D max-projection and plotted in cell-count-per-micrometer units as a function of distance from the corpus callosum (cc) to the pia, averaged across the bins perpendicular to the cortical layers. (Bottom) Plot of max-projected cell locations color-coded by cluster as in (D). (F) Spatial distribution of each cell type (excitatory, inhibitory, and non-neuronal) and subtypes in three dimensions. Each dot represents a single cell; spatial dimensions are in micrometers. (G) Average nearest-neighbor distances computed in three dimensions between all excitatory cells (Excite) and each inhibitory cell type. For self-comparisons, the nearest neighbor was defined as the closest nonidentical cell; persistent self-correlation reveals self-clustering of inhibitory subtypes. (H) Same distances as (H) but using shuffled (randomized) cell-type labels. (I) Nearest-neighbor distances computed in three dimensions between each inhibitory cell of a certain type and any member of the same type (Inhib → Inhib, eg VIP → VIP) or any excitatory neuron (Inhib → Excite). **** P < 0.0001, Wilcoxon rank-sum test.

Comment in

References

    1. Crosetto N, Bienko M, van Oudenaarden A, Spatially resolved transcriptomics and beyond. Nat. Rev. Genet 16, 57–66 (2015). doi: 10.1038/nrg3832; - DOI - PubMed
    1. Lein E, Borm LE, Linnarsson S, The promise of spatial transcriptomics for neuroscience in the era of molecular cell typing. Science 358, 64–69 (2017). doi: 10.1126/science.aan6827; - DOI - PubMed
    1. Lubeck E, Cai L, Single-cell systems biology by super-resolution imaging and combinatorial labeling. Nat. Methods 9, 743–748 (2012). doi: 10.1038/nmeth.2069; - DOI - PMC - PubMed
    1. Chen KH, Boettiger AN, Moffitt JR, Wang S, Zhuang X, RNA imaging. Spatially resolved, highly multiplexed RNA profiling in single cells. Science 348, aaa6090 (2015). doi: 10.1126/science.aaa6090; - DOI - PMC - PubMed
    1. Shah S, Lubeck E, Zhou W, Cai L, In situ transcription profiling of single cells reveals spatial organization of cells in the mouse hippocampus. Neuron 92, 342–357 (2016). doi: 10.1016/j.neuron.2016.10.001; - DOI - PMC - PubMed

Publication types