. 2018 Jul 27;361(6400):eaar2555.
doi: 10.1126/science.aar2555. Epub 2018 Jun 21.

Imaging dynamic and selective low-complexity domain interactions that control gene transcription

Affiliations

Imaging dynamic and selective low-complexity domain interactions that control gene transcription

Shasha Chong et al. Science. .

Abstract

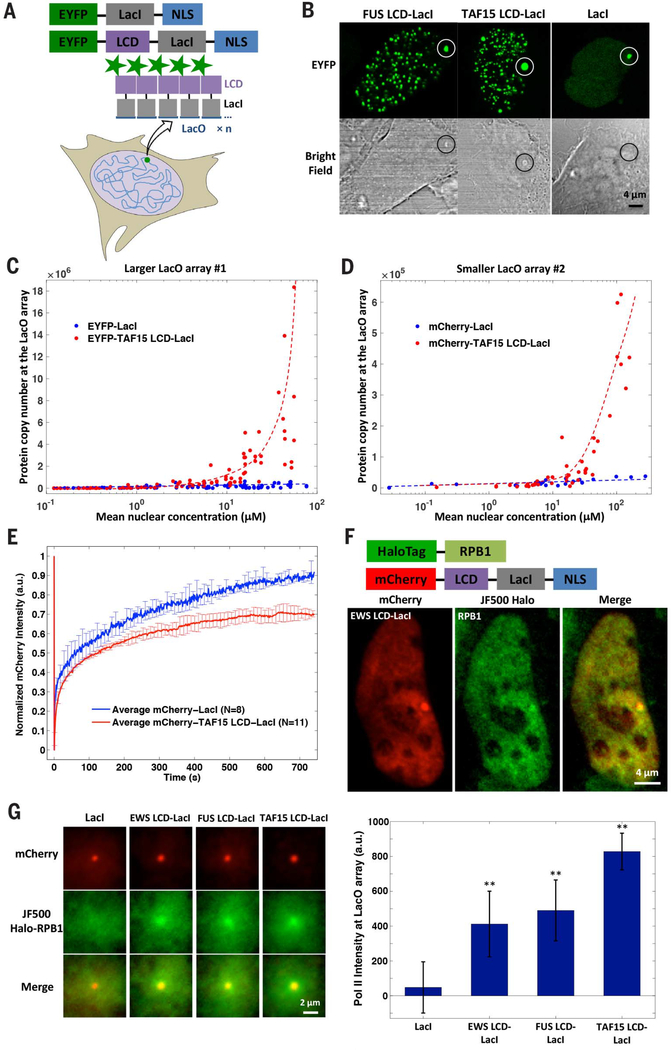
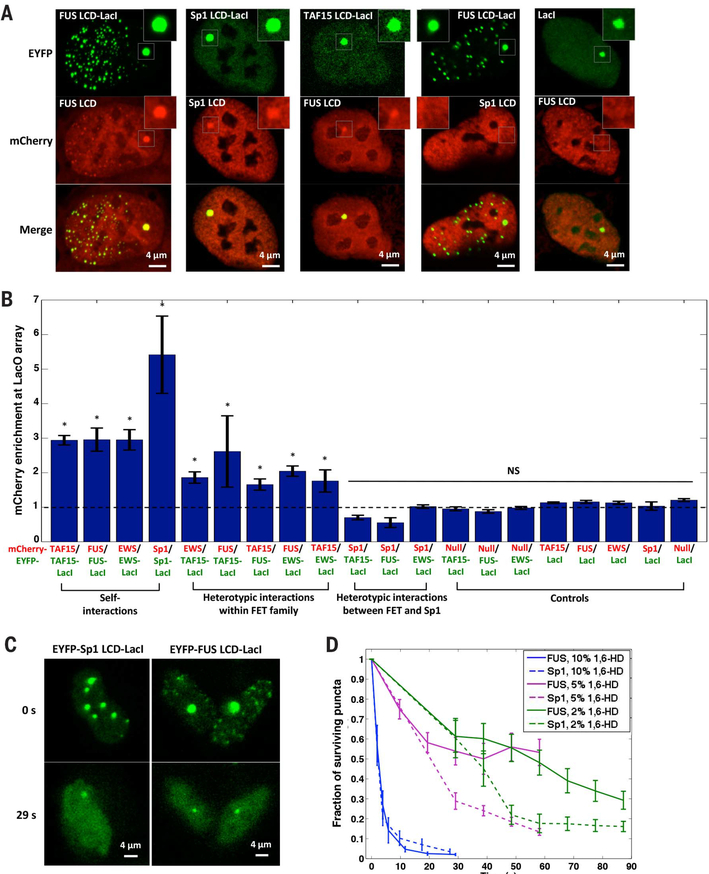
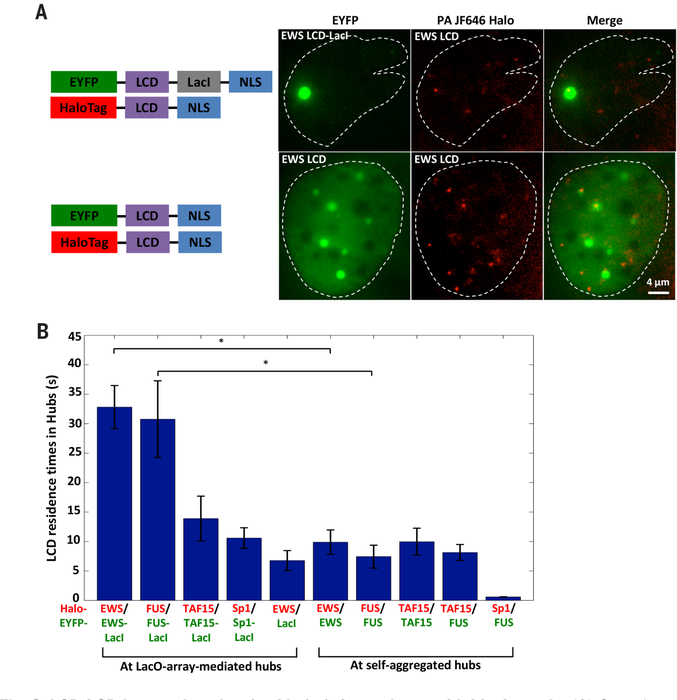
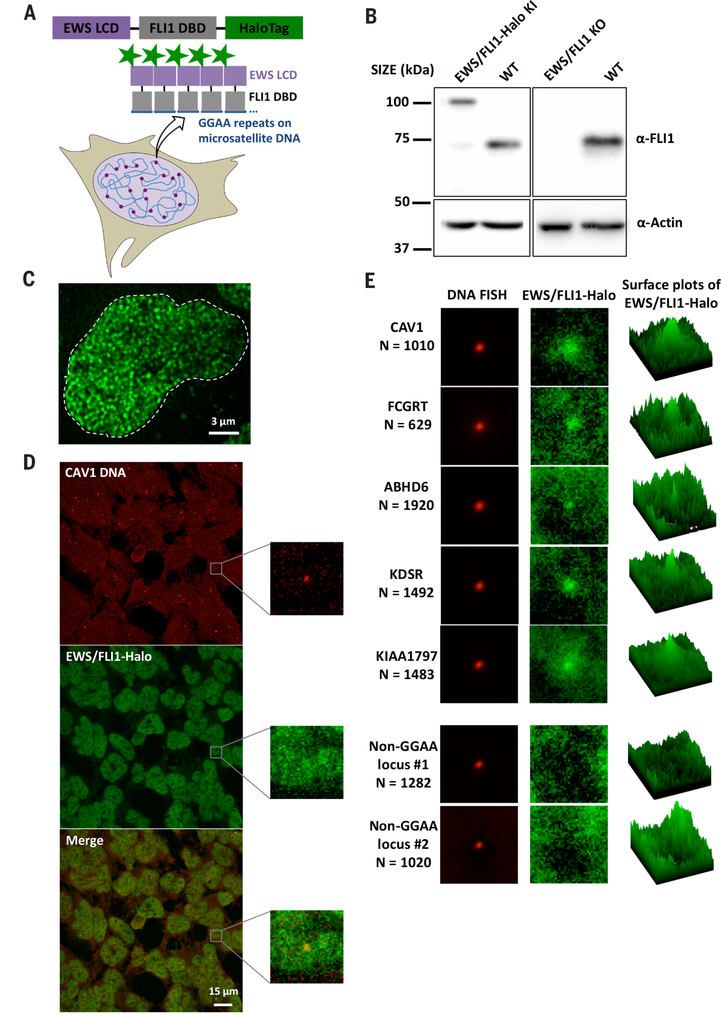
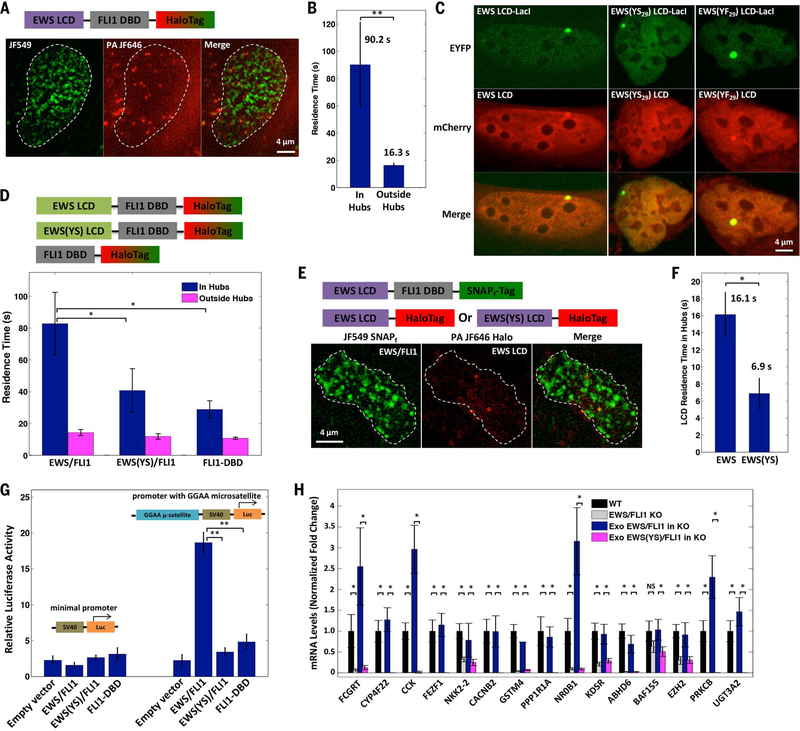
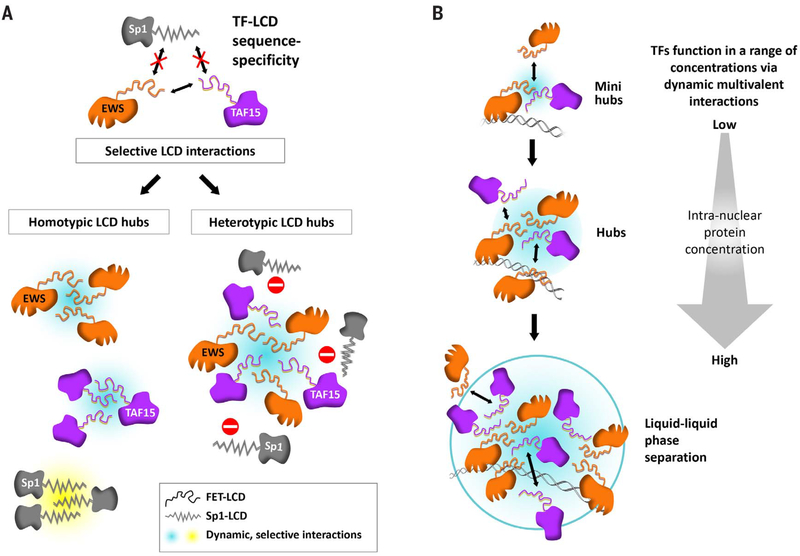
Many eukaryotic transcription factors (TFs) contain intrinsically disordered low-complexity sequence domains (LCDs), but how these LCDs drive transactivation remains unclear. We used live-cell single-molecule imaging to reveal that TF LCDs form local high-concentration interaction hubs at synthetic and endogenous genomic loci. TF LCD hubs stabilize DNA binding, recruit RNA polymerase II (RNA Pol II), and activate transcription. LCD-LCD interactions within hubs are highly dynamic, display selectivity with binding partners, and are differentially sensitive to disruption by hexanediols. Under physiological conditions, rapid and reversible LCD-LCD interactions occur between TFs and the RNA Pol II machinery without detectable phase separation. Our findings reveal fundamental mechanisms underpinning transcriptional control and suggest a framework for developing single-molecule imaging screens for drugs targeting gene regulatory interactions implicated in disease.


Conflict of interest statement

Competing interests: L.L. has filed a patent and patent applications (e.g., U.S. Patent 9,933,417) covering azetidine-containing fluorophores such as JF549.

Figures

Fig. 1.
Fig. 1.. A LacO array can mediate the formation of an LCD hub in live cells, which involves extensive LCD self-interaction and recruits RNA Pol II.
(A) Schematic for a LacO array (n ≈ 50,000 repeats for array 1, n ≈ 15,000 repeats for array 2) in the U20S genome nucleating an LCD hub when EYFP-LCD-LacI is transiently expressed. Alternatively, EYFP-LacI is expressed as a control. NLS, nuclear localization signal. (B) Confocal fluorescence and bright-field images of LacO-containing U20S cells where LacO array 1 (highlighted by circles) is bound by EYFP-labeled LCD-LacI or LacI. LCD-LacI-bound, but not LacI-bound, LacO arrays are visible in bright-field images. (C and D) Copy number of EYFP-labeled (C) or mCherry-labeled (D) TAF15 LCD-LacI (red) or LacI (blue) molecules bound to LacO array 1 (C) or 2 (D) as a function of mean nuclear concentration of the TF. Concentrations were measured by fluorescence intensity comparison. Each dot represents one cell. (E) Averaged FRAP curves at LacO array 1 bound by mCherry-labeled TAF15 LCD-LacI (red) or LacI (blue). Error bars represent SD. a.u., arbitrary units; N, number of cells analyzed. (F) (Top) Schematic of the proteins expressed in the LacO-containing U20S line. (Bottom) Confocal fluorescence images show that Halo-RPB1 (labeled with 200 nM Halo ligand JF500, green) is enriched at LacO array 2 bound by mCherry-EWS LCD-LacI (red). (G) (Left) Averaged Halo-RPB1 images at LacO array 2 bound by mCherry-labeled LacI, EWS LCD-LacI, FUS LCD-LacI, or TAF15 LCD-LacI (N = 55, 69, 81, or 143). (Right) Fluorescence intensity of Halo-RPB1 at the LacO array center in the average images after subtraction of nuclear Halo-RPB1 background (see supplementary methods). ** denotes a statistically significant increase compared with the LacI condition (P < 0.01, two-sample t test). Error bars represent bootstrapped SD (45).
Fig. 2.
Fig. 2.. LCD hub formation involves selective protein-protein interactions, which can be disrupted by 1,6-HD with sequence-dependent sensitivity.
(A) Confocal fluorescence images of U2OS cells containing LacO array 1 that coexpress various combinations of mCherry-LCD and EYFP-LCD-LacI. The region surrounding the LacO array is zoomed in. (B) Quantification of the enrichment of mCherry-LCD (red) at the LacO array 1 bound by various EYFP-labeled LCD-LacI fusion proteins (green), calculated as the peak mCherry fluorescence intensity at the array divided by the average intensity immediately surrounding the array (fig. S5A). Null, mCherry not fused to any LCD. An mCherry enrichment at the array above 1 suggests LCD-LCD interactions. * denotes a statistically significant difference above 1 (P < 0.05, one-sample t test). NS, nonsignificant difference above 1. Error bars represent SE. (C) Fluorescence images of FUS and Sp1 LCD hubs before (0 s) and after (29 s) addition of 10% 1,6-HD. (D) Number of nuclear puncta formed by FUS or Sp1 LCD surviving over time upon addition of 1,6-HD at different concentrations. Error bars represent SE.
Fig. 3.
Fig. 3.. LCD-LCD interactions involved in hub formation are highly dynamic.
(A) Snapshots of a two-color SPT movie simultaneously imaging EYFP-labeled (green) EWS LCD-LacI (top, forming a LacO-associated LCD hub) or EWS LCD (bottom, forming self-aggregated LCD hubs not affiliated with the LacO array) and Halo-tagged EWS LCD (2 nM PA-JF646 labeled, red) in U2OS cells containing LacO array 1. A white dashed contour outlines the cell nucleus. We imaged the hubs in the EYFP channel (green) and tracked individual Halo-EWS LCD molecules with an acquisition time of 500 ms in the PA-JF646 channel (red). (B) Residence times of LCD (red) bound at the LacO-array-associated LCD hub or at self-aggregated LCD hubs not affiliated with the array (green). *P < 0.05, two-sample t test. Error bars represent SE.
Fig. 4.
Fig. 4.. Combined DNA FISH and EWS/FLI1-Halo imaging show that endogenous EWS/FLI1 forms hubs at GGAA microsatellites.
(A) Schematic for GGAA microsatellites in the A673 genome nucleating hubs of endogenously Halo-tagged EWS/FLI1. (B) Western blot of EWS/FLI1 and β-actin (normalization control) from clonal EWS/FLI1-Halo knock-in (KI), WT and clonal EWS/FLI1 knockout (KO) A673 lines. (C) z-projected 3D image of endogenous EWS/FLI1-Halo in an A673 cell nucleus (stained with 200 nM Halo ligand JF549) taken on the lattice light-sheet microscope. (D) Confocal fluorescence images of 3D DNA FISH targeting GGAA microsatellite-adjacent CAV1 gene (enhanced Cy5 labeled, red) and endogenous EWS/FLI1-Halo (JF549 labeled, green). The zoomed-in views depict the region surrounding one particular CAV1 locus. EWS/FLI1-Halo enrichment at the locus is visible but buried in high background. (E) Averaged two-color images of five GGAA microsatellite-adjacent gene loci (CAV1, FCGRT, ABHD6, KDSR, and KIAA1797) and two gene loci not containing a GGAA microsatellite (Non-GGAA locus 1 targeting ADGRA3 and locus 2 targeting REEP5). The right column shows average surface plots of EWS/FLI1-Halo.
Fig. 5.
Fig. 5.. Dynamic LCD-LCD interactions occur at GGAA microsatellites, which stabilize EWS/FLI1 binding and drive its transactivation function.
(A) Snapshots of an SPT movie imaging endogenous EWS/FLI1-Halo labeled with two Halo ligands, JF549 (200 nM) and PA-JF646 (20 nM). We imaged the EWS/FLI1-Halo hubs in the JF549 channel (green) and tracked individual EWS/FLI1-Halo molecules in and outside the hubs in the PA-JF646 channel (red). (B) Residence times of EWS/FLI1 bound in hubs are longer than its residence times outside hubs, as determined by SPT (**P < 0.01, two-sample t test). Error bars represent SE. (C) EWS LCD is enriched at LacO array 1 bound by EWS LCD-LacI, but EWS(YS29) LCD is not recruited to the array by EWS(YS29) LCD-LacI. However, EWS(YF29) LCD is recruited to the array by EWS(YF29) LCD-LacI. (D) (Top) Schematic of proteins transiently expressed in EWS/FLI1KO A673 cells: Halo-tagged EWS/FLI1, EWS(YS)/FLI1, or FLI1 DBD. (Bottom) Residence times of EWS/FLI1 and its variants binding in and outside their hubs, as determined by SPT. *P < 0.05, two-sample t test. Error bars represent SE. (E) Snapshots of an SPT movie simultaneously imaging SNAPf-tagged EWS/FLI1 (200 nM JF549 labeled, green) and Halo-tagged EWS or EWS(YS) LCD (20 nM PA-JF646 labeled, red) in EWS/FLI1 KO A673 cells. Individual LCD-Halo molecules were tracked with the strategy described in (A). (F) Residence times of EWS bound at EWS/FLI1 hubs are longer than for EWS(YS) LCD, as determined by SPT (*P < 0.05, two-sample t test). Error bars represent SE. (G) Luciferase assay shows that EWS/FLI1 but not EWS(YS)/FLI1 or FLI1 DBD transactivates a GGAA microsatellite-driven reporter (**P < 0.01, two-sample t test). Error bars represent SE. (H) RT-qPCR shows down-regulation of GGAA microsatellite-associated EWS/FLI1 target genes in A673 cells upon EWS/FLI1 KO. Stable expression of exogeneous (Exo) EWS/FLI1, but not of the mutant EWS(YS)/FLI1, rescues the expression defect in EWS/FLI1 KO A673 cells. For each target gene, the mRNA level was normalized using five different invariant genes (fig. S10A) and graphed as a fold change relative to the mRNA level present in the WT A673 line (set to 1). *P < 0.05, two-sample t test. NS, not statistically significant. Error bars represent SD.
Fig. 6.
Fig. 6.. A model for functional LCD-LCD interactions in vivo: From hubs to phase separation.
(A) Dynamic and sequence-specific LCD-LCD interactions drive hub formation in live cells. (B) LCD-dependent transactivation occurs in hubs formed over a broad range of TF concentrations. At endogenous concentrations, TF LCDs form transactivation hubs at native genomic loci without undergoing evident phase separation. Upon TF LCD overexpression, phase separation is observed at synthetic TF binding site arrays.

Comment in

References

    1. Kadonaga JT, Courey AJ, Ladika J, Tjian R, Distinct regions of Sp1 modulate DNA binding and transcriptional activation. Science 242, 1566–1570 (1988). doi: 10.1126/science.3059495 - DOI - PubMed
    1. Courey AJ, Tjian R, Analysis of Sp1 in vivo reveals multiple transcriptional domains, including a novel glutamine-rich activation motif. Cell 55, 887–898 (1988). doi: 10.1016/0092-8674(88)90144-4 - DOI - PubMed
    1. Su W, Jackson S, Tjian R, Echols H, DNA looping between sites for transcriptional activation: Self-association of DNA-bound Sp1. Genes Dev. 5, 820–826 (1991). doi: 10.1101/gad.5.5.820 - DOI - PubMed
    1. Friedman MJ et al., Polyglutamine domain modulates the TBP-TFIIB interaction: Implications for its normal function and neurodegeneration. Nat. Neurosci. 10, 1519–1528 (2007). doi: 10.1038/nn2011 - DOI - PubMed
    1. Kovar H, Jekyll Dr.and Hyde Mr.: The Two Faces of the FUS/EWS/TAF15 Protein Family. Sarcoma 2011, 837474 (2011). doi: 10.1155/2011/837474 - DOI - PMC - PubMed

Publication types