. 2018 Jul 27;361(6400):eaar3958.
doi: 10.1126/science.aar3958. Epub 2018 Jun 21.

Coactivator condensation at super-enhancers links phase separation and gene control

Affiliations

Coactivator condensation at super-enhancers links phase separation and gene control

Benjamin R Sabari et al. Science. .

Abstract

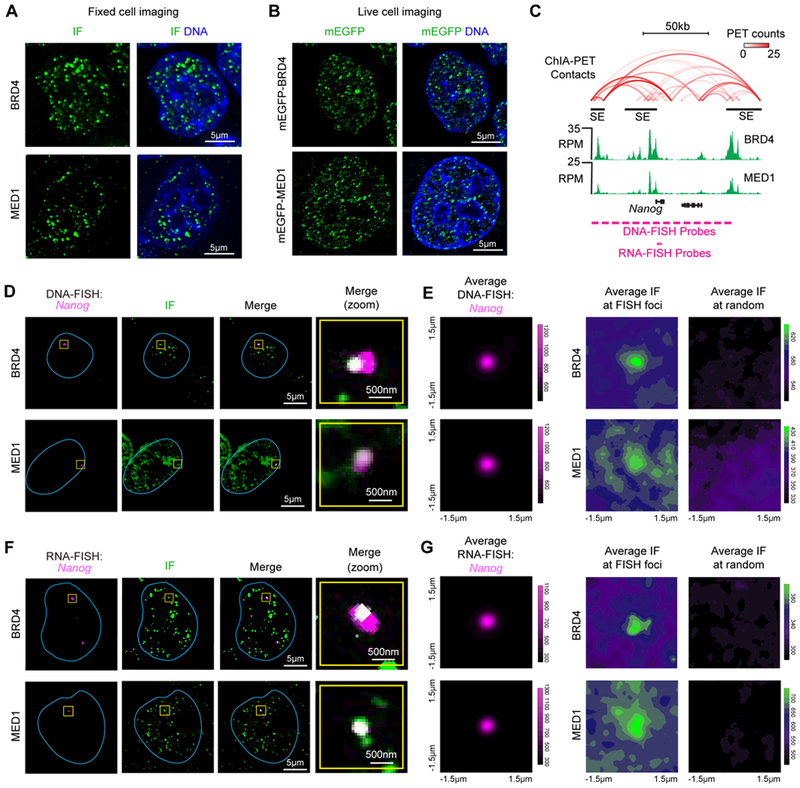
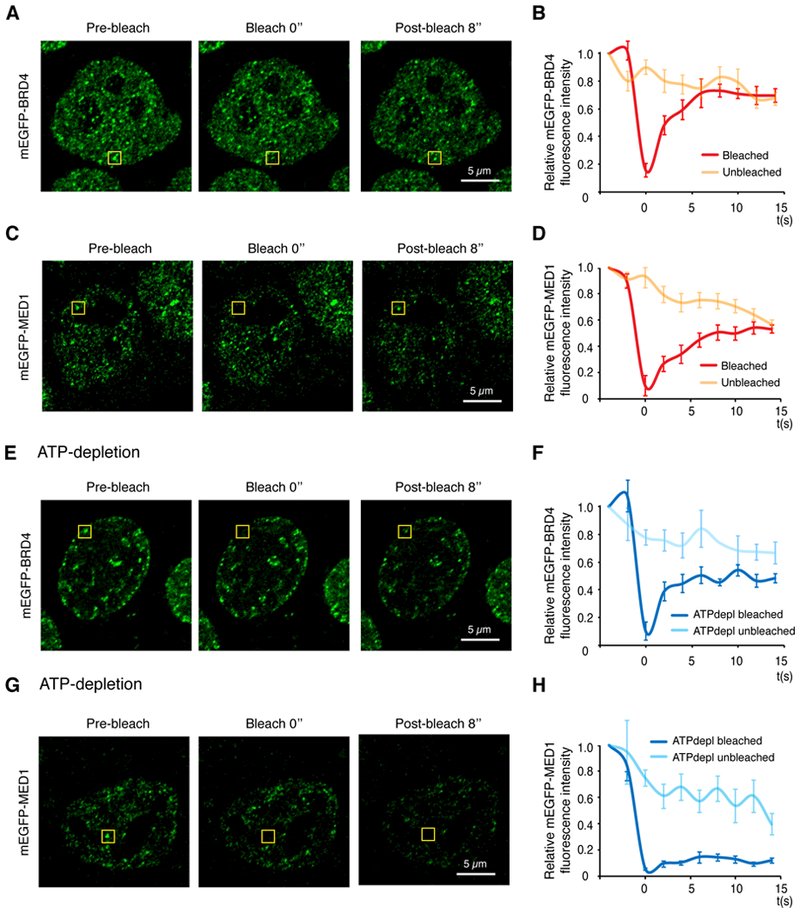
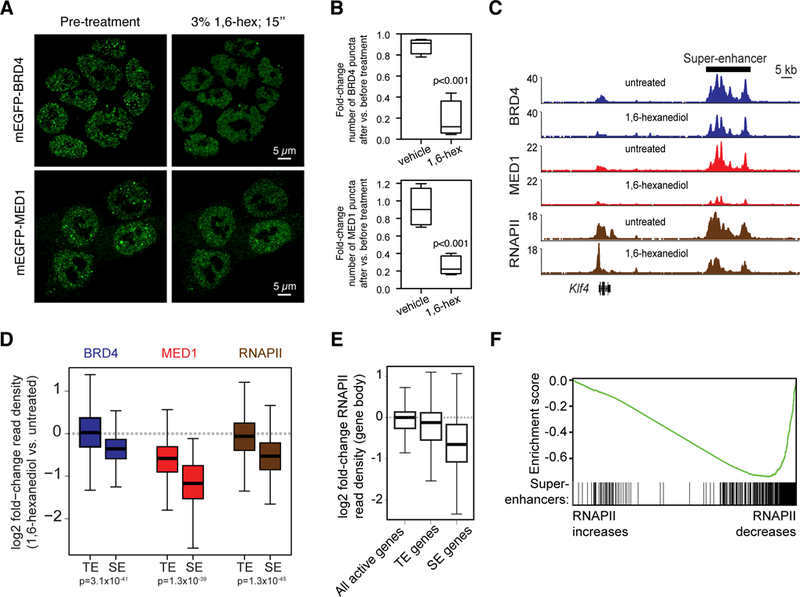
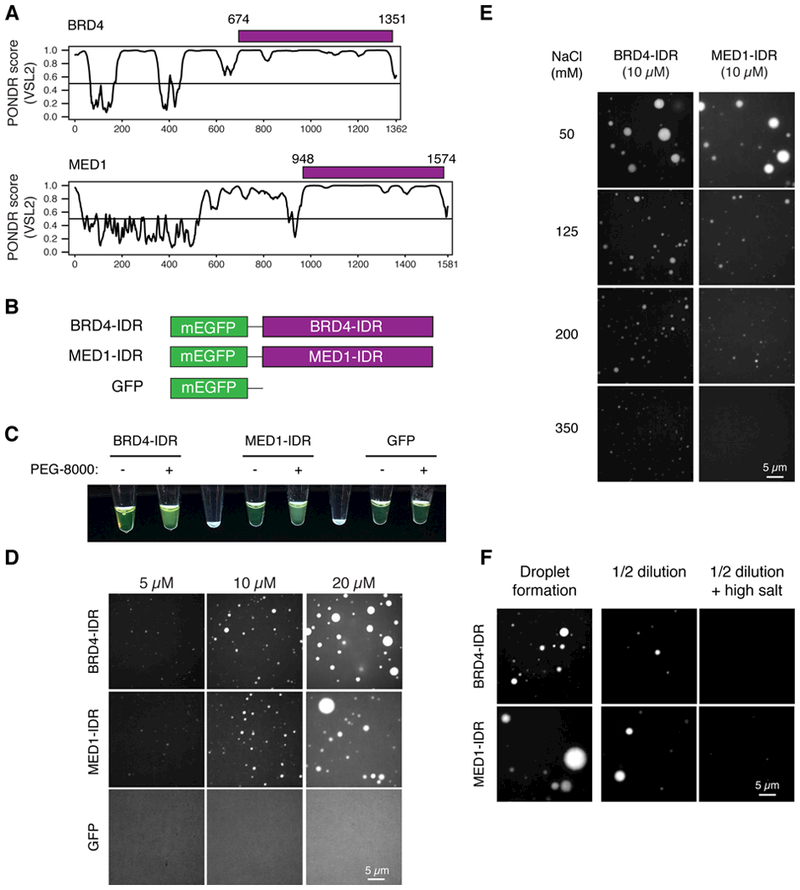
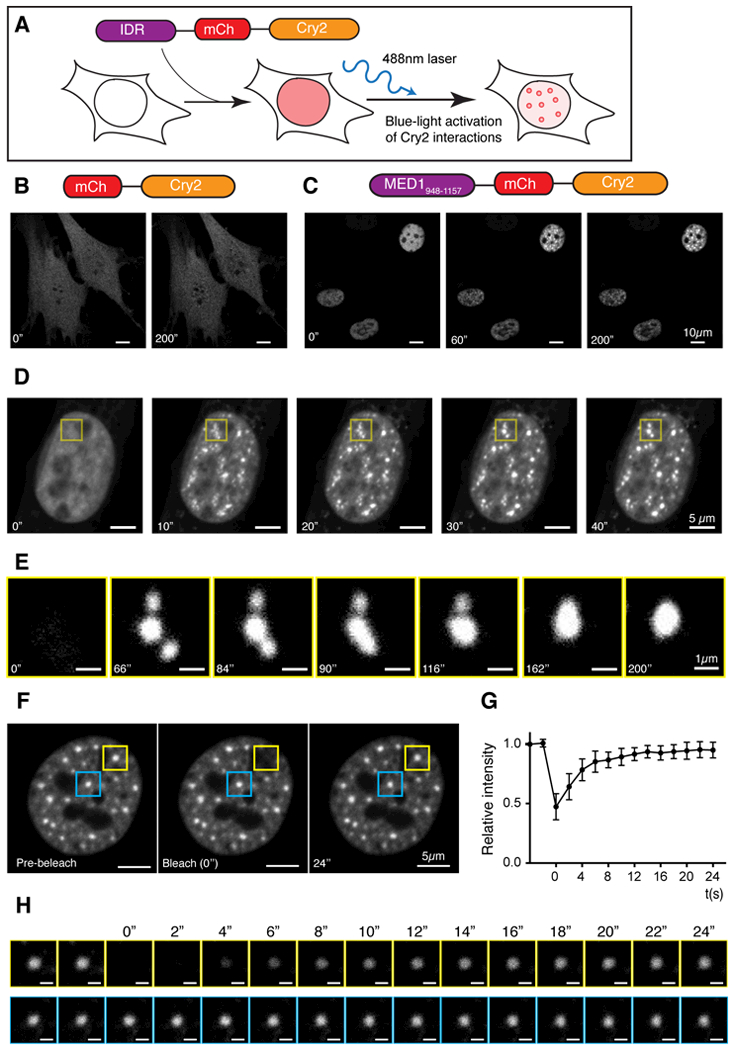
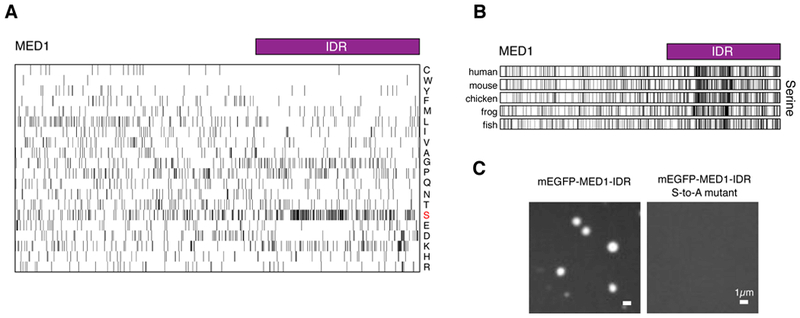
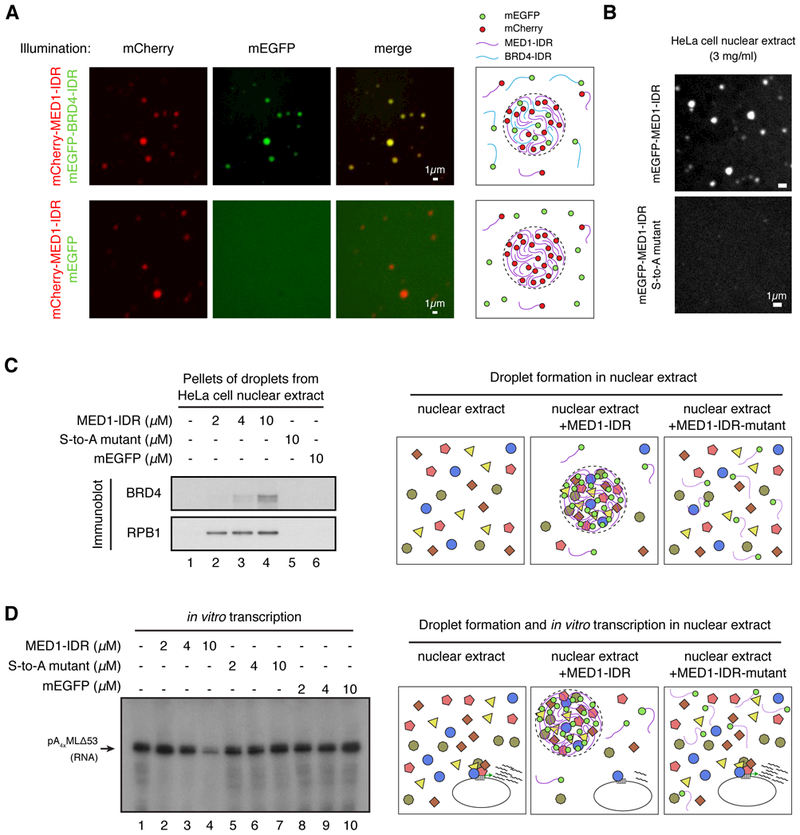
Super-enhancers (SEs) are clusters of enhancers that cooperatively assemble a high density of the transcriptional apparatus to drive robust expression of genes with prominent roles in cell identity. Here we demonstrate that the SE-enriched transcriptional coactivators BRD4 and MED1 form nuclear puncta at SEs that exhibit properties of liquid-like condensates and are disrupted by chemicals that perturb condensates. The intrinsically disordered regions (IDRs) of BRD4 and MED1 can form phase-separated droplets, and MED1-IDR droplets can compartmentalize and concentrate the transcription apparatus from nuclear extracts. These results support the idea that coactivators form phase-separated condensates at SEs that compartmentalize and concentrate the transcription apparatus, suggest a role for coactivator IDRs in this process, and offer insights into mechanisms involved in the control of key cell-identity genes.


Figures

Fig. 1.
Fig. 1.. BRD4 and MED1 form puncta at super-enhancers
(A) Immunofluorescence (IF) imaging of BRD4 and MED1 in mouse embryonic stem cells (mESC). Fluorescence signal is shown alone (left) and merged with Hoechst stain (right). (B) Live imaging of endogenously-tagged mEGFP-BRD4 and mEGFP-MED1 in mESC. (C) Depiction of Nanog locus, associated super-enhancers (black bars), DNA contacts (red arcs), BRD4 and MED1 ChIP-seq (green histograms), and location of FISH probes. (D) Co-localization between BRD4 or MED1 and the Nanog locus by IF and DNA-FISH in fixed mESC. Separate images of the indicated IF and FISH are shown, along with an image showing the merged channels (overlapping signal in white). The blue line highlights nuclear periphery, determined by Hoechst staining (not shown). The “Merge (zoom)” column displays region of image (yellow box) zoomed in for greater detail. (E) Averaged signal of either FISH, IF for BRD4, or IF for MED1 centered at Nanog DNA-FISH foci or randomly selected nuclear positions. (F) Co-localization between BRD4 or MED1 and the nascent RNA of Nanog by IF and RNA-FISH in fixed mESC. Data shown as in (D). (G) Averaged signal of either FISH, IF for BRD4, or IF for MED1 centered at Nanog RNA-FISH foci or randomly selected nuclear positions.
Fig. 2.
Fig. 2.. BRD4 and MED1 nuclear puncta exhibit properties expected for biomolecular condensates
(A) Representative images of FRAP experiment of mEGFP-BRD4 engineered mESCs. Yellow box highlights the punctum undergoing targeted bleaching. (B) Quantification of FRAP data for mEGFP-BRD4 puncta. Bleaching event occurs at t = 0s. For both bleached area and unbleached control, background-subtracted fluorescence intensities are plotted relative to a pre-bleach time point (t = −4s). Data are plotted as mean +/− SEM (N=9). (C) Same as (A) with mEGFP-MED1 engineered mESC cells. (D) Quantification of FRAP data for mEGFP-MED1 puncta (N=9), same as (B). (E) Representative images of FRAP experiment of mEGFP-BRD4 engineered mESCs upon ATP-depletion. (F) Quantification of FRAP data of mEGFP-BRD4 upon ATP-depletion (N=8), same as (B). (G) Representative images of FRAP experiment of mEGFP-MED1 engineered mESC cells upon ATP depletion. (H) Quantification of FRAP data for mEGFP-MED1 puncta upon ATP-depletion (N=8), same as (B). Images were taken using the Zeiss LSM 880 confocal microscope with Airyscan detector with 63x objective at 37°C.
Fig. 3.
Fig. 3.. 1,6-hexanediol disrupts BRD4 and MED1 puncta and disrupts BRD4, MED1, and RNAPII occupancy at super-enhancers and super-enhancer driven genes.
(A) Representative images of mEGFP-BRD4 or mEGP-MED1 engineered mESCs before and after treatment with 3% hexanediol for 15 seconds. (B) Box plot presentation of the fold change in number of mEGFP-BRD4 or mEGFP-MED1 puncta observed before and after addition of vehicle or 1,6-hexanediol to a final concentration of 3%. (C) Genome browser view of BRD4 (blue), MED1 (red), and RNAPII (brown) ChIP-seq data from untreated or 1,6-hexanediol treated (1.5% for 30 minutes) mESCs at the Klf4 locus. (D) Box plot representation of log2 fold-change in BRD4 (blue), MED1 (red), and RNAPII (brown) ChIP-seq read density (1,6-hexanediol versus untreated) for regions defined as super-enhancers (SEs) or typical enhancers (TEs) (see methods and Table S2). (E) Boxplot representation of log2 fold-change in RNAPII ChIP-seq density (1,6-hexanediol versus untreated) within the gene body (transcription start site to transcription end site) of all active genes (RPKM>1), typical-enhancer associated genes (TE genes) or super-enhancer associated genes (SE genes). (F) Gene Set Enrichment Analysis of genes, ranked by their log2 fold-change in RNAPII ChIP-seq density within the gene body and annotated against the set of super-enhancer-associated genes. Enrichment score profile and position of SE-associated genes is shown.
Fig. 4.
Fig. 4.. Intrinsically disordered regions (IDRs) of BRD4 and MED1 phase separate in vitro
(A) Graphs plotting intrinsic disorder (PONDR VSL2) for BRD4 and MED1. PONDR VSL2 score (y-axis) and amino acid position (x-axis) are shown. Purple bar designates the IDR under investigation. (B) Schematic of recombinant mEGFP fusion proteins used here. Purple boxes indicate IDR’s of BRD4 (BRD4-IDR) and MED1 (MED1-IDR) shown in (A). (C) Visualization of turbidity associated with droplet formation. Tubes containing BRD4-IDR (left pair), MED1-IDR (middle pair) or GFP (right pair) in the presence (+) or absence (−) of PEG-8000 are shown. Blank tubes included between pairs for contrast. (D) Representative images of droplet formation at different protein concentrations. BRD4-IDR, MED1-IDR or mEGFP were added to droplet formation buffer to final concentrations indicated. (E) Representative images of droplet formation at different salt concentrations. BRD4-IDR or MED1-IDR was added to droplet formation buffer to achieve 10 μM protein concentration with a final NaCl concentration as indicated. (F) Representative images of droplet reversibility experiment. BRD4-IDR (top row) or MED1-IDR (bottom row) BRD4-IDR or MED1-IDR, as indicated, (20 μM protein, 75 mM NaCl) (initial) or followed by a 1:1 dilution (diluted 1/2) or a 1:1 dilution with an increase to 425mM NaCl (diluted 1/2 + NaCl)
Fig. 5.
Fig. 5.. The IDR of MED1 participates in phase separation in cells
(A) Schematic of optoIDR assay, depicting recombinant protein with intrinsically disordered domain (purple), mCherry (red) and Cry2 (orange) expressed in cells exposed to blue light. (B and C) Images of NIH3T3 cells expressing either (B) mCherry-Cry2 or (C) a portion of the MED1 IDR (amino acids 948–1157) fused to mCherry-Cry2 (MED1-optoIDR). Cells were subjected to laser excitation every 2 seconds for indicated time. (D) Time-lapse images of the nucleus of an NIH3T3 cell expressing MED1-optoIDR subjected to laser excitation every 2 seconds for the times indicated. A droplet fusion event occurs in the region highlighted by the yellow box. (E) Droplet fusion event highlighted in (D) at higher resolution and extended times as indicated. (F) Image of a MED1-optoIDR optoDroplet (yellow box) before (left), during (middle) and after (right) photobleaching. The blue box highlights an unbleached region for comparison. Time relative to photobleaching (0”) is indicated. (G) Signal intensity relative to pre-bleaching signal (y-axis) and time relative to photobleaching (x-axis) are shown. Data shown as average relative intensity ± SD (n=15). (H) Time-lapse and close-up view of droplet recovery for regions highlighted in (F). Times relative to photobleaching are indicated. Scale bar, 1 μm.
Fig. 6:
Fig. 6:. Conserved serine bias is necessary for MED1-IDR phase separation
(A) Amino acid composition of the MED1 protein. Each row represents information for a single amino acid, single letter amino code shown on right. The length of the row corresponds to the length of the MED1 protein. Black bars represent occurrence of indicated amino acid at that position in MED1. Purple bar represents the IDR of MED1 under investigation. (B) Serine composition of MED1 protein from indicated organisms. Presented as in (A). (C) Mutating all serines to alanine disrupts phase separation. Representative images of wild type MED1-IDR or all serines to alanine mutant MED1-IDR (MED1-IDR S-to-A mutant) fused to mEGFP in droplet formation assay (10uM protein, 125mM NaCl, 10% Ficoll-400).
Fig. 7:
Fig. 7:. MED1-IDR droplets compartmentalize and concentrate proteins necessary for transcription
(A) MED1-IDR droplets incorporate BRD4-IDR protein in vitro. The indicated mEGFP or mCherry fusion proteins were mixed at 10μM each in Buffer D containing 10% Ficoll-400 and 125mM NaCl. Indicated fluorescence channels are presented for each mixture. Illustrations summarizing results shown on left. (B) MED1-IDR forms droplets in an in vitro transcription reaction containing HeLa cell nuclear extract, while the MED1-IDR S-to-A mutant does not. Representative images of indicated mEGFP-fusion protein when added to an in vitro transcription reaction containing HeLa cell nuclear extract at a final concentration of 3mg/ml (see Materials and Methods for complete list of components). (C) MED1-IDR droplets compartmentalize transcriptional machinery from a nuclear extract. Immunoblots of the pellet fraction of indicated protein added to in vitro transcription reactions (as in B). Illustration of a proposed model of molecular interactions taking place within MED1-IDR droplets in the nuclear extract is presented to the right. (D) MED1-IDR droplets compartmentalize machinery necessary for the in vitro transcription reaction. Autoradiograph of radiolabelled RNA products of in vitro transcription reactions under indicated conditions. Arrow indicates expected RNA product. Reactions conducted as in (69) with minor modifications. See Materials and Methods for full details. Illustration of a proposed model of molecular interactions taking place within MED1-IDR droplets in nuclear extract and the impact on in vitro transcription reaction is presented to the right.

Comment in

References

    1. Hyman AA, Weber CA, Jülicher F, Liquid-Liquid Phase Separation in Biology. Annu. Rev. Cell Dev. Biol. 30, 39–58 (2014). - PubMed
    1. Banani SF, Lee HO, Hyman AA, Rosen MK, Biomolecular condensates: organizers of cellular biochemistry. Nat Rev Mol Cell Biol. 18, 285–298 (2017). - PMC - PubMed
    1. Shin Y, Brangwynne CP, Liquid phase condensation in cell physiology and disease. Science. 357, eaaf4382 (2017). - PubMed
    1. Brangwynne CP et al., Germline P Granules Are Liquid Droplets That Localize by Controlled Dissolution/Condensation. Science. 324, 1729–1732 (2009). - PubMed
    1. Kato M et al., Cell-free Formation of RNA Granules: Low Complexity Sequence Domains Form Dynamic Fibers within Hydrogels. Cell. 149, 753–767 (2012). - PMC - PubMed

Publication types

MeSH terms